Measuring the performance of a software team is a difficult task. If you lead an agile team, it’s likely you’ve run into this issue. Agile reporting often focuses on the wrong kinds of things.
Leaders looking for help with agile reporting are usually looking at anti-KPIs, like the team’s overall velocity or how many lines of code they write. When team leaders measure the wrong things, software teams focus on what you measure, not on delivering value to customers.
In this post, we’re going to talk about what you should and shouldn’t measure with your agile projects. We’ll focus on the measurements that benefit your business and your customers. We’ll also highlight metrics that hurt your team, since every metric dumped into the bucket of agile reporting doesn’t provide equal insight. When we’re done, you’ll know the metrics you should focus on, and the ones you should throw out.
Table of Contents
- What is Agile Reporting?
- Agile Reporting Metrics You Should Ignore
- Agile Reporting Metrics You Should Focus On
- Get Agile Reports and Dashboards in Minutes
What is Agile Reporting?
Agile reporting is using select metrics and tools to get visibility into your software development life cycle that helps you make informed decisions about managing your agile team and projects.
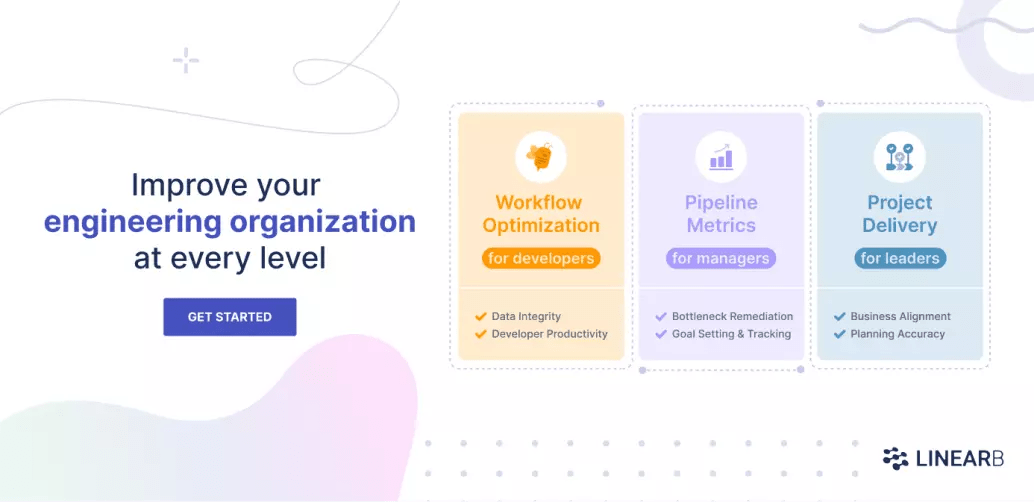
There are two flavors of agile reporting. The first is agile reporting for executives and stakeholders, which allows leadership to evaluate performance, measure progress and communicate updates with stakeholders.
The second kind of agile reporting focuses on more specific agile metrics and provides insight that team members can use to inform their day-to-day decisions.
Agile Reporting Metrics You Should Ignore
There’s a unifying attribute of all the metrics on this list: they’re easy to gather. Easy metrics are kind of like the Dark Side in Star Wars. They’re quick shortcuts to reporting on a team. They require very little thought, and they’re often trivial to gather. But they often twist and obscure the real value software provides.
As with all metrics, one of the key questions to ask yourself is: Why are we collecting this data? If you can’t easily answer that question about a metric to the team you’re reporting on, you shouldn’t use that metric to make decisions.
Lines of Code Written
This is one of the easiest software metrics to gather. It’s a sparkly metric for many executives because it’s easy to track week over week and compare between teams. It is also, as any developer will tell you, absolute poison.
Using lines of code written as a metric ignores a fundamental truth of software development: it’s impossible to measure the value of a single line of code. That might seem counterintuitive, but code is not like widgets produced in a factory or sales leads.
We can quantify the value of an average sales lead by examining the attributes of the customer and comparing them to similar customers we’ve sold to in the past. We know that a lead to a particular customer type tends to convert at a certain rate and deliver a certain dollar value in sales.
Software isn’t like that. Instead, code syntax is often variable, meaning that there are many ways to express the same thought. Oftentimes, it’s possible to express the same thought or behavior using 2 lines of code and 100 lines of code.
If I choose the method that uses 100 lines of code, the extra 98 lines of code often provide negative value. They’re more likely to contain bugs, and make the thought I’m expressing more difficult for other developers to read. In reality, it’s often the case that removing code is the most effective way to achieve a goal in software.
Velocity
Another common measurement of agile teams is team velocity. Velocity charts measure the number of story points completed in a sprint. It’s one of the most common ways to measure agile team performance. It is also, unfortunately, largely useless and sometimes dangerous.

Plus agile velocity measures a completely arbitrary value. It’s trivial for a software team to double their velocity in the space of one sprint. They can just estimate the complexity of each of their tasks twice as high as they usually would. By the end of the iteration, they’d complete no more work, and deliver no more value to the customer. But they’d double their velocity, making them look great on a metric dashboard.
Agile Reporting Metrics You Should Focus On
As a leader, it’s important to understand how your metrics change the teams you work with. Observing something people do changes the way they do it. When you’re choosing what to measure about your team’s performance, keep in mind that that decision will change the way they perform.
Our COO Dan Lines spoke to Chris Downard, VP of Engineering at GigSmart, about their dev culture and how what they measure effects it.
Teams will naturally gravitate toward trying to perform better on public metrics. They will, rightly or wrongly, conclude that their continued employment hinges on how well they perform. They’ll assume that things like bonuses and promotions will depend on their ability to meet metric targets. With that in mind, it’s important to remember the power your metrics have. They will actively reshape your engineering culture. So choose those metrics wisely.
Here are two we recommend you start with:
Cycle Time
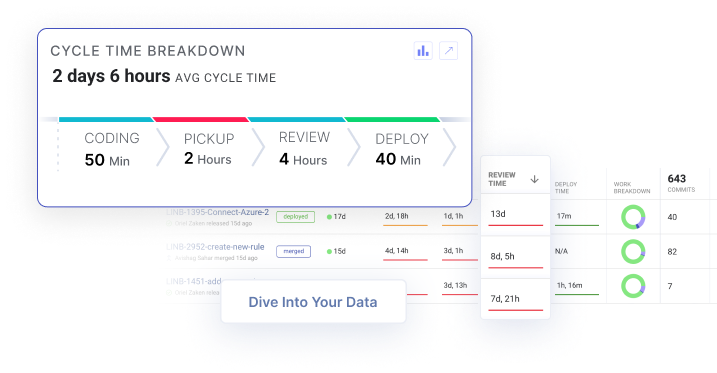
Cycle time measures the amount of time from first commit to production release. It is an important agile metric that impacts sprint planning, code quality, and deployment frequency.
More than half of teams surveyed in our LinearB Labs study had a cycle time of more than nine days. If those teams are running two-week sprints, that means any work they haven’t started coding by the fifth day of the sprint is likely getting carried over.
Measuring cycle time also empowers you to identify bottlenecks in your software development life cycle. We break cycle time into four phases: coding time, pickup time, review time and deploy time. And with one click you can dive deeper to see exactly which branches are contributing to your bottleneck.
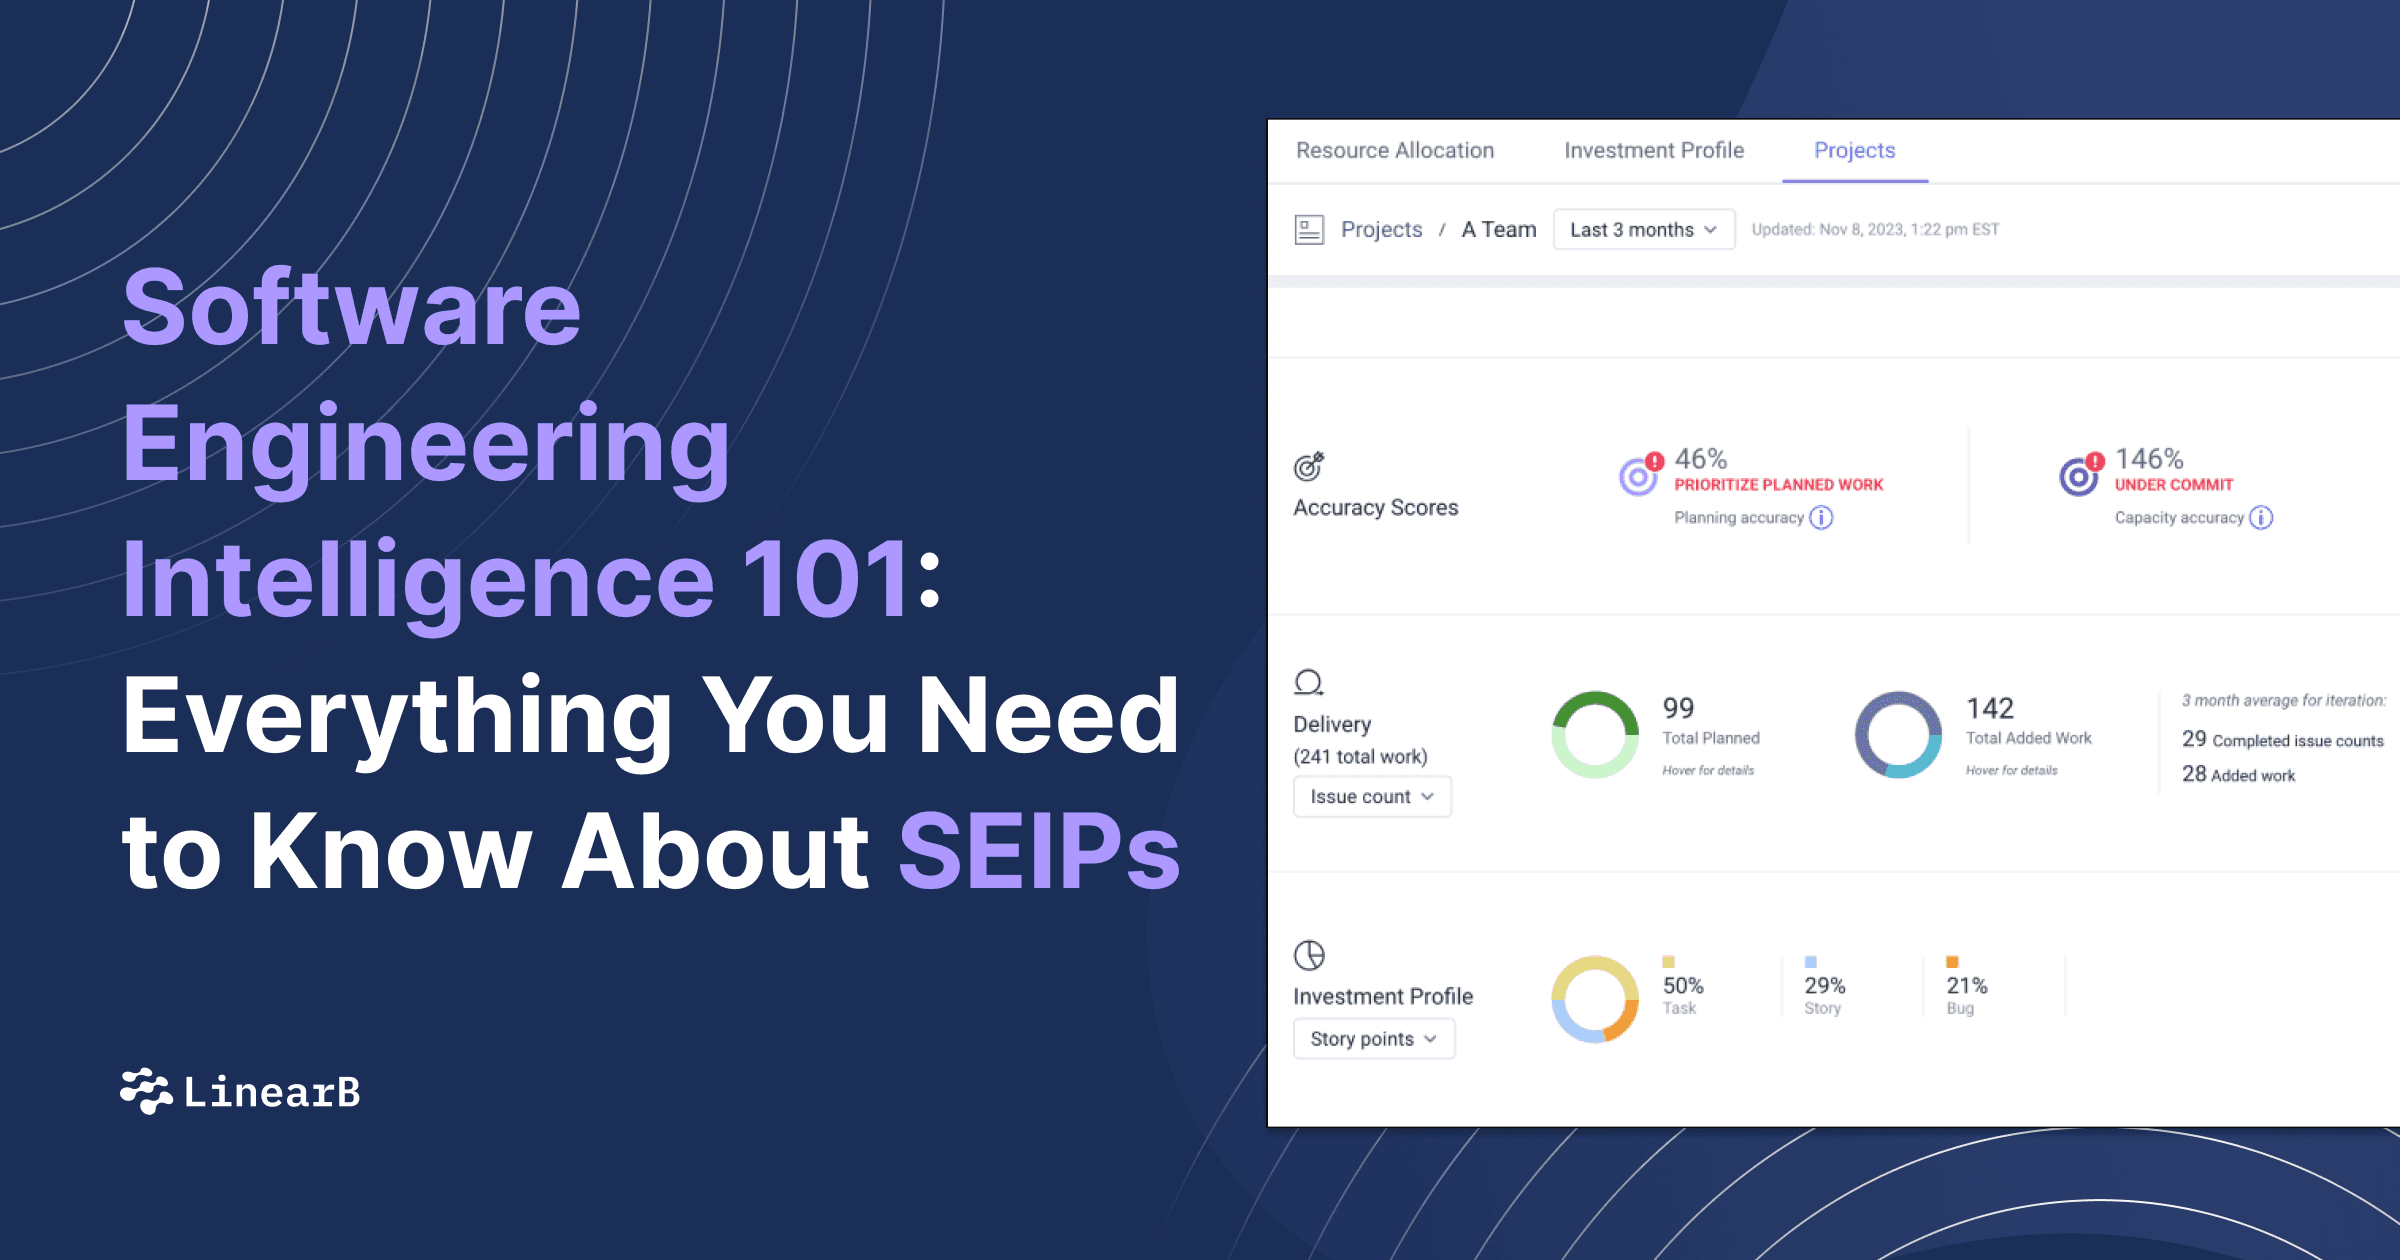
Planning Accuracy
Your CEO doesn’t trust your status reports and roadmap updates. And with good reason. Sadly, the industry average for planning accuracy is less than 50%. That means you and your team leads are wrong more than you’re right. This is because the standard project management and version control tools are just not good enough. It’s nigh impossible to extract insight.
Planning accuracy measures the amount of work you planned to complete vs the actual work completed per sprint. Our planning accuracy breakdown goes even deeper to visualize work planned, added, completed, and carried over.
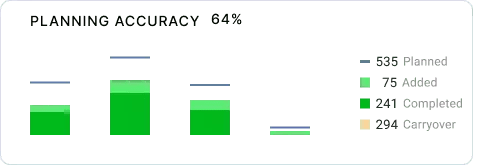
If your planning accuracy breakdown identifies a trend of added work being a large portion of what is delivered each iteration, you should have a conversation with your product owner and teams about hotfixes and scope creep. Now the question is “How do we balance between competing priorities to drive the best result for our customers and the company?” The latter is much more productive.
Get Agile Reports and Dashboards in Minutes
As we’ve seen here, many teams focus on the wrong agile reporting metrics. This focus harms their team and their business. It focuses developers and leaders on tracking the wrong thing, and modifies behavior in ways that harm the business.
Unfortunately, many executives believe that easy, harmful metrics are the only ones they can gather. They think that better metrics are too difficult to gather, but that couldn’t be further from the truth. Tools like LinearB make it easy to gather useful, productive metrics from the tools you already use.
When you focus on those better metrics, you unlock the potential of your team and align their work with your business goals. LinearB makes it easy to measure how well your team is performing and boosts that performance to delight your customers.