Imagine a car with a dashboard that only displays the fuel level. That would be great for keeping tabs on how much fuel is being consumed, but there are almost certainly going to be frequent visits to the auto repair shop. The dashboard has a number of indicators for temperature, oil life, RPM, speed, tire pressure, engine malfunction, mileage, and so on. To get the most out of that car, keeping tabs on fuel consumption alone cannot provide the right amount of information that’s needed.
Let’s bring this concept over to software engineering. Developers want to deliver code with high efficiency; it’s the main goal. Naturally, they’d want to track all the good stuff like deployment frequency. This is the more glamorous performance indicators.
But how teams manage incidents that lead to failure is just as important as how many deployments they can make in a day. Tracking incidents like delayed deployments, broken code that leads to failures, and feedback from unsatisfied customers will provide more well-rounded insights and can show what teams need to improve.
In this post, we’ll focus on the change failure rate. This metric provides useful insights into how much time is spent fixing problems. You’ll learn how it’s measured, how it can be reduced, and what a good failure rate is. We’ll also look at its relationship with MTTR and how to handle failures.
Table of Contents
- DORA Metrics
- What Is Change Failure Rate?
- How to Measure Change Failure Rate
- What Is a Good Failure Rate?
- Change Failure Rate and MTTR
- How to Reduce Change Failure Rate
DORA Metrics
The change failure rate is one of the DORA metrics, so before we go further, let’s briefly go over what those are.
The DevOps Research and Assessment (DORA) metrics are the industry standard, selected by Google’s research team, to assess the health and performance of software engineering teams. These metrics were selected after six years of research that surveyed thousands of engineering teams and expounded upon in the book Accelerate.
Those teams that performed well across these metrics had high levels of success. They include four key metrics that give insights into the overall reliability and productivity of a team. They are as follows:
- Deployment frequency
- Cyle Time (also known as lead time for changes)
- Mean time to restore
- Change failure rate
Deployment frequency is how often new code is shipped to production. Cycle Time is how long it takes a team to commit new changes to a project. They both track the agility or speed of a team.
Mean time to restore (MTTR) tracks the time to restore service after incidents that cause failures. Finally, change failure rate tracks failures that happen after deployment. These give insights into code quality, reliability, and stability.

What Is Change Failure Rate?
The change failure rate is the percentage of code changes that lead to failures in production. It’s code that needs to be fixed or called back after it has been deployed.
Also, this metric isn’t concerned with failures that happen before deployment. As a result, any errors caught and fixed during the testing phase won’t be considered when tracking the change failure rate.
It’s important to note that the change failure rate is not the same as just the failure rate. Incidents can happen after deployment without a change being made; also, errors can happen at the users’ end that are no fault of the developers. The difference is right there in the wording—change, which can be anything from new features to quick fixes made to code.
How to Measure Change Failure Rate
The change failure rate is calculated by dividing the total number of failed deployments by the total number of deployments.
For example, say your team makes ten deployments in a day. Out of that total, two return failures. The change failure rate for this scenario is 20%. That is, 20% of the code changes need to be fixed or rolled back.
What Is a Good Failure Rate?
This is easy. The ideal failure rate is zero. However, while nobody likes pesky bugs, they’re inevitable. According to DORA, elite and high-performing teams typically have rates that fall between 0% and 15%.
That’s the benchmark, the standard that teams need to maintain. Teams should have the right incident response processes in place to meet that standard. And maintaining good standards is dependent on the team maintaining code review best practices.
If your team’s rate rises above 15%, it means you’re spending too much time fixing problems. This will result in longer downtimes, which means reduced productivity. Review your processes and find the right solutions. High-performing teams can resolve multiple issues in a day; as a result, they have little downtime.

Change Failure Rate and MTTR
Although having zero failures would be ideal, it’s unrealistic. Mean time to restore, MTTR, is how long it takes a team to recover from failures caused by changes.
Normal operations don’t necessarily have to grind to a halt because there’s a failure reported. Some failures can be isolated by turning off features that develop bugs.
Bug and error reports, generated when systems detect failures, contain useful information on what needs fixing and why it failed in the first place. Understanding why these failures happen is key to ensuring subsequent code deployments have good quality.
Failures just need to be properly managed. You’d think dealing with failures before they happen is the best way to eliminate incidents. This might work in other industries but not necessarily in software development. How would you know when, or what, to improve?
Developers can learn a lot more from fixing failures than from preventing them. Remember the proverbial saying, “Attack is the best form of defense.” Yes, if you think something bad is going to happen, it’s right to try and stop it before it happens. But seeing, and knowing, exactly what needs to be fixed is so much easier than trying to stop what you think might happen.
How to Reduce Change Failure Rate
Just like you need the complete collection of information displayed on the dashboard of a car to properly maintain it, you need the correct set of metrics to track when things are going great with your code and another set of metrics to track when things are not so great. Metrics work best when they’re used collectively as opposed to using them individually.
Ultimately change failure rate is a lagging indicator of problems within your developer workflow. A high change failure rate should indicate that your engineering teams need to rethink their PR review process.
Here are some ways the change failure rate can be reduced:
- Avoid merging pull requests without review or with basic reviews.
- Increase your code review depth. Review depth measures the average number of comments per pull request review. This metric is an indication regarding the quality of the review and how thorough reviews are done.
- Make smaller deployments in frequent intervals. This way, failures are easily tracked and quickly fixed. Imagine having to dig through commits that go back days, or weeks, trying to find an elusive bug.
- Build automated monitoring and testing systems. Have multiple checks that alert the team when there’s an anomaly.
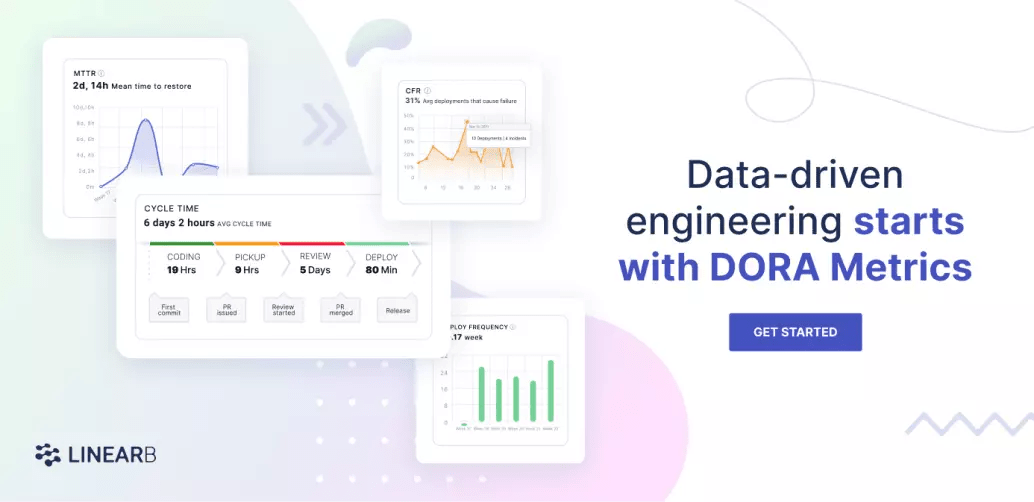
LinearB is a free tool that correlates data across your tools to provide team and organization-level DORA metrics within minutes. Then, once you’ve established your baseline metrics, you’ll be able to identify areas of improvement and automate developer workflow optimization.

Use LinearB to track these review quality metrics and set configurable guardrails to alert your teams when a potential quality issue occurs. Book a demo today!