Your company only measures your engineering team by your output, not your process. Your executives don’t care about commits, active days, or story points. They care about new features, happier customers, and getting more without spending more. So how can you quantify and communicate developer productivity to make the business/execs care about it even though it’s a subjective term? And how can you properly measure developer productivity to ensure your engineering org is aligned with desired business outcomes?
We’re here to help you find the best way to measure developer productivity in your company. And once you do, you can enable your team leads to improve their processes and efficiency.
Table of Contents
- What Is Developer Productivity?
- Measure Outcomes, Not Output
- Measure Teams, Not Individuals
- How to Measure Developer Productivity
- Barriers to Developer Productivity
- Improving Your Developer Productivity
What Is Developer Productivity?
Simply put, developer productivity is a measure of a team’s ability (not an individual’s, more on this later) to efficiently ship high-quality code that delivers business value.
Developer productivity should be both a qualitative and quantitative dataset. Building on the original DevOps Research and Assessment (DORA) report and 4 key metrics, the research team published the SPACE framework as a more holistic approach to measuring dev productivity.
But we won’t lie to you; you may have been using DORA metrics incorrectly. You need to measure many things, and it isn’t effective to focus on just a few KPIs to assess your developer productivity.
And you must remember that dev happiness and productivity aren’t mutually exclusive. So your team should consider other metrics and go beyond the frameworks mentioned above.
So with that, we now want to help you identify what you need to measure to truly gauge your team’s productivity.
Measure Outcomes, Not Output
Many software firms count the lines of code developers write to measure their productivity. They believe that the amount of source code and the project’s size directly reflect the program’s complexity.
But that’s not really ideal. Less is more. Developers live by these words. Pushing developers to write more code doesn’t make that code work any better, or solve problems faster.
So don’t prioritize outputs. Instead, focus on outcomes, especially delivering more features more often, or following through with delivery dates. This should allow your software engineering team to measure software developer productivity objectives. And at the same time, you’ll be promoting efficient processes that speed up development time.
Our co-founder and COO, Dan Lines, sat down with Kathryn Koehler, Director of Productivity Engineering at Netflix. They discussed how measuring outcomes over outputs helps properly measure engineering productivity.
Measure Teams, Not Individuals
Other firms assess how each individual team member is doing to measure developer productivity. They measure individual performance with metrics like time to review, the number of commits, average commit size, and the number or frequency of code reviews.
But this method doesn’t work. It’s a team, not a single person. Your team should be focusing on their shared accomplishments, and succeed together.
Instead of tracking individual performance for your devs, track how the team is performing. Check to see if they’re hitting their goals, encourage collaboration and let them grow together, not individually.
How to Measure Developer Productivity
Software companies can measure developer productivity in many different ways. For example, they can use metrics that measure efficiency due to problems like software bloat. Other companies measure performance based on customer satisfaction and product releases. But we want to simplify things even further, so we’re breaking down the exact productivity metrics you should analyze.
1. Cycle Time
Cycle time measures the amount of time your team takes from the first commit all the way to production. If your team has long cycle times, something is likely blocking them from progressing. If cycle times keep getting longer, the increase can easily lead to burnout or missed targets. So if I had to pick a single metric to measure, it would be cycle time.
In our Engineering Metrics Benchmarks study, we discovered that elite development teams have a cycle time of less than 48 hours. Typically a short cycle time correlates to small PR sizes, a healthy review process, and high deployment frequency. Overall, teams with an elite cycle time are able to deliver more features predictably and at a higher quality.
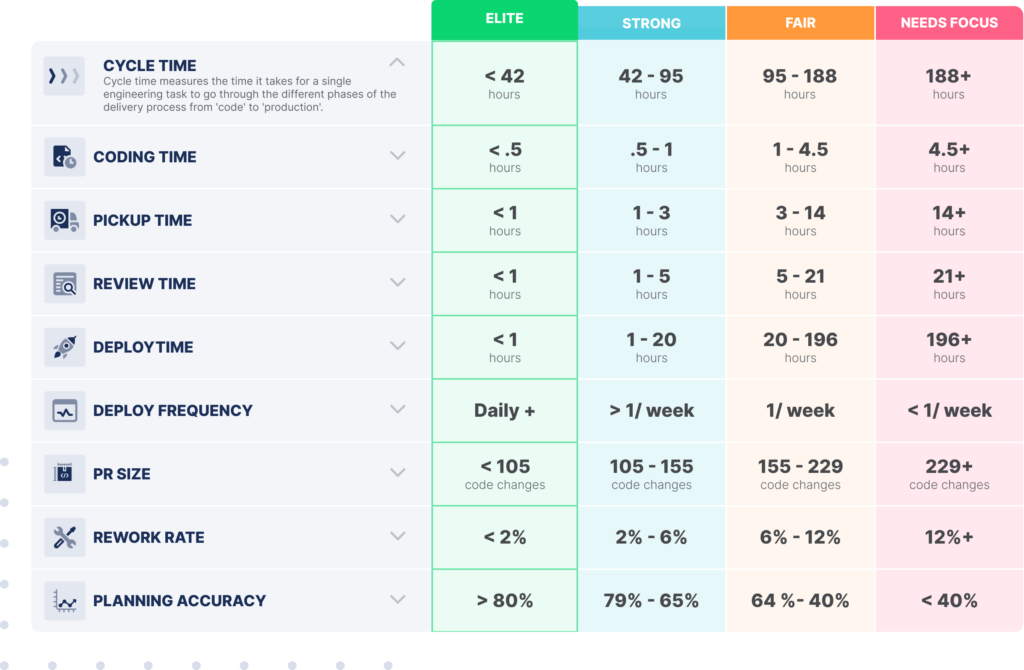 Want to learn more about being an elite engineering team? Check out this blog detailing our engineering benchmarks study and methodology.
2. Deployment Frequency
Deployment frequency is how often your teams release code. Teams that deploy often indicate a stable delivery pipeline, and production gets several small updates in a day. But, if your team isn’t deploying as frequently, you’re looking at bigger releases that might be unstable.
3. PR Size
Let’s be clear here: measuring lines of code is not a good way to measure productivity. Again, less is more, so don’t force your team to write more lines than they need to. This is also the case for pull requests, as larger PRs mean your team is taking a long time to develop and a long time to review them. Smaller PRs allow your team to pick up, review, and deploy faster and more consistently.
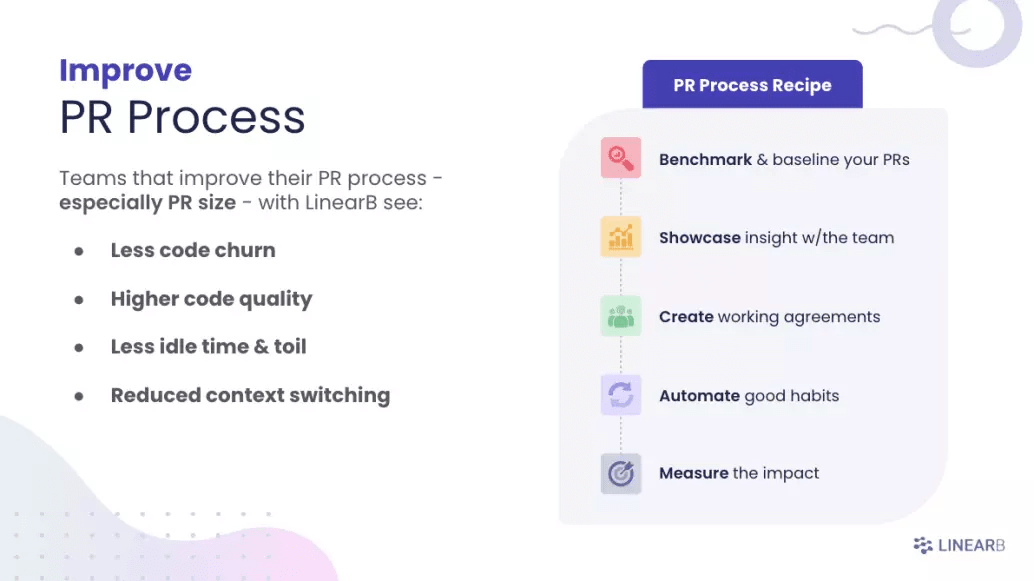 We know that streamlining your PR process impacts your productivity and efficiency. Learn more about our five-step recipe for improvement.
4. Rework Rate
Simply put, rework rate measures the amount of changes to code that’s less than 21 days old. If your team is spending a lot of time reworking code that’s just been deployed, that’s a sign of code churn or low-quality code. The less your team has to go back to rework, the better.
5. Investment Profile
Overall, an investment profile tells you what exactly your teams are working on. What percent of time is spent on user stories, bug fixes, or other tasks? Without it, you’ll only have a rough idea of what’s going on, and that doesn’t do anything for you. Tracking this allows you to answer the question, “Is the engineering team investing in the right types of work?”
And at LinearB, we help you see your investment profile clearly.
6. Planning Accuracy
What’s the point of a battle plan if it’s wrong? Measuring the rate of planned work compared to what your team delivered during a sprint is exactly what planning accuracy is. If you’re not hitting your goals each sprint, your team might be spending too much time on technical debt or unplanned work, both of which are detrimental to morale.
LinearB’s Project Delivery Tracker correlates data across your tools to identify the things that can affect delivering on your promises. And our planning accuracy breakdown helps teams can better estimate what they’re capable of, adjust expectations accordingly, and better predict if they will hit or miss promised deadlines.
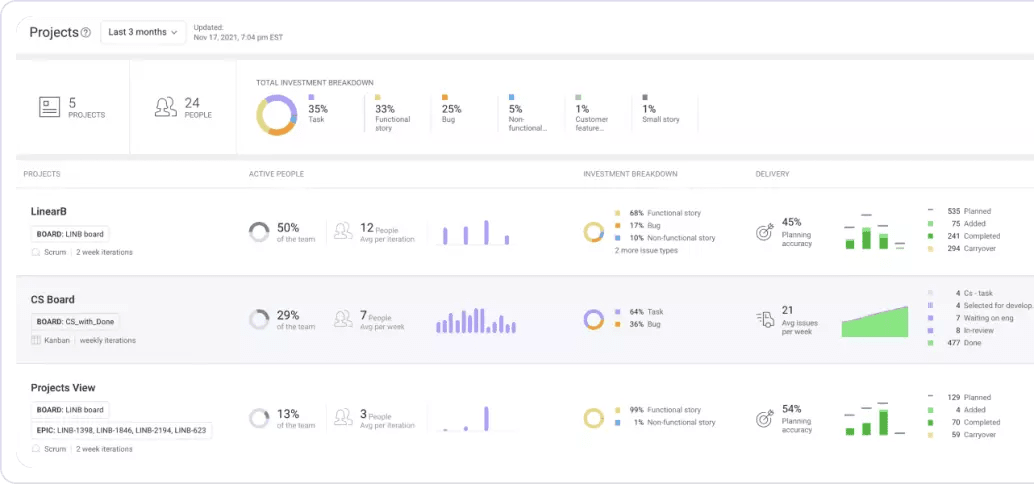 Your CEO will love this! You can see your team’s investment profile, project allocation, and planning accuracy by boards, epics, labels or custom fields. Learn more about Project Delivery Tracker.
But we know that sometimes, your developer productivity may suffer. So we’ll help you identify what’s stopping your developers from getting the job done. And because we’re feeling generous, we’ll also show you some tips to overcome these challenges!
Barriers to Developer Productivity
Technological complexity and waste often hinder development teams. Why? Because they have to juggle story points and productivity tools across multiple platforms. Plus, tacking on too many features or requests (aka scope creep) or consistently missing deadlines is bad news. Developer burnout is real, and it can lead to some devastating side effects. So how do you prevent it?
Scope Creep
It’s real – and it’s scary. If your team isn’t sticking to its targets that are laid out in the sprint planning meeting, it’s very likely scope creep is to blame. When teams keep taking on additional work during a sprint, doing so easily leads to burnout and further loss of productivity. Talk to your team, see what steps can be taken to reduce the chances of scope creep, and keep your devs happy.
Developer Experience
Speaking of keeping developers happy, are yours truly happy? If not, it easily leads to burnout or high turnover rates. LinearB focuses on three core metrics for developer experience: work in progress, burnout risk, and merge frequency. Keeping an eye on your team members’ workloads is vital to ensuring everyone ends up feeling satisfied and not frustrated at the end of a sprint.
Our Teams dashboard allows you to see all active days and WIP for the entire team. This boosts dev happiness and prevents members from getting burned out.
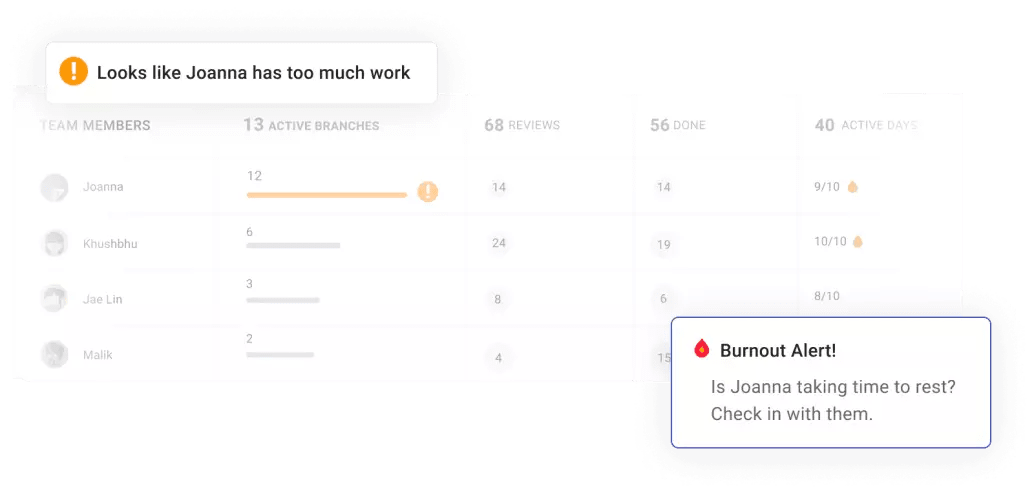
So with these things in mind, how do we tackle these challenges?
Improving Your Developer Productivity
Your engineering managers need to be able to measure developer productivity properly in order to improve it. Since you have many metrics to consider, you need to identify the right ones for your org and remember that developer workflow optimization directly correlates to developer productivity improvement.
We’ve developed a platform that not only automatically calculates dev productivity metrics using your existing tools, but our customizable Team Goals allow your team leads to establish working agreements with their devs on what needs the most focus. Then our developer bot WorkerB keeps dev teams on track with these goals and even allows devs to cut down on their non-coding tasks through automation, so they can focus more of their time on coding.
Sign up today for our free-forever plan for teams up to 8 or schedule a demo of how the LinearB platform can help your entire organization!
But don’t just take our word for it!
 Want to learn more about improving software development productivity? Check out how our customer Hippo Insurance increased their productivity.