What Are You Working On?
As a software leader, you probably ask this question of your team and hear it from your CEO frequently. In either case, hopefully, the answers aren’t surprising. Most leaders have found themselves needing to check with team members before having an accurate answer.
As your team scales, visibility into what is being worked on becomes more difficult to see on a real-time basis. In addition, the number of people interested in the answer grows as well. Product management, marketing, sales, customer support, and others all “check-in” to see if your team is working on the thing that they care most about.
How can leaders have a real-time automated view of the breakdown of what their teams are working on? How can you balance the time and care needed to keep your product availability high, respond to customer requests, fix bugs, and still deliver new value predictably?
What Is An Investment Profile?
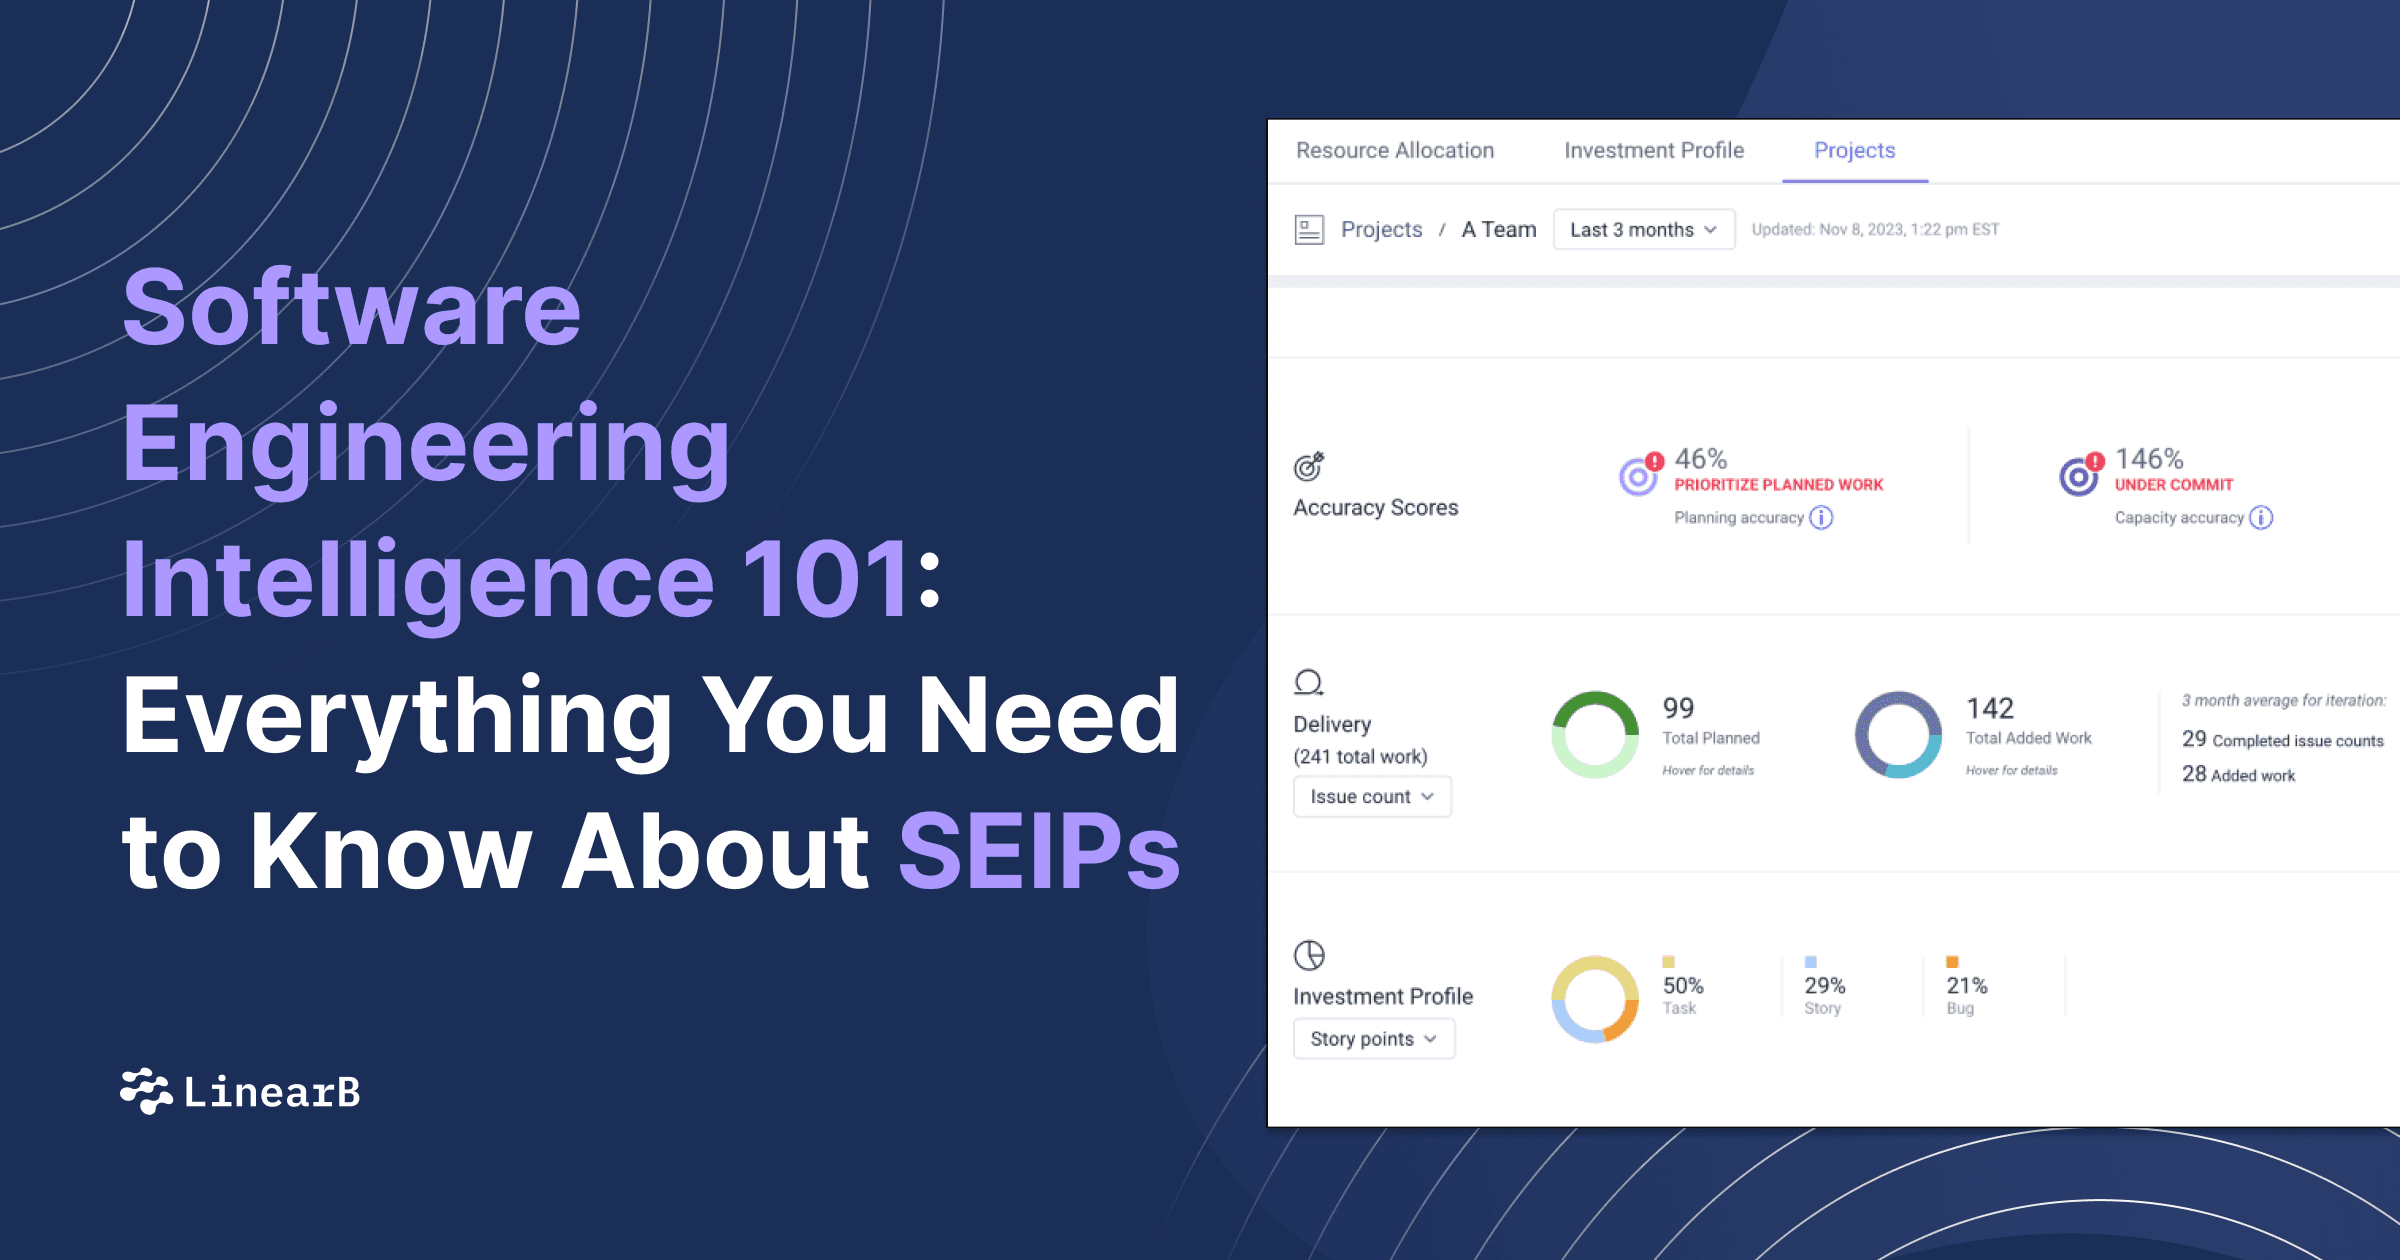
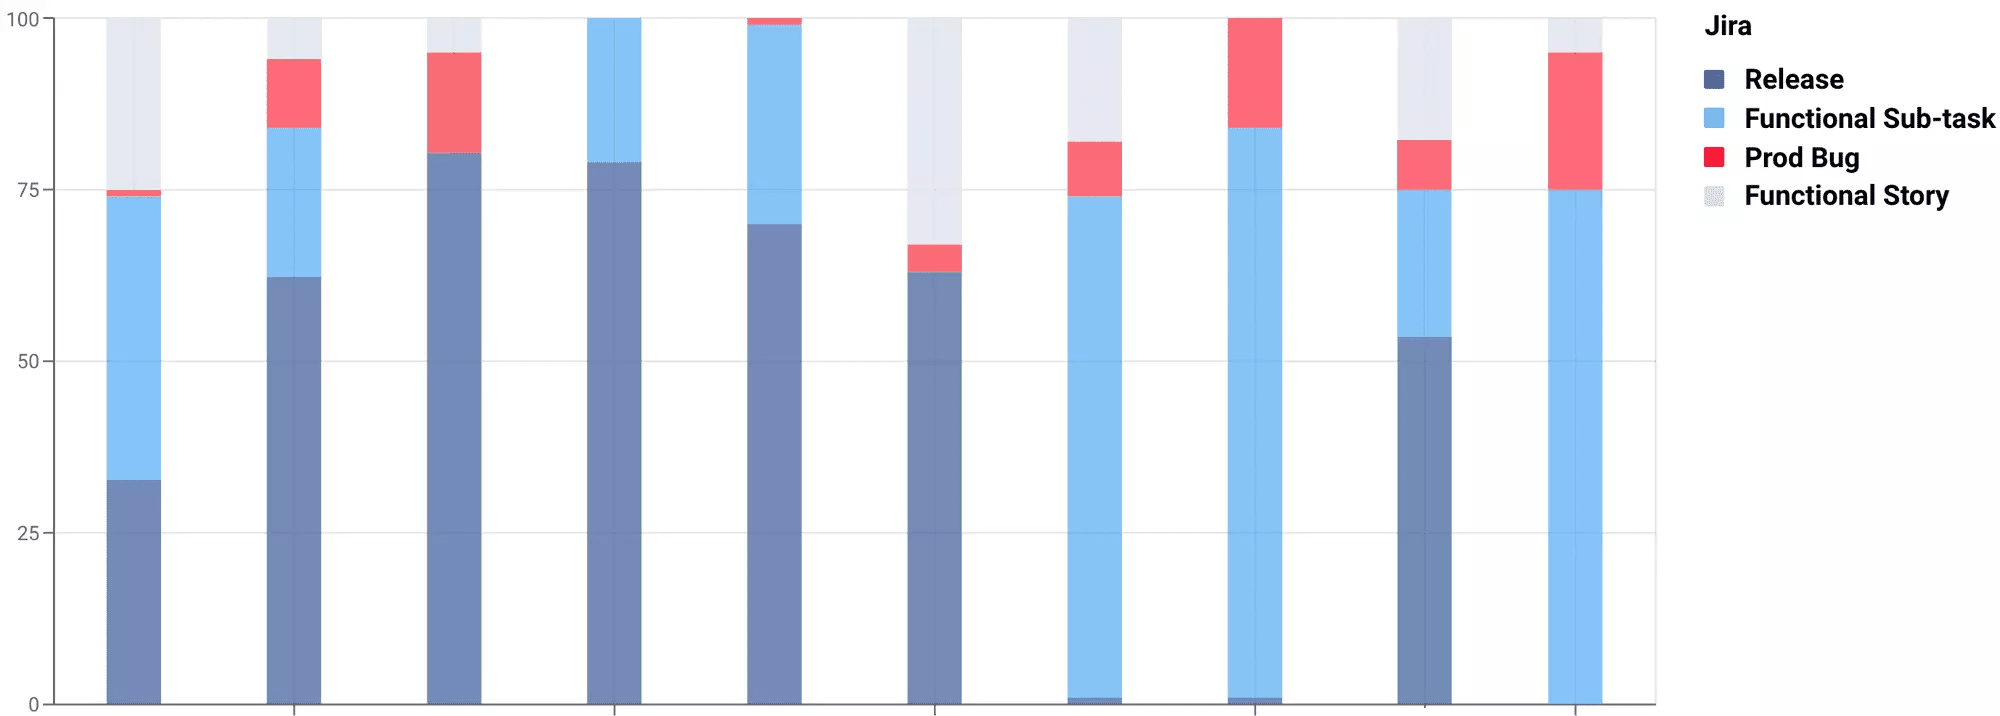
Basically, your investment profile answers the question of “what are we working on?”. It measures how much time your team spends on different types of work. It is broken down into percentages. Typically, software leaders should know at a minimum of the following categories:
- Stories or New Value Delivery (building a new product or new functionality)
- Bug Fixes
- Non-functional work (backend work to ensure reliability, availability, stability, speed, performance, security, speed, etc.)
For each of these categories, leaders may choose to break them down into sub-categories. For instance, tracking time spent on bugs found in production vs bugs found before release is important for quality purposes (learn more about the connection between quality and efficiency). Another breakdown that some teams are tracking is work tagged for customer/support.
It’s also important to have a view of your investment profile in the organization level, team level, and iteration level.
Why Is Your Investment Profile Important?
Improved Visibility & Communication
Monitoring your investment profile gives you better visibility into what is happening with your teams. Your people’s time is your most precious and scarce resource. One of your primary jobs as a leader is to marshall those resources appropriately to develop a stable, feature-rich product.
Tracking your investment profile can also help you improve the conversation with your executive peers and CEO. Chances are you hear “what are you working on?” or “when will [feature x] be ready?” pretty regularly. A real-time automated view of your investment profile provides the insight you need to communicate throughout your organization. Having the data at the ready helps you address concerns and also make the case to add resources if they are needed to help your team hit deadlines with quality deliveries.

Hitting Delivery Deadline
Missing new feature deadlines creates chaos throughout the organization. In addition to being disruptive for your engineering team, the ripple effect can impact product managers, customer service, sales, marketing, and more. Having an unbalanced investment profile can create a negative recurring cycle. Focusing too much effort on stories to the neglect of backend work causes quality to decline, which increases the likelihood that code will need rework. This derails future iterations with bug fixes and impacts your team’s ability to hit future feature deadlines.
Maintaining a Balanced Approach
Many leaders strive for a “balanced” investment profile. A balanced investment profile simply means that your team is delivering new features for sales, supporting existing customer needs, and completing non-functional backend task for scalability, performance, or service maintainability. Keeping an eye on your investment profile and tracking performance over time helps leaders keep teams aligned with organizational goals.
How Can I Measure It?
The Project Management Perspective
The traditional way to measure your investment profile is from your project management tool (Jira, or equivalent). It is typically done manually, after the fact. This is time-consuming and is only as accurate as your ticket hygiene (we know engineers never lag in updating Jira tickets 🙂 ). It can be useful as a lagging indicator to set a benchmark and measure improvement.
A better way to calculate and use your investment profile is by automating the process. Being able to access your real-time investment profile at any time helps your team and organization become and stay more agile.
The Engineering Perspective
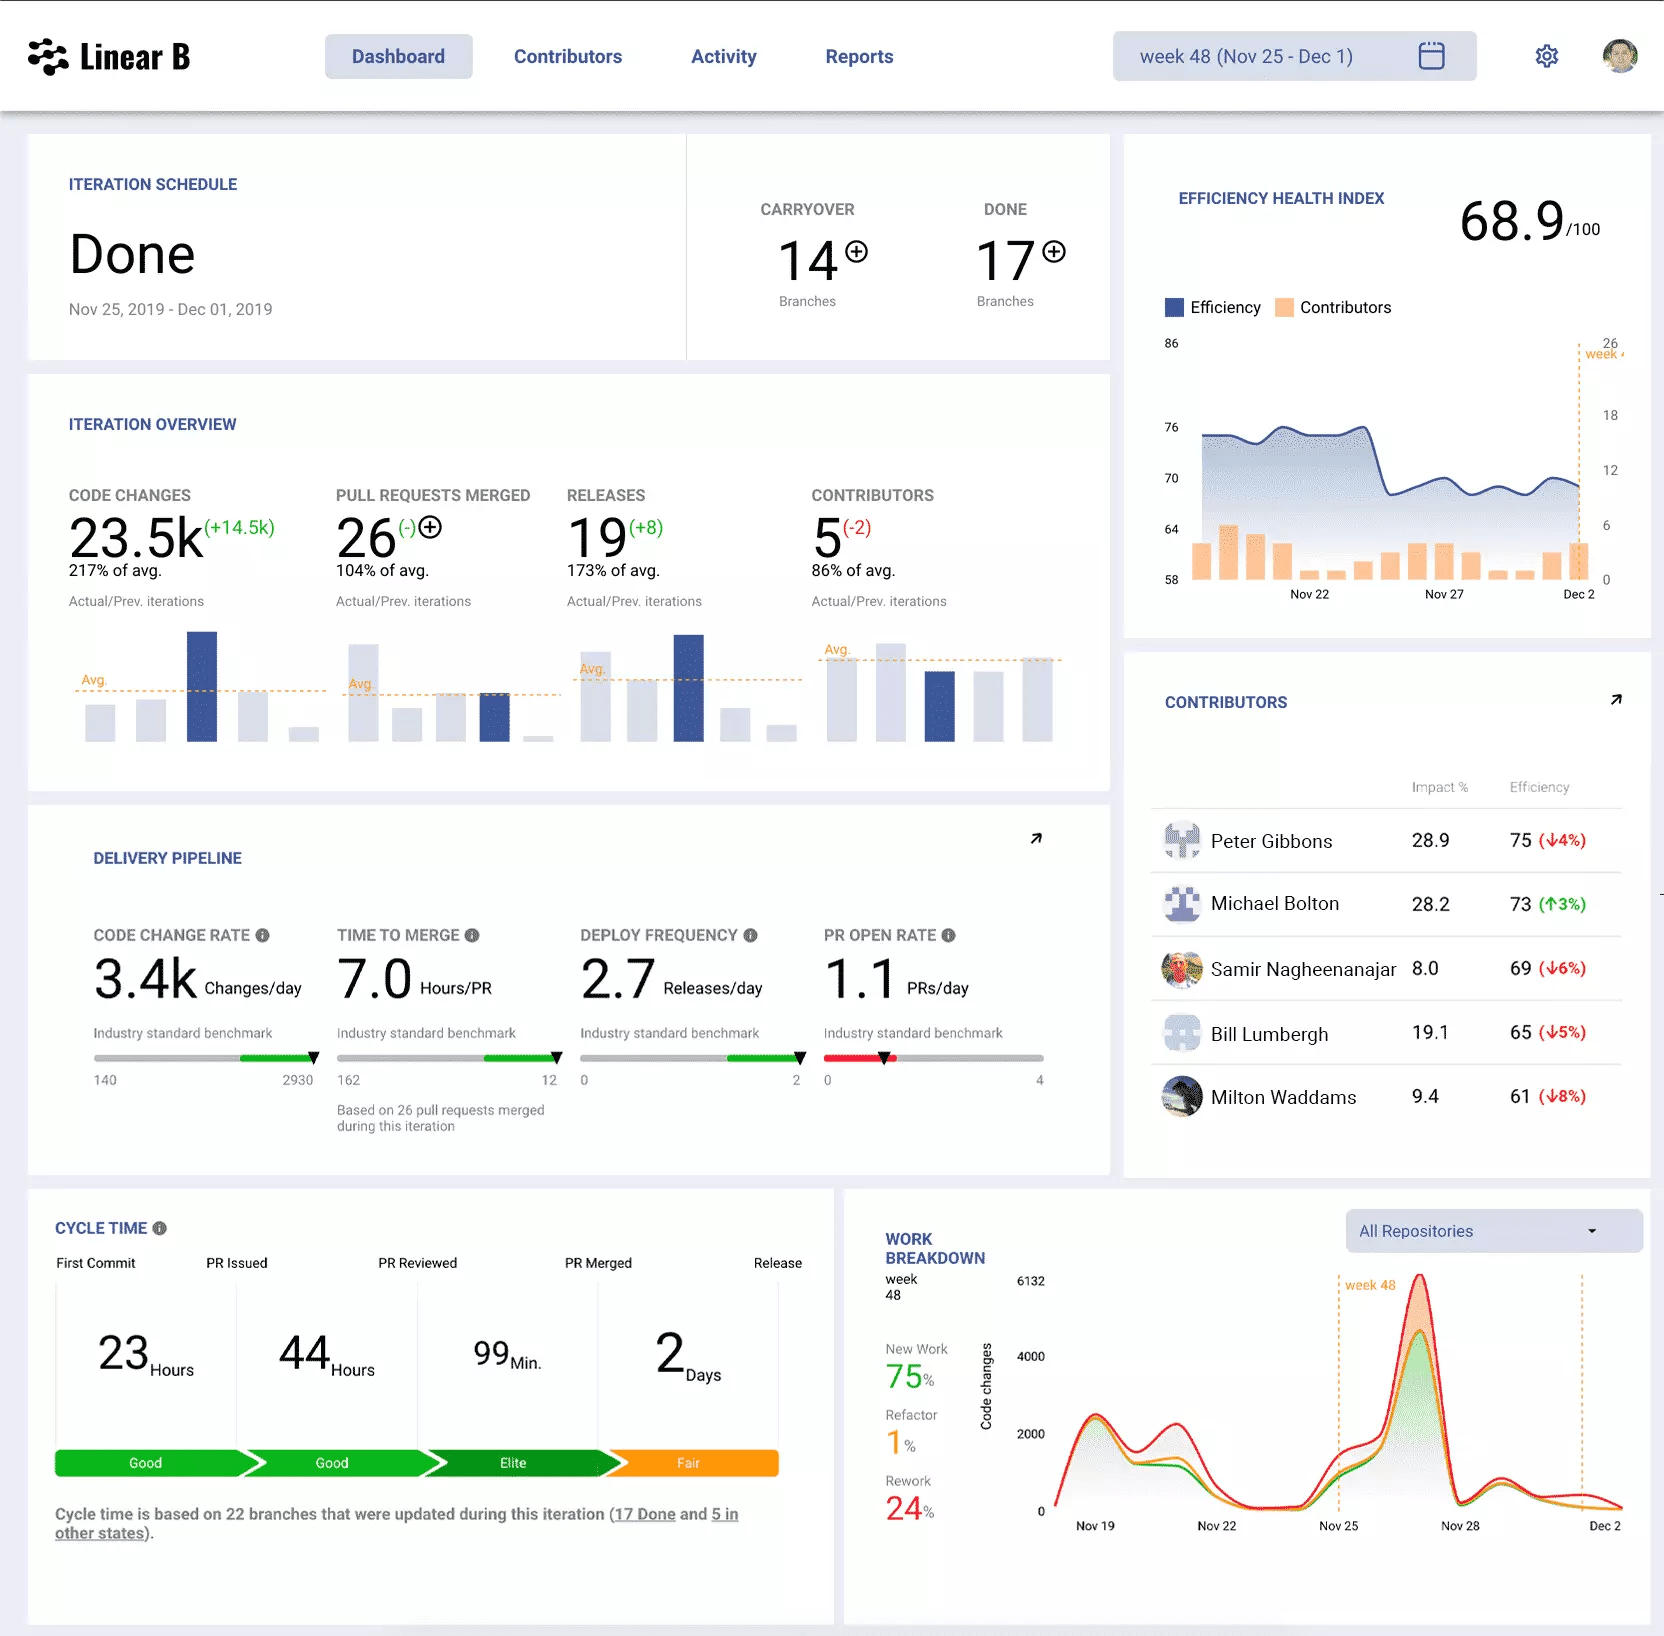
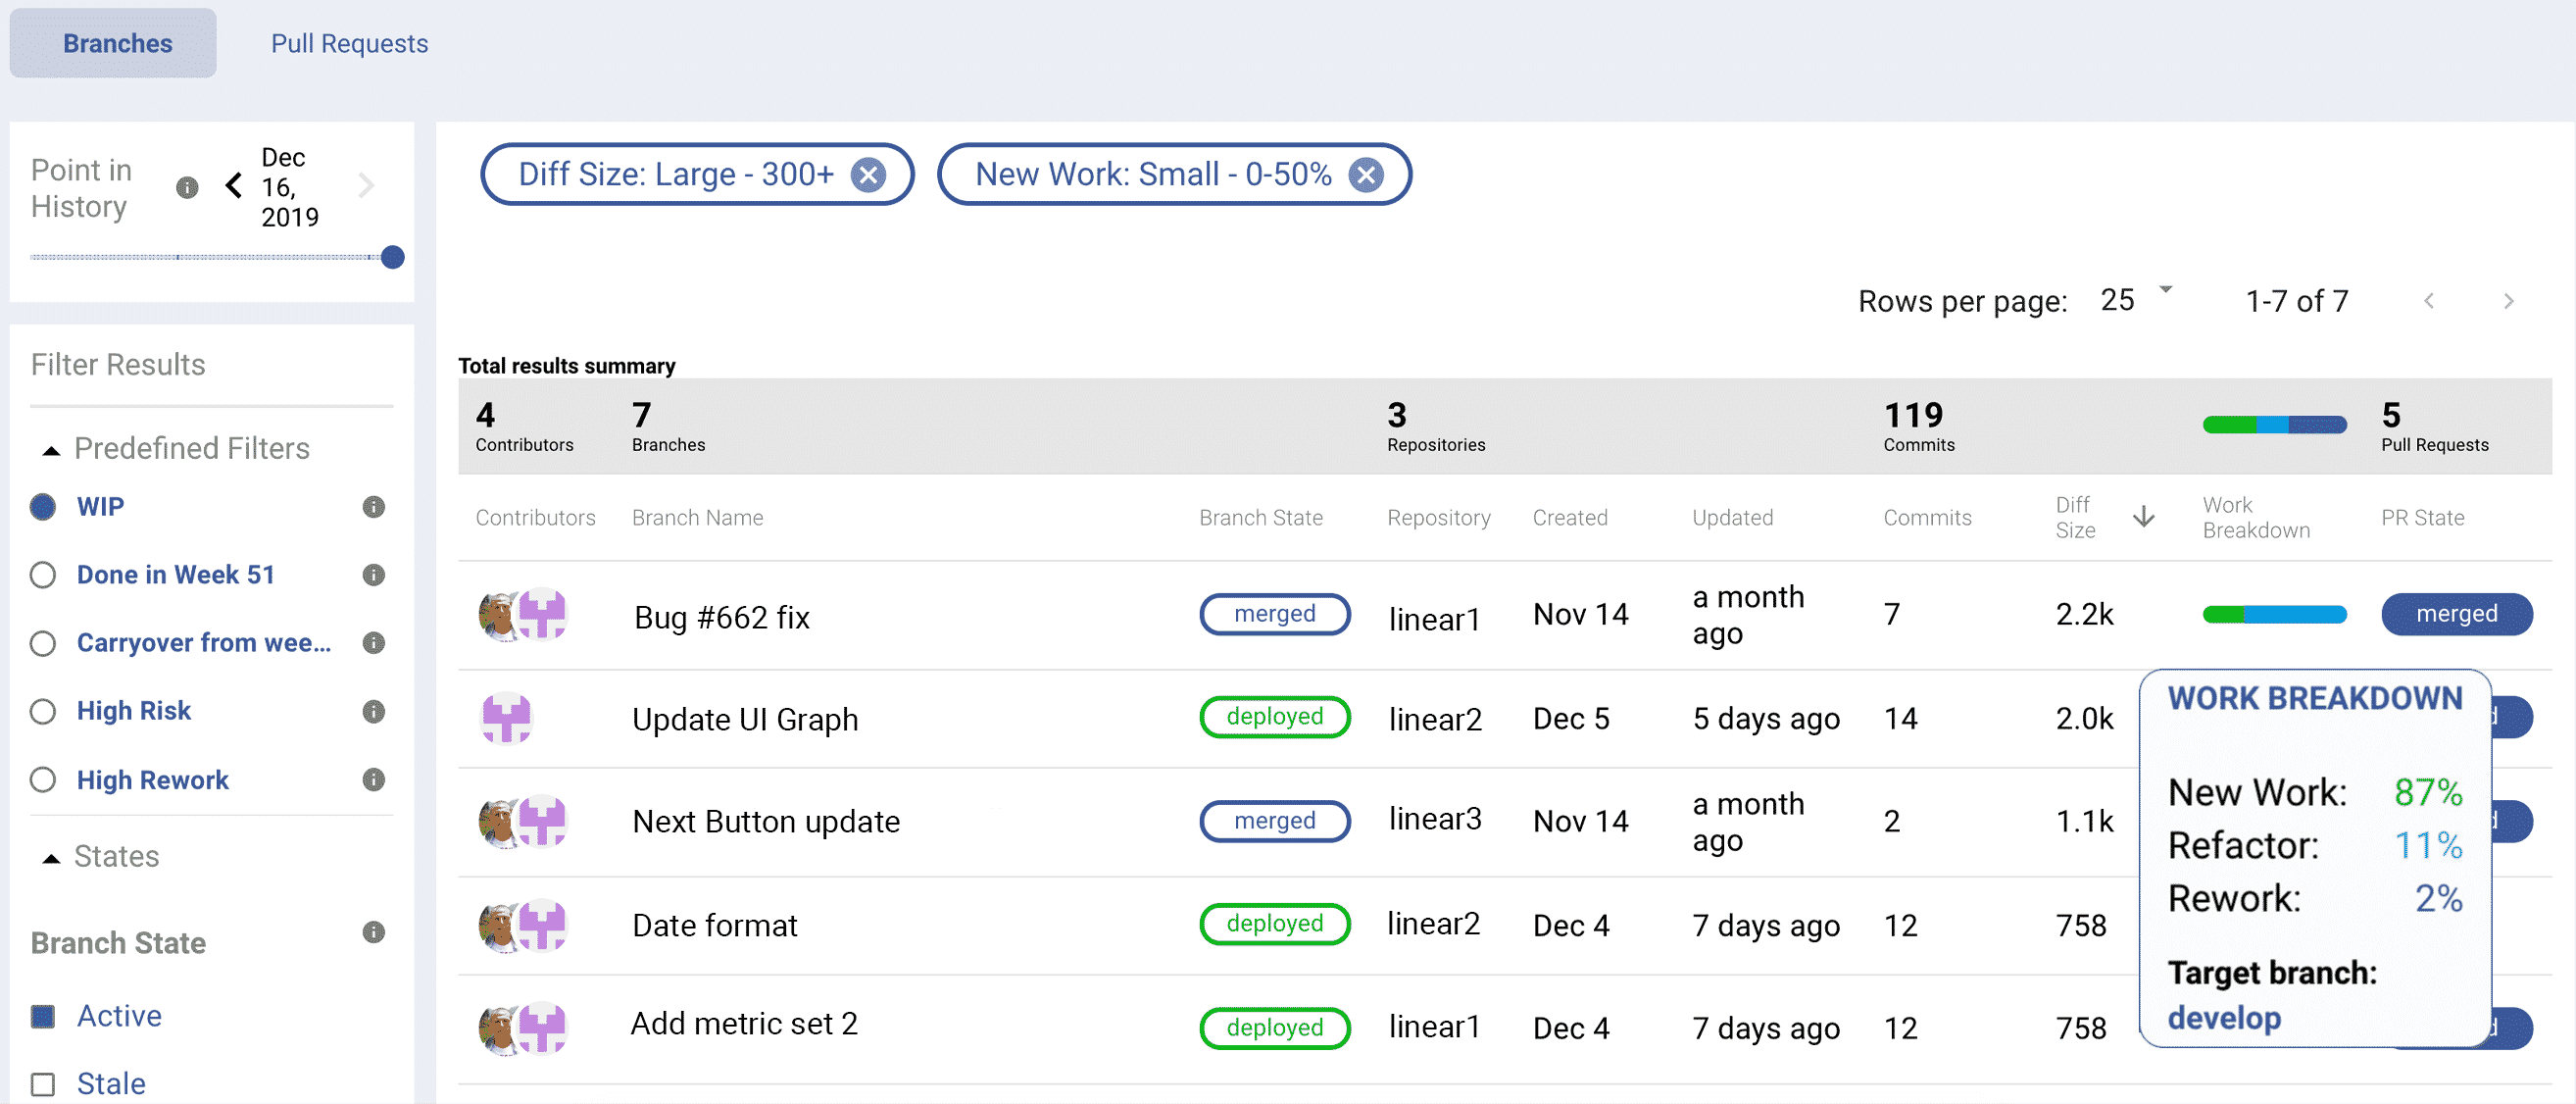
In addition to the project management perspective, many engineering leaders are becoming more interested in what we’re calling an “Engineering Effort Profile.” This profile is calculated by looking at the actual code being developed. For many teams, it makes sense to answer the “what are you working on?” question by looking at what is actually being worked on in branches, repositories, pull request reviews, and more.
The effort profile gives leaders a more detailed view of their team’s work. It provides visibility into:
- Work Breakdown: % of code that is New, Refactored, or Reworked
- Work Distribution: How is your work allocated across teams or contributors.
- Work In Progress (WIP): Real-time view of active branches and pull requests
Armed with a real-time, automated, view of your WIP from your code repos helps you answer several key questions beyond just “what are you working on?”. It provides insight into your code quality, helps identify what teams or contributors are overloaded, and how many branches are associated with your tickets.
When we built LinearB, one of the most important features we wanted to give engineering leaders was the combination of project management and GIT (actual coding) insights into one view, built automatically in real-time. With LinearB, engineering leaders are quickly accessing real-time views of your investment and effort profiles and tracking progress against benchmarks.
How Can This Make My Team Better?
Visibility and Communication:
Earlier we talked about how having a good handle on your investment profile helps change the conversation with your CEO and executive peers. It also advances how you can empower and communicate with your team leads. Establishing a common language and goals around how to balance the investment profile for your organization helps drive the conversation with your team leads. This is particularly helpful for bringing new team leads up to speed.

Delivery Bottleneck Detection:
Another useful function of the investment profile is to help you identify bottlenecks in your new value delivery. If one of your teams is bogged down with bug fixes, chances are they are behind on completed stories. The investment profile can help you identify bottlenecks, and the effort profile gives you the information you need to understand what repositories and teams are impacted. As a leader, this gives you what you need to help your team improve.
Quality Improvements:
Your investment profile can also shed light on quality issues and their impact. Tracking not just amount of bugs, but the time and effort it takes to fix them helps you wrap your arms around the scope of any quality issues.
Workload Issues:
Combining investment and effort profiles enables you to identify workload issues. Is one team or contributor overburdened? Is your team or product too dependent on one resource (and what happens if they quit)? We could write an entire post on this. . . . . maybe we will :).
Start Measuring Today
Modern software leaders use data to make their teams better. Tracking your investment and effort profile in a real-time, autonomous fashion gives engineering leaders the visibility and data they need to make more informed decisions, keep their team agile, build a rock-solid product, and predictably hit delivery deadlines. Sounds pretty great, right?
LinearB was built by and for engineering leaders. It delivers engineering leaders their investment profile and other key metrics they need to optimize the way their team runs. If you’re ready to go faster, hire better, and deliver more, then it’s time to get started with LinearB. Start your trial and start seeing your metrics in 5 minutes.