Every software team faces a big question: How do we measure success? Sure, your team writes some code. They review some pull requests. They might run some tests. Finally, they ship some software. All of that is great.
To the software team dedicated to continuous improvement, that process still leaves questions: Were we successful? Could we have done a better job? How did this software deployment compare to others? One way that agile software teams measure their performance to answer some of these questions is by measuring their sprint velocity, which is what I’ll be detailing in this post.
Table of Contents
- Sprint Velocity: What Is It?
- Key Things to Know About Sprint Velocity
- Don’t Abuse the Velocity Metric
- Conclusion
Sprint Velocity: What Is It?
To understand sprint velocity, it’s important to first discuss sprints. Software teams split their development cycles into discrete chunks of time that they call sprints. Each sprint has a well-defined list of tasks to accomplish, and the team commits to finishing all of them within the sprint window.
That’s usually two weeks, but some scrum teams adopt sprint windows that are one week, others one month. There’s no specific time window. The key is that each sprint is exactly the same length so that you can compare them.
Before the start of a sprint, a team estimates the complexity of each task in their product backlog. The mechanics of that estimation vary from team to team.
Many teams use story points, which are made-up numbers that represent nothing but one user story’s complexity relative to all the other stories in the backlog. A major advantage of using story points is that you can then leverage a tool like Jira to generate a sprint burndown chart, which succinctly captures a team’s progress during a sprint.
Some teams skip abstract story points and directly estimate the number of hours they’ll need to complete a task. Other teams skip numbers completely and adopt a T-shirt sizing method of estimating complexity. No matter the work estimation method, calculating velocity is straightforward:
Sprint velocity is the average number of story points or hours of development work or T-shirt sizes the team completes in the average sprint.
Key Things to Know About Sprint Velocity
If you’re just beginning to use sprint velocity as a metric for your software teams, there are several things to understand about it.
Velocity Is Descriptive
As a software developer, this is probably the #1 thing I wish more managers understood about sprint velocity. It’s a descriptive metric, not a prescriptive one.
To put it a different way: measuring a team’s sprint velocity is like measuring the average height of your team members. Once you’ve calculated it, that average height is an innate attribute of the team. You wouldn’t come to your software team and tell them, “Our goal is for every person on this team to be 6’3″ tall.” That would be an absurd way to try to manage them.
Sprint velocity is a similar measurement. It will tell you about how tall the team was at a given moment, and allow you to compare between sprints completed by the same team.By understanding how fast you went in previous sprints, you can then make more accurate predictions about how fast you’ll go in future sprints.
With LinearB, you can get the insights you need to start planning better right away. For example, our Planning Accuracy metric tells you how much planned versus unplanned work your team completed during previous sprints. And with our engineering metrics benchmarks, we’ll also tell you how well you’re performing compared to other teams.
A high amount of unplanned work suggests that your team is having to fix bugs or pay off technical debt in order to implement new features. Whatever the cause, LinearB makes it easy to investigate.
Sprint Velocity Is Variable
I recognize that this seems to contradict the idea that sprint velocity is an innate attribute of the team, but hear me out. The members of each sprint team are people. People have better and worse days, and better and worse weeks. They get sick, and they go on vacations (which you should encourage as a leader).
To return to the height metaphor: not everyone stands as tall as they can all the time. Sometimes, a person needs to crawl around on the ground to try to find something they dropped. The key takeaway is that looking at one individual sprint’s velocity is often too small a picture.

A team’s velocity will vary from sprint to sprint because the issues they’re working on vary. The team’s completion rate for an individual sprint isn’t necessarily a good barometer for how long they’ll take to complete a project.
It’s the same as with a car: knowing how fast the car is going in any five-minute period isn’t a good way to figure out how long it’ll take you to drive cross-country. Instead, you want to find the average number of miles traveled per day or week to figure out how far away your goal is.
The variance in velocity from sprint to sprint means that it’s always better to examine sprint velocity across multiple sprints (which is easy to do with a velocity chart) so that you’re thinking in averages, not fixating on individual data points.
Another reason that relying only upon sprint velocity and a tool like the burndown chart is dangerous is that these only tell you how quickly your team went, but they don’t tell you whether your team was going in the right direction.
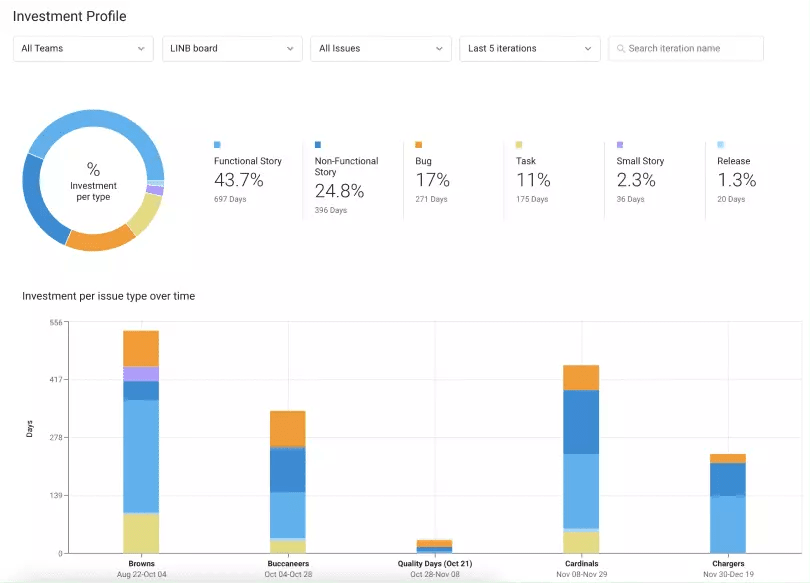
With LinearB, you can not only see how much work your team completed during particular sprints, but you can see what kind of work they did. Our Investment Profile breaks down work by type so that you can see how much planned versus unplanned work they did or functional versus non-functional stories they completed.
Increasing Velocity Is Difficult and Counterintuitive
Every single agile team I’ve ever worked on has had a conversation about increasing velocity at some point. As a developer, this isn’t surprising. We understand that when managers see a metric, their first impulse is to try to optimize it.
The natural impulse for the business as a whole is to want more features more quickly, with fewer bugs. So, the manager, responding to the pressures of the business, tells the team that they need to work faster.
In my experience, this is usually a self-defeating goal, because the team switches focus from delivering software to figuring out why they aren’t delivering more software. Instead of writing and reviewing code, the team sits in meetings discussing why they’re not getting more work done.

Counterintuitively, the best way to increase sprint velocity is often to spend less time thinking about it. Instead, spend more time focusing on writing quality software and ensuring the team encounters the fewest roadblocks possible.
To return to our cross-country road trip analogy: spending time talking about how far you need to go isn’t productive while you’re stuck in traffic. Often, it’s going to do nothing but create stress, which leads to wrong turns, slowing the trip down even more.
Sprint Velocity Is Arbitrary
Most teams can tell you their velocity pretty quickly. For instance, the team I currently work on averages about 44 story points per sprint. That’s a stable velocity: we tend to be within three or four points of that number on either side every sprint, going back eight months.
Having an accurate sense of our sprint velocity great improves the sprint planning process. We can more confidently move items from our product backlog to construct our sprint backlog because we have few doubts that we will be able to finish what we commit to.
Do you know what it would take to double our sprint velocity? We could do it overnight. All we’d have to do is double our pointing estimate for every story we take on. Instead of completing 44 points per sprint, we’d finish 88.
A team may be able to fool an executive this way but in reality the amount of work a team is completing isn’t changing – and soon enough that’ll be apparent.
Just like if we started measuring our road trip in kilometers per hour instead of miles per hour so that it’d look like we were going faster initially, sprint velocity isn’t an absolute truth. Many teams, when pressed to increase velocity, will simply start padding estimates.
They start meeting their sprint commitments more consistently and they see a bigger number on a dashboard, but they don’t ship any more software. This is why sprint velocity is a dangerous metric for a scrum team.

It’s a good idea to complement velocity with other measures of work completed. I recommend that the Scrum coordinator (formerly known as the Scrum master) or product owner goes over completed user stories during your sprint reviews. This helps the development team understand the user value of what they shipped, which is ultimately the most important thing.
Don’t Abuse the Velocity Metric
Sprint velocity is a useful metric. It gives context to the work done between individual sprints by a single team.
But it’s important to remember not to abuse that metric. Don’t use it for things it isn’t made to measure, and don’t trust it as an absolute truth.
Ben Matthews, Director of Engineering at Stack Overflow, learned through experience how pursuing higher velocity at the expense of everything else ended up being counterproductive.
Remember that your goal isn’t to juice a metric. Your goal is to ship the best software you can, as consistently as you can. That’s why it’s helpful to leverage other metrics, like software development cycle time, to ensure that you’re actually improving.
LinearB makes it easy to use a suite of metrics to comprehensively and thoroughly measure your team’s productivity.

Conclusion
Sprint velocity is a useful metric because it makes it easy to understand a key dimension of a development team: How much work are they getting done?
But its succinctness also means that it doesn’t give you a full picture. It’s like trying to evaluate a person’s health by their temperature alone. A high temperature doesn’t tell you why someone is ill; you need more data.
LinearB was built to provide the information that engineering leaders need to better manage their teams, deliver on their promises, and ship more features faster. To learn about how LinearB can help you to raise your team’s sprint velocity, and in prove in so many more ways, reach out to set up a demo today.