Three amazing things happen when you get your company’s engineering metrics:
- You’ll have tangible, concrete figures (instead of gut feeling) to reference when talking to other departments about your teams’ performance.
- You can figure out where to make simple improvements that deliver immediate ROI.
- You can make strategic decisions about how to leverage your company’s most valuable – and scarce – resource: dev bandwidth.
Once you realize the benefits of understanding your engineering metrics, getting them should be easy, right? They’re just numbers, right? Not necessarily.
There are a host of options when it comes to getting visibility into your engineering metrics. Each metrics platform reflects the ethos and values of its creators.
In the case of LinearB, it was created by two former heads of engineering – not business managers as is often the case.
LinearB’s engineer’s take on what an engineering metrics platform should provide isn’t lost on the company’s customers. In fact, they’re embedded in the most common reasons customers say they chose LinearB for engineering metrics…
1. You get your engineering metrics right away
“With LinearB, you simply plug in tools like GitHub & Jira, and within a matter of minutes, you get insights into your engineering process. You get to take action on that data and help to course-correct potential issues.“
Daniel Maharshalian, CEO & cofounder of Drata
The last thing you need when trying to understand your team’s workflow is a tool that takes weeks or months to get up and running with your operations. You also don’t need a tool that requires lots of care, feeding, and maintenance. And you really don’t need a tool that requires changing how you use your existing stack.
LinearB is extremely flexible and integrates with your team’s developer setup in minutes and plays nice with engineering staples: from Jira to GitHub to GitLab and more. It correlates data from these sources and provides you with insight that’s easy to understand.
But visibility alone doesn’t improve teams. LinearB also integrates into your company’s communication channels – Slack or MS Teams – in the form of an automated bot that uses those metrics to streamline workflows, keep teams aligned to their goals, and help devs prioritize their day. The combination of instantly delivering the metrics that matter, seamlessly integrating into your existing tools, and helping you take action is one of the main reasons why LinearB delivers ROI on Day 1.
2. LinearB is built on DORA metrics and grows from there
“What I love more than anything is that LinearB is opinionated with the kind of DORA-oriented framework and metrics [it provides]. I think it’s becoming the industry standard approach to understanding the health of your teams, deployment cycles and release times.”
Chris Bee, CTO of Lessen
With software development still being a relatively young field, there isn’t a universally defined or agreed-upon set of metrics to measure (and focus improvement efforts on) that ensure success. When it comes to visibility software, your options tend to vary based on the backgrounds of its creators.
In the case of LinearB, its creators built the tool as means of helping teams align to a general rule: Happy developers at successful companies are ones who spend their time coding and deploying features, not getting bogged down in idle time, PR ping pong, rework, and other bottlenecks.
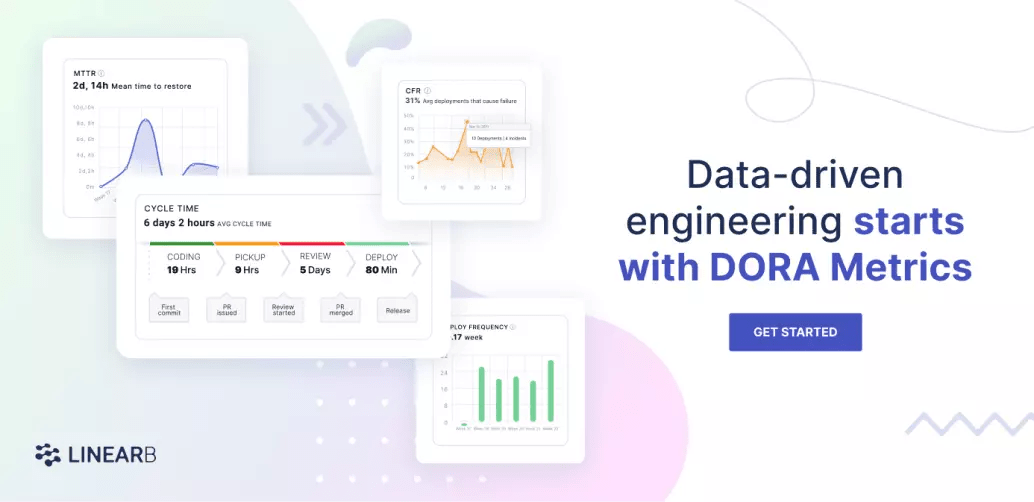
This belief means LinearB is built upon the four DORA metrics: 1) deployment frequency; 2) mean lead time for changes; 3) mean time to recovery (MTTR); and 4) change failure rate. Why? The 4 DORA metrics are the closest the software industry has come to accurately quantifying developer productivity – and by extension, happiness.
In addition to those 4 metrics, LinearB also offers insights that we and our customers believe are central to understanding dev-pipeline health. These include things like pull request size, rework rate, planning accuracy, review time and more.
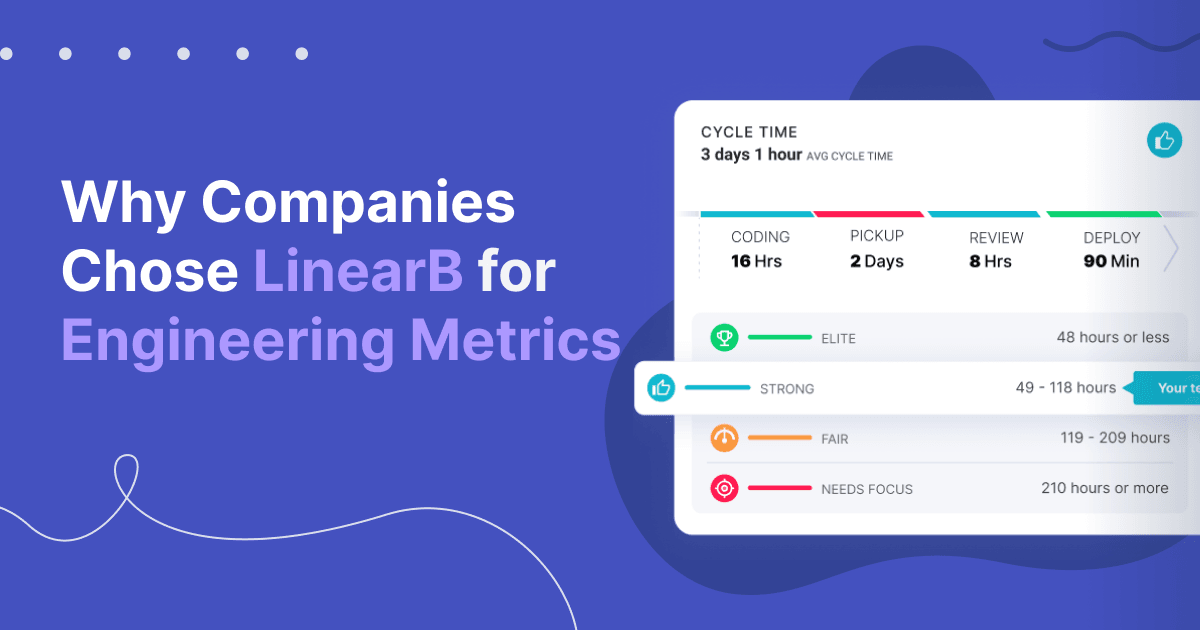
3. LinearB specializes in improving cycle time metrics
“I’m very interested in cycle time as a whole across the team. How long take us to go from idea to specification to implementation to release to a customer. LinearB is very helpful. The individual managers find a ton of value.”
Zach Goldberg, CTO of Dama Financial
As mentioned above, LinearB was built to help teams create healthier development pipelines and improve the developer experience as a whole. How does a team do this? Shorten cycle time.
That’s why LinearB provides a special emphasis on helping teams understand their cycle time and align their improvement efforts around this core metric.
It all goes back to the mantra of how to build a happy, healthy dev team: get them back to what they love doing – building and shipping features. Shorter cycle times mean more work is moving through the pipeline and more features are getting into the hands of customers.
LinearB’s cycle time dashboard is broken down into:
- Coding Time: We calculate coding time from first commit to when a pull request or merge request is created.
- Pickup Time: We calculate pickup time from when the PR is created to when the review begins.
- Review Time: We calculate review time from the start of the review to when the code is merged.
- Deploy Time: We calculate deploy time from when the code is merged to when it is released.
Not only has this view helped teams do things like double their deployment frequency, but they’ve also been able to identify and tackle bottlenecks (and their root causes) in real-time.
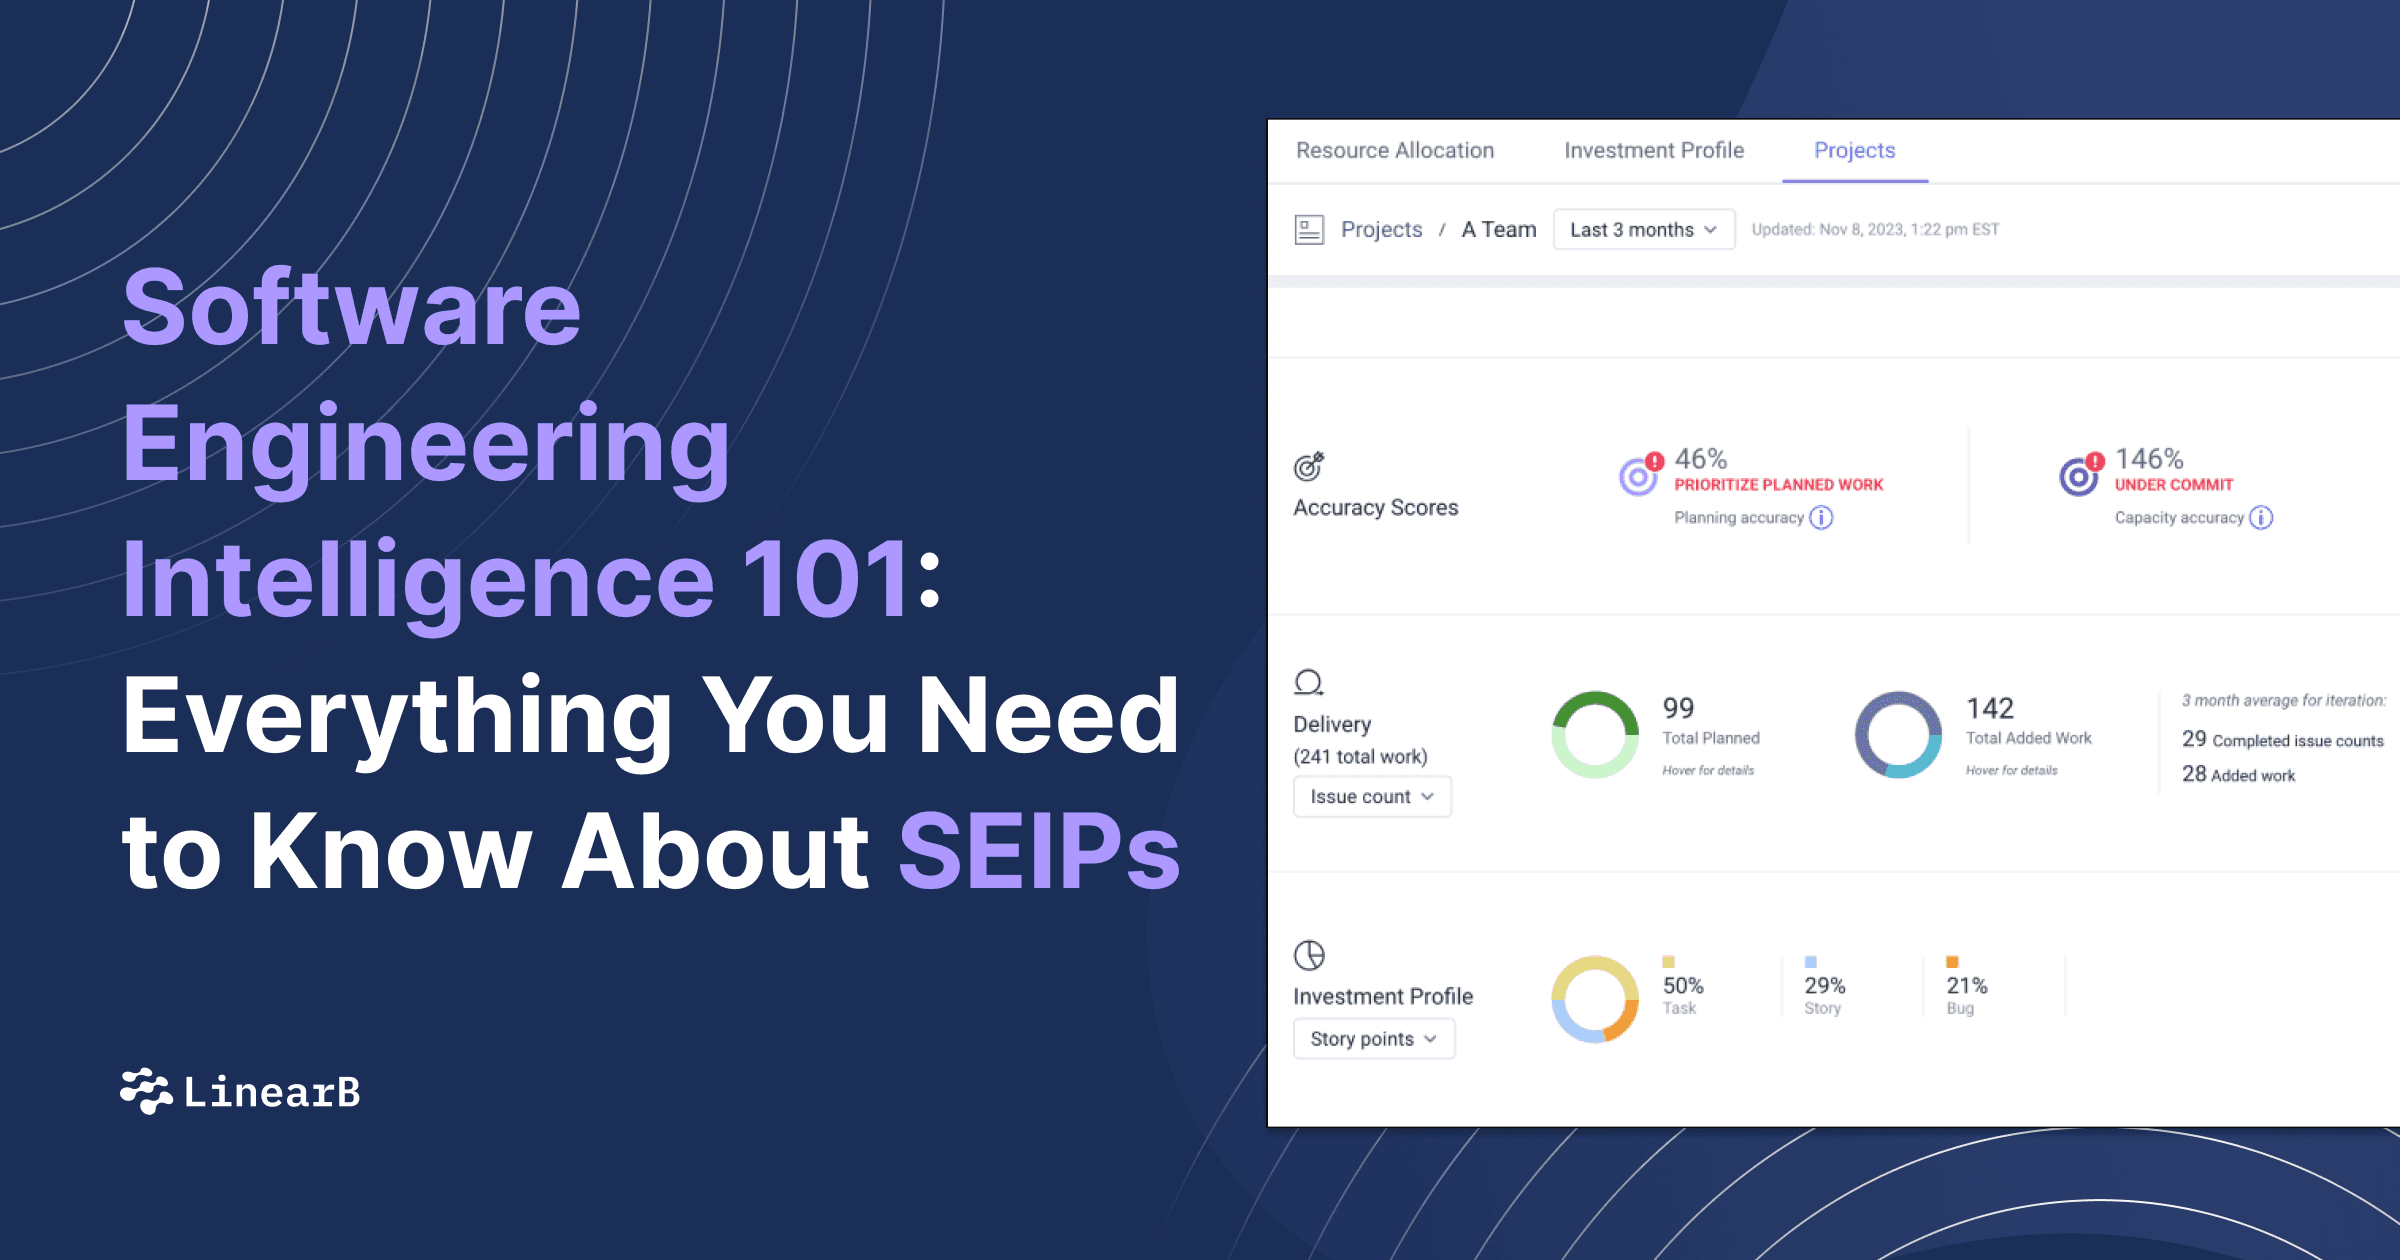
4. There are metrics for every level of the organization
“Our teams look at projects & tickets for a weekly backlog. They look at how many story points per sprint because they like to know how much capacity they have.
As a director, I use these metrics for overall productivity, if I’m not thinking about managing individual projects and when they’re going to be done.”
Mike Gordon, VP of Engineering at Hippo Insurance
As two engineers who made the journey from junior devs to team leads to CTOs, LinearB’s founders built our platform knowing that amazing pipelines happen by empowering smart decisions at every level of a dev org.
What this looks like in practice with LinearB is that developers are given tools to automate, streamline and simplify their work so they get to focus on coding.
For team leaders and managers, they are provided real-time data and insights into how their projects and pipelines are functioning.
Last, CTOs and heads of engineering are one click away from knowing what projects are being worked on and when they’ll be done, so they can relay that crucial information to the rest of the business.
5. LinearB metrics focus on teams, not stack ranking individual developers
“Most engineering teams are self-correcting. If you show them how they’re measured and you work with them in a psychologically safe way, they want to do a good job and deliver something of value.”
Jonathan Sowler, VP of Engineering at Unbabel
Want to eliminate the trust, cohesion and productivity of your engineering organization? Implement a metrics dashboard that measures developers on an individual level rather than as a team! It’s the quickest way to tell your engineers that you want to spy on them rather than empower them to do what you want them to do: code and deploy amazing features!
6. You can make real-time engineering decisions
“We have cycle time metrics that LinearB provides – broken down into coding time, time to pick it up, review and then deploy. It’s been super helpful to see different bottlenecks on different teams… and figuring out how to kind of deploy resources as needed.”
Jennie MacDougal, Director of Engineering Engineering at Reprise
The best time to try and fix a pipeline issue? When it’s actually creating a real-time bottleneck in your dev workflow. With LinearB, team leads are able to course correct in real-time because they know where problems in their cycle time are originating from and where to dedicate resources to fix.
After the project is over, retros also become elevated. Managers are able to review with precise data what hurdles to expect in the future and how to handle them when they do arise.
Get engineering metrics that engineers actually love…
One last thing customers love about LinearB? They see actual productivity and deployment frequency improvements in under 4 months. To see why your engineering org should choose the metrics and improvement platform made for & designed by engineers, just let us know about the team you want to empower here 👇