
Your enterprise Jira software contains a lot of information about you, your team, and your projects. Sometimes this information is hard to find, even though Jira offers a large number of configuration options.
As a matter of fact, you could say Jira has too many options to be useful. But there is one step you can take to uncover the signal from the noise: create a Jira dashboard.
In this post, we’ll cover what a Jira dashboard is. Then, we’ll discuss how to set up a system default dashboard and how to create a dashboard in Jira. Then, we’ll show how to add gadgets to a dashboard and customize the dashboard layout. You can follow along with the article like a tutorial if you wish. The screenshots and instructions use the latest version of Jira’s cloud service.
What Is a Jira Dashboard?
A Jira dashboard is a collection of “gadgets” and reports that give you a streamlined view of what’s going on in projects. You can use the default dashboard, which your Jira administrator sets up, or you can create your own.
There are gadgets for displaying the results of JQL queries, project statistics, your personal Jira filters, and several different types of graphs. So, by creating a custom dashboard, you can manage what Jira shows you when you visit the site.
Here is a personalized dashboard that displays several personalized queries, some statistics, and a list of filters for easy access.
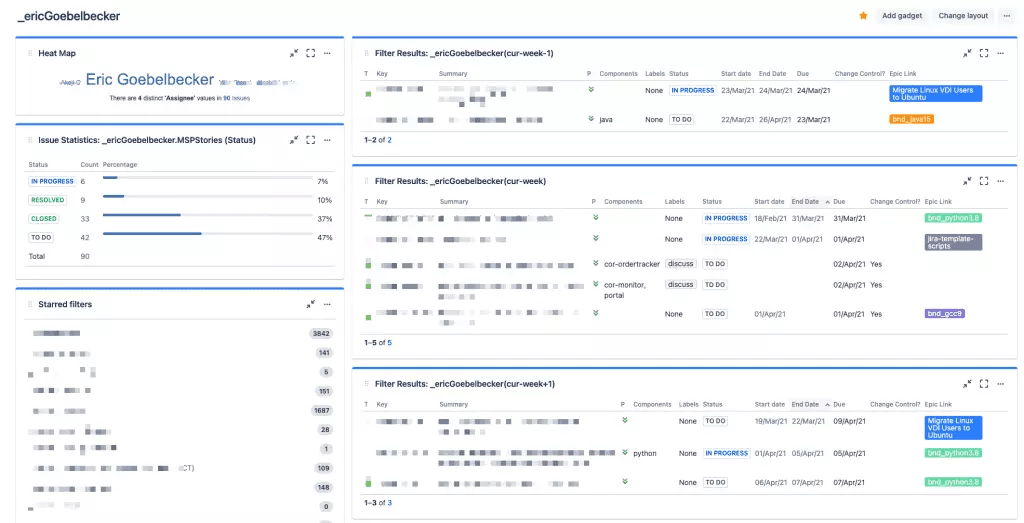
There are six gadgets visible on this screen. They present summaries of projects and issues via dynamic updating queries. You can customize your dashboard with many different gadgets and lay them out on the page to suit your taste.
Default Jira Dashboard
The default (or system) dashboard is what you see when you log in to Jira for the first time. You can create a new dashboard for yourself or change the system settings to take you to the projects’ directory or work.
We’ll cover how to select a custom home page or custom Jira dashboard below.
If you’re a Jira administrator, you can customize the system dashboard.
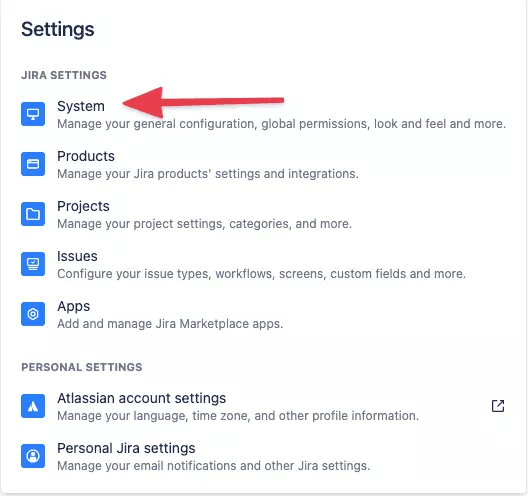
First, go to the Jira System settings menu.
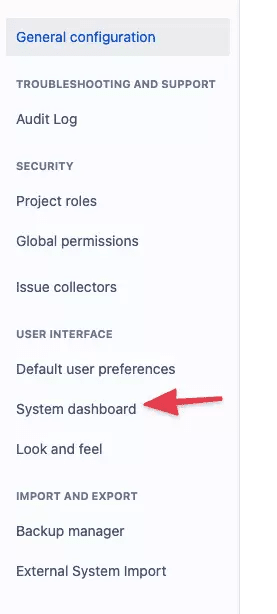
Then, select System dashboard in the general configuration menu.
This will take you to a dashboard customization screen.
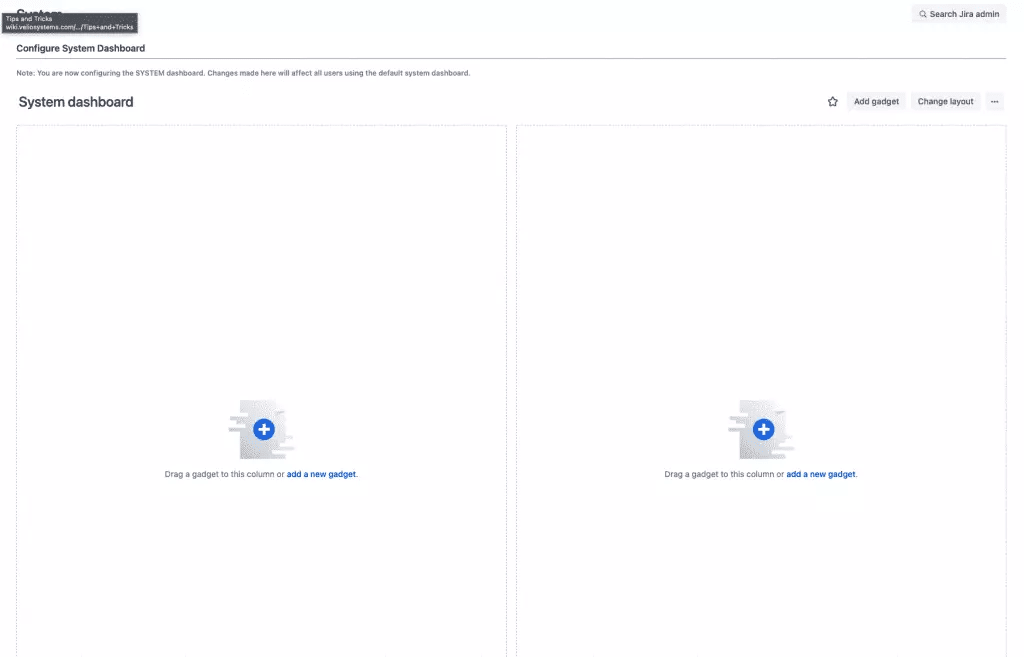
This is for an empty system dashboard. We’ll cover how to use it to create a custom dashboard.
How to Create a Dashboard in Jira
Sometimes the default dashboard doesn’t suit your individual needs, or you may want to use more than one dashboard. For example, if you’re responsible for multiple projects, you may want to create a dashboard for each.
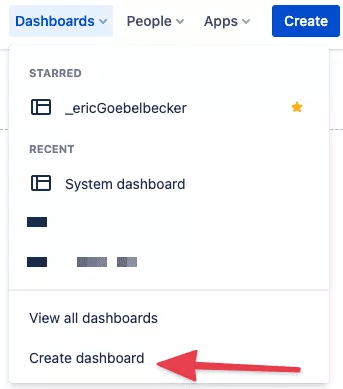
If you want to create your own dashboard, click on the dashboard menu and select Create dashboard.
Next, fill out the Create dashboard dialog box.
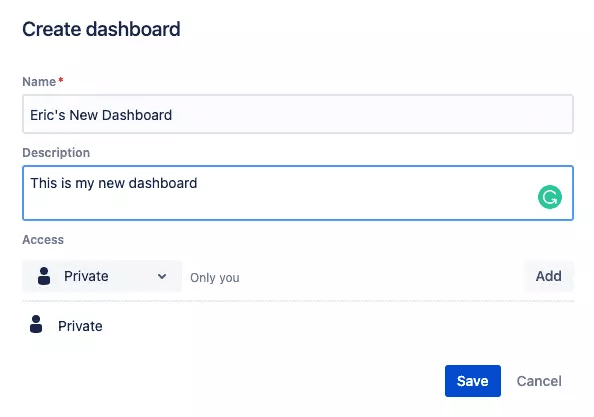
You can share dashboards. So, if you think that one of your team members might find it useful, use a clear name and add a description. That will make it easier to identify in the list of available dashboards.
You can also specify whether it’s private to you or shared with other users.
Finally, click Save, and Jira will take you to the Create dashboard screen similar to the one shown above.
Now, let’s go over how to configure a dashboard with gadgets that will help you find your way around Jira.
Create a Custom Dashboard in Jira
A Jira dashboard is a collection of gadgets. You customize a blank dashboard by adding gadgets and configuring them to display the information you want to see. After you’ve added the gadgets you want, you can place them into different layouts to suit your needs too.

A typical Jira instance has more than 40 gadgets. Atlassian supplies a large selection, as does the Jira marketplace. As we review how to customize a dashboard, we’ll group them into a few broad categories.
Adding a Gadget to a Jira Dashboard
Let’s start with how to add a gadget to a dashboard.
When you’re in the Jira dashboard edit screen, the Add gadget option is on the top right.
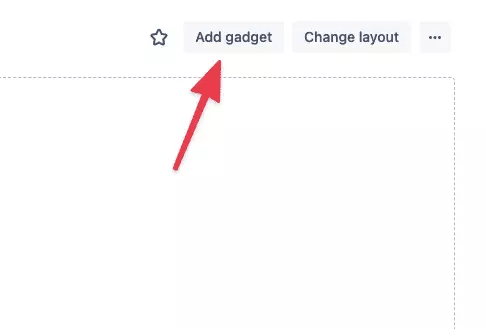
Click that button, and you’ll see the Add a gadget dialog.
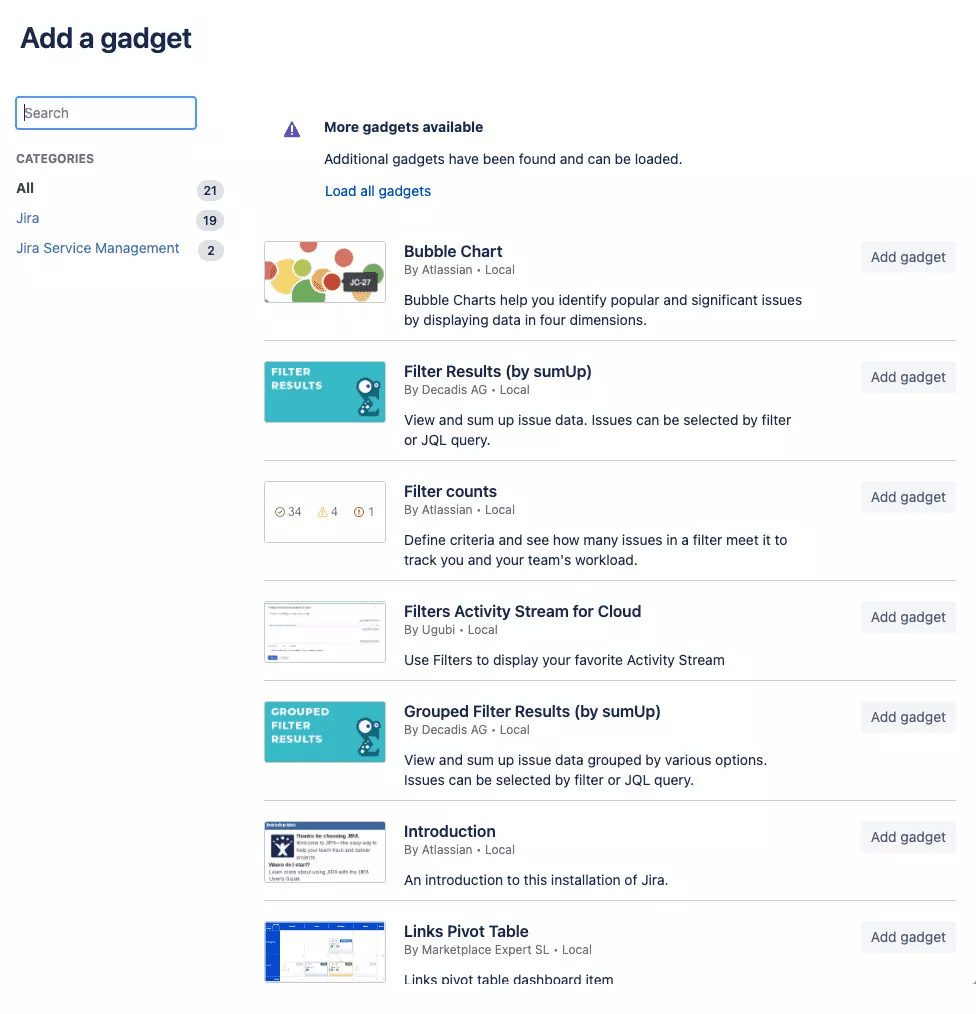
You can search for a gadget by name, use the tags on the right to filter the list of gadgets, or click load all gadgets and scroll through the list.
For this example, we’ll add the Introduction gadget. So, click the Add gadget button next to that gadget.

When you click the button, Jira adds the gadget to your dashboard.
That’s all it takes to add a gadget! Let’s take a look at a couple of layout options before we move on to some of the different gadget types.
Jira Dashboard Gadget Controls
Gadgets have standard controls for expanding, minimizing, and configuring them. They are located in the upper left-hand corner.
The first control minimizes the gadget. This is useful when you want to emphasize another gadget on the page. The second maximizes it, which can be useful for a gadget that displays long query results or graphs. The last is for changing colors or completely deleting the gadget.
Query Gadgets
A query gadget displays the result of Jira queries on your Jira dashboard. Atlassian offers a large collection of query gadgets.
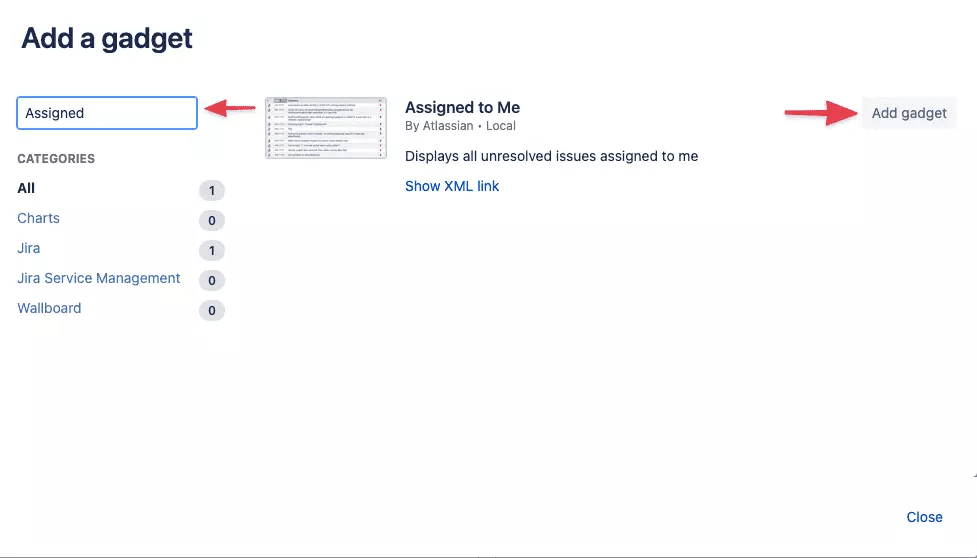
Let’s look at a simple query gadget: Assigned to Me. This gadget displays Jira items assigned to you.
The easiest way to find a gadget is by searching by name. So, bring up the Add a gadget dialog and type “Assigned” in the search box. Then, add the gadget to your dashboard and close the dialog.
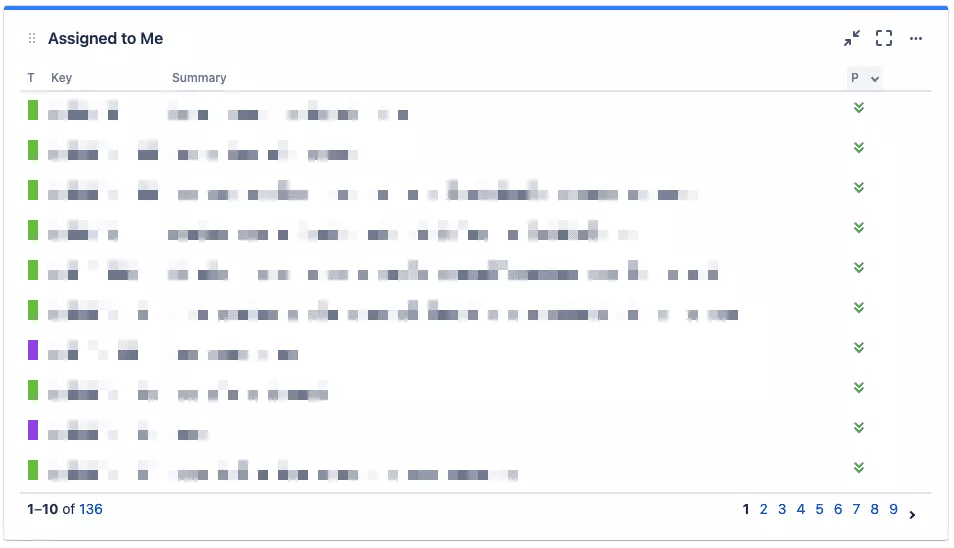
The gadget starts with some query options. You can add or remove the display columns and set the number of items to show per page. You can also have it automatically updated without refreshing the page.

Accept the defaults, and you’ll see the items assigned to you. You can change the sort order and page through the items from the gadget.
Assigned to Me is one of the simplest query gadgets. You can add more complicated gadgets, including ones that will allow you to enter your own custom queries.
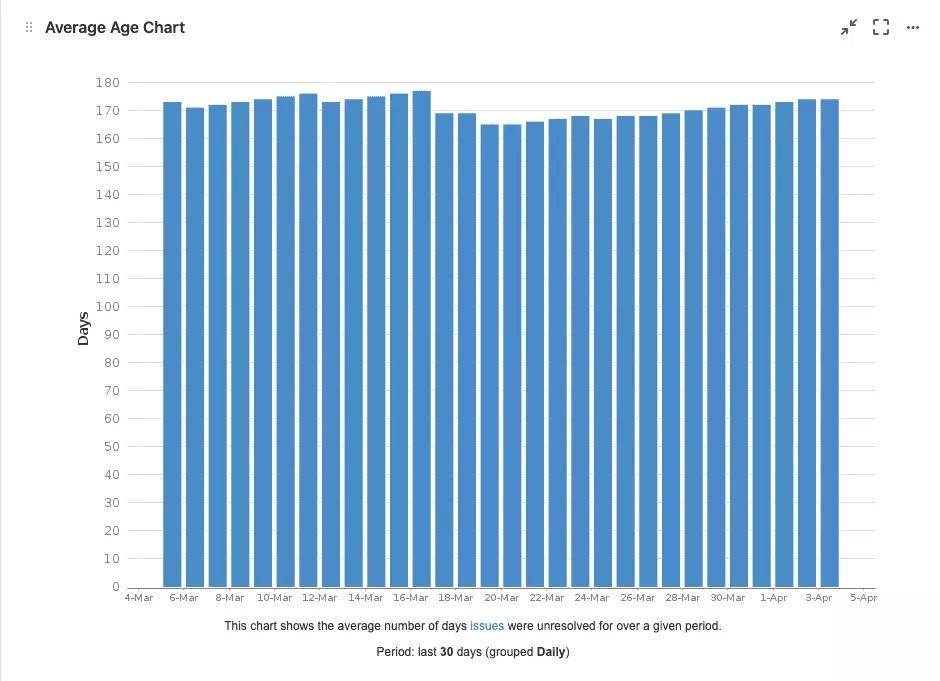
Chart Gadgets
You can add charts to your dashboard, too. Let’s wrap up with another default gadget from Atlassian. The average age gadget displays a chart of your Jira issues by their age.
Search for “Average” in the Add a gadget dialog. You can see that Atlassian offers several charts related to average issue age.
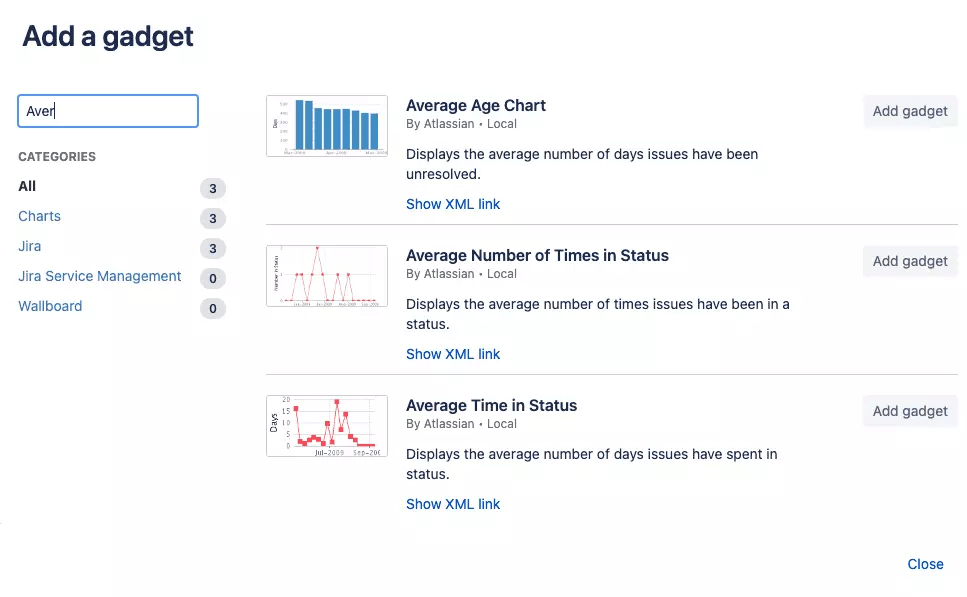
Add the Average Age Chart.
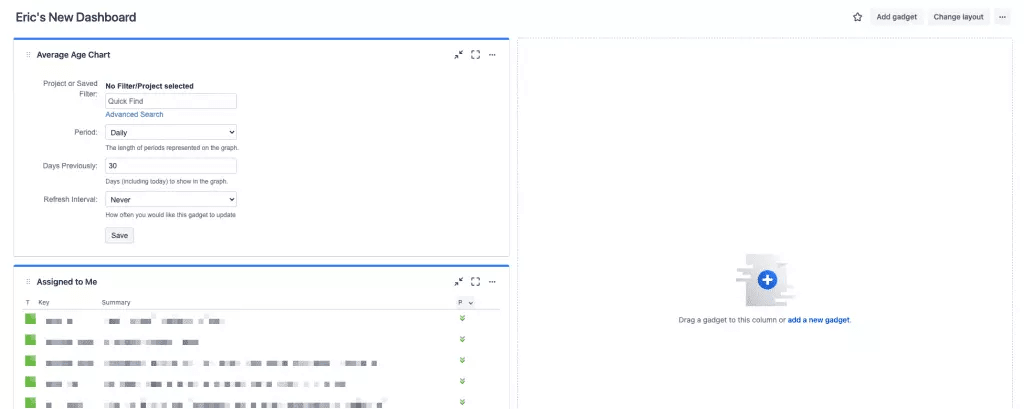
Similar to the previous gadget, this one has some search options that you can change. But before we go over them, let’s move this gadget over to the other column. Put your mouse over the gadget, and it will change into a hand. Click to grab the gadget and then move it over.
With the chart in place, you can configure it.
This gadget requires a Jira filter. After you have identified one, enter part of the name in the search dialog, and Jira will display the matching filters to you with autocomplete.
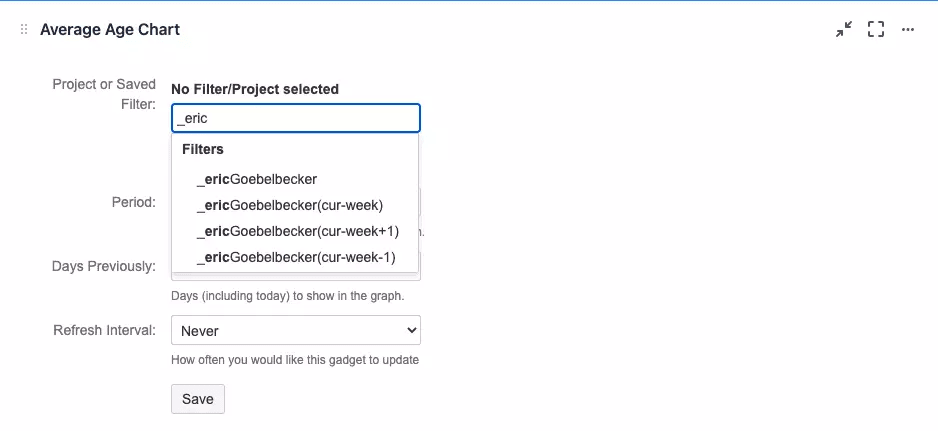
Click Save, and you’ll have a chart on your Jira dashboard.
There’s a Better Way
Building a dashboard helps you tame the overwhelming feeling you get when you log in to Jira in the morning. But it doesn’t make Jira a good tool for software development.
Jira is a project planning application. It’s well-suited for mapping out the critical steps required to complete a project. It has the tools you need to set up stories and tasks and assign them to their proper epics.
But then the project kicks off, and planning tools become less valuable. Stories and task status don’t tell you much about what’s really happening, i.e. project management. In order to understand what’s really happening, you want to know about pull requests, branches, and commits. At the same time, business leaders want to know more than whether or not a story is “in progress.” So, the meetings and synchronous status updates start.
How do you fix this? Use project planning tools for planning. Use development tools for managing development projects. Project planning tools aren’t a good fit for fluid development projects that often follow a non-linear path.

Development projects need tools that place the focus on coding and delivery. Developers spend most of their time in tools like Git and Slack, and a system that integrates is a better fit. That’s what LinearB has to offer.