What is Software Engineering Intelligence:
As technology has eaten the world, the role of Software Engineering Intelligence (SEI) has become increasingly vital in providing R&D leaders with holistic visibility into the Software Development Life Cycle (SDLC). Software Engineering Intelligence Platforms (SEIPs) have become comprehensive tools that not only provide visibility into a company’s SDLCs, but boost efficiency and enforce quality in software development. These platforms empower engineering leaders with data-driven insights into engineering team health, resource investment, operational efficiency, and progress toward key goals, enhancing decision-making and fostering collaboration.
This guide explores the critical features of SEIPs and how they revolutionize operational efficiency and business impact.
The Key Features Software Engineering Intelligence Platforms Should Have
1. Activity Metrics in SEIPs:
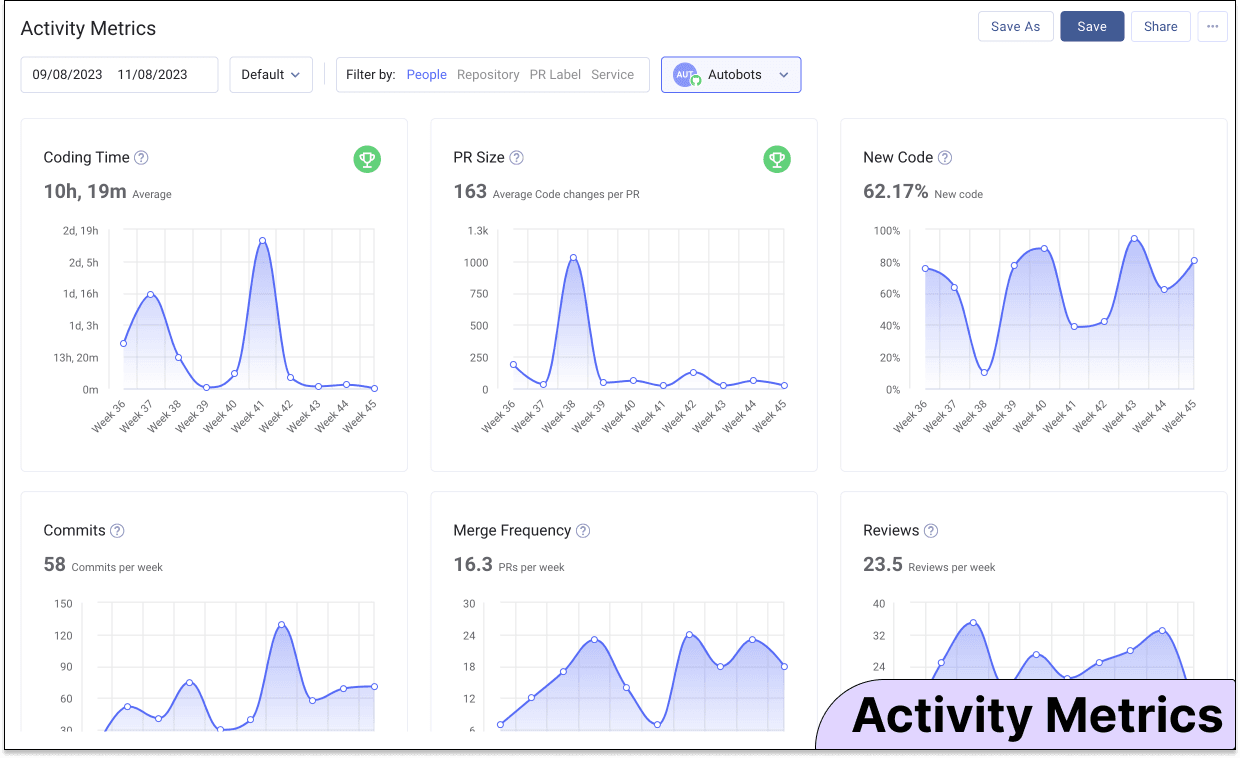
Software Engineering Intelligence Platforms offer activity metrics like coding time and merge frequency, which are pivotal indicators of team health and value delivery efficiency. Ideally tracked at the team level, these metrics serve as leading indicators of a healthy developer experience and are invaluable for identifying delivery bottlenecks.
LinearB’s Perspective
We view activity metrics as key indicators of engineering team health and predictable project delivery.
Our philosophy and platform’s default settings track these metrics at the team level and are used as leading indicators to assess pipeline health and to monitor developer experience (e.g., if it's hard to deliver pull requests, developers will be unhappy and less productive).
Activity metrics come as an out-of-the-box offering from LinearB, typically using data gathered from a user’s git provider.
We recommend to our customers that activity metrics stay at the team level to help set goals and understand trends in value delivery, ultimately leading to more predictable project delivery.
When speaking to customers about activity metrics, we strongly caution against individualizing developer activity. Stack ranking developers based on activity metrics has a high likelihood of hurting the development culture at an organization, leading to the eventual erosion of operational efficiency.

We recommend against setting individual developer goals using activity metrics as these metrics are the easiest to “game.” Instead, we guide our customers to use activity metrics as team goals, seeking consistency to improve sprint planning and capacity accuracy metrics.
Engineering managers should monitor their team’s activity metrics to ensure they can spend their time coding and reaching merge in a timely manner. We believe merging developers are happy developers, and activity metrics are an excellent place to begin identifying delivery bottlenecks.
2. Flow Metrics and Their Role in Software Engineering Intelligence:
Flow metrics are a cornerstone of Software Engineering Intelligence, and offering flexible measurement options that adapt to different working methodologies is essential. Software Engineering Intelligence Platforms enable teams to understand and improve their software delivery processes in a more structured and efficient manner.

LinearB’s Perspective
Flow metrics are a key part of a LinearB metrics program, helping teams set goals against predictable project delivery and achieve operational efficiency.
LinearB’s metrics dashboard integrates with your existing project management solutions like Jira and Azure DevOps, source code control systems like GitHub and GitLab, CI/CD platforms including Jenkins and CircleCI, and communications platforms like Slack and Microsoft Teams. By correlating data across your tech stack, we evolve flow metrics to build a holistic view of operational bottlenecks and value delivery.
To streamline project delivery from developer to customer, the LinearB platform takes flow metrics like cycle time and throughput to a deeper level by breaking them down into multiple phases.
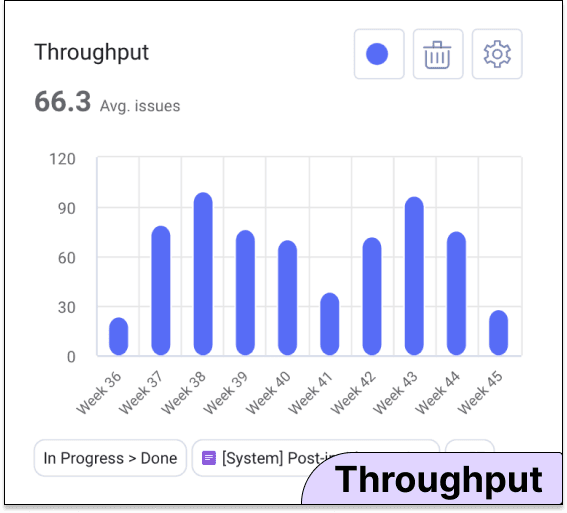
In conjunction with our data science-based in-app benchmarks, these phases help customers visually identify throughput bottlenecks before clicking deeper into the branches and PRs causing the slowdown.
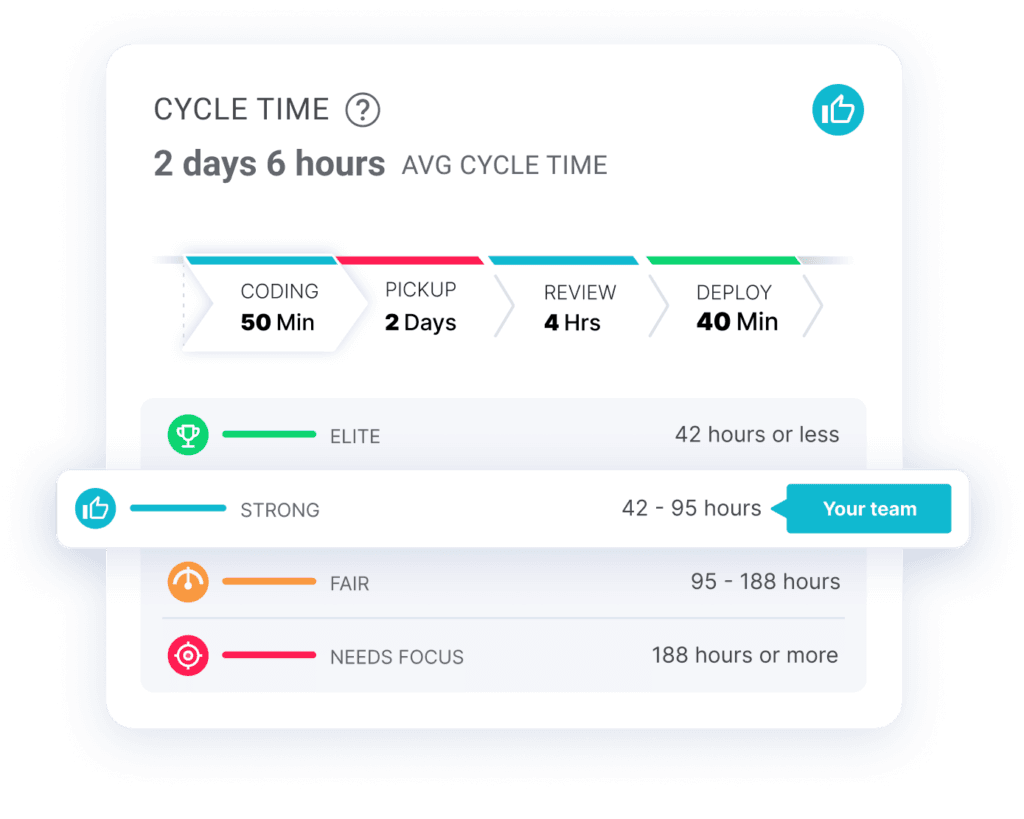
Flexibility regarding how flow metrics are measured is a key differentiating factor when measuring value delivery. Using LinearB, engineering teams do not need to change their working methods to gain value from software engineering intelligence.
To that point, we’ve invested heavily in giving our customers a wealth of options for measuring flow metrics based on their working methodology. These include customizable settings for things like release detection, task kickoff, incident reporting (excluding work), and the ability to create custom project management metrics based on any level of scope, issue type, or state.
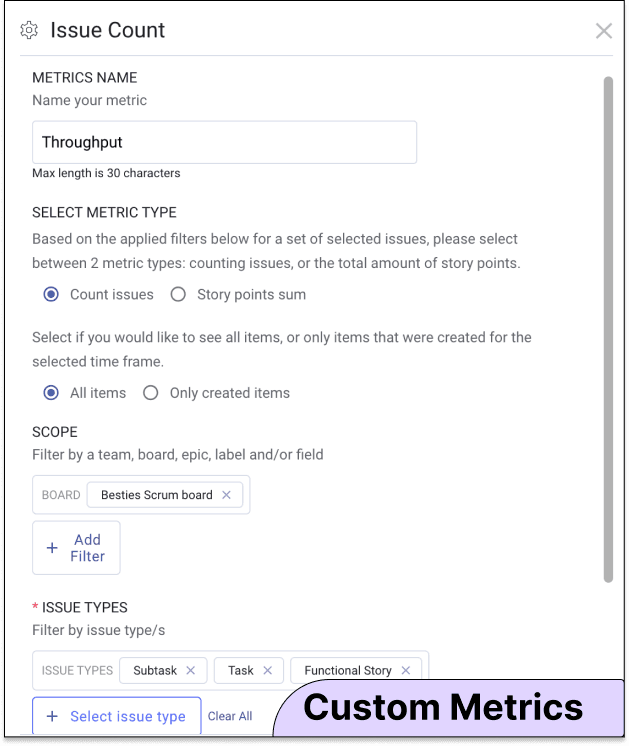
Flow metrics also play a prominent role in achieving the engineering leader’s dual mandate of operational efficiency and business alignment. Streamlining value delivery drives lower cycle time consistency and more overall efficiency. While lead time metrics help leaders forecast project delivery estimates more accurately. The result is consistent cadences and predictable software delivery.
3. Quality Metrics within Software Engineering Intelligence Platforms:
Balancing efficiency and quality is crucial for any engineering team. SEIPs should offer a comprehensive portfolio of quality metrics, including DORA metrics like Change Failure Rate (CFR) and Mean Time to Recover (MTTR). These platforms should offer configurability in tracking these metrics at both the organizational and team levels. Enterprise customers need the ability to filter their data to gain a comprehensive understanding of how performance may differ across different teams, projects, or business units.

LinearB’s Perspective
At LinearB, we align our approach to DORA research that says engineering teams must balance efficiency and quality when measuring organizational health and performance.
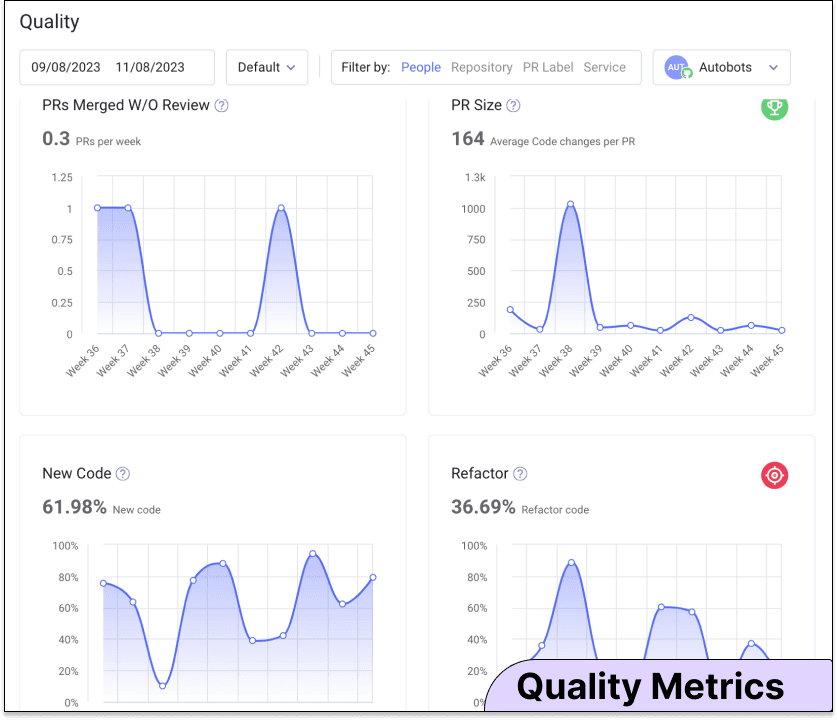
As the first Software Engineering Intelligence Platform in the world to provide all four DORA metrics free to the software development community, our quality metrics offering begins with CFR & MTTR (informed via project management tool data). It offers a robust portfolio of quality metrics, core leading indicators like PR size, and associated industry-sourced performance benchmarks to both free and paid users.
However, gaining a holistic view of quality metrics is not as simple as measuring CFR and MTTR. To complete the quality picture, the LinearB platform offers a full dashboard of proprietary quality metrics (e.g., PR Review Depth) and industry-standard quality metrics (e.g., Rework/Refactor Rates).
Quality metrics are tracked at all levels of the R&D organization, beginning with DORA at the leadership level and then tracked per team, sprint, branch, and PR.
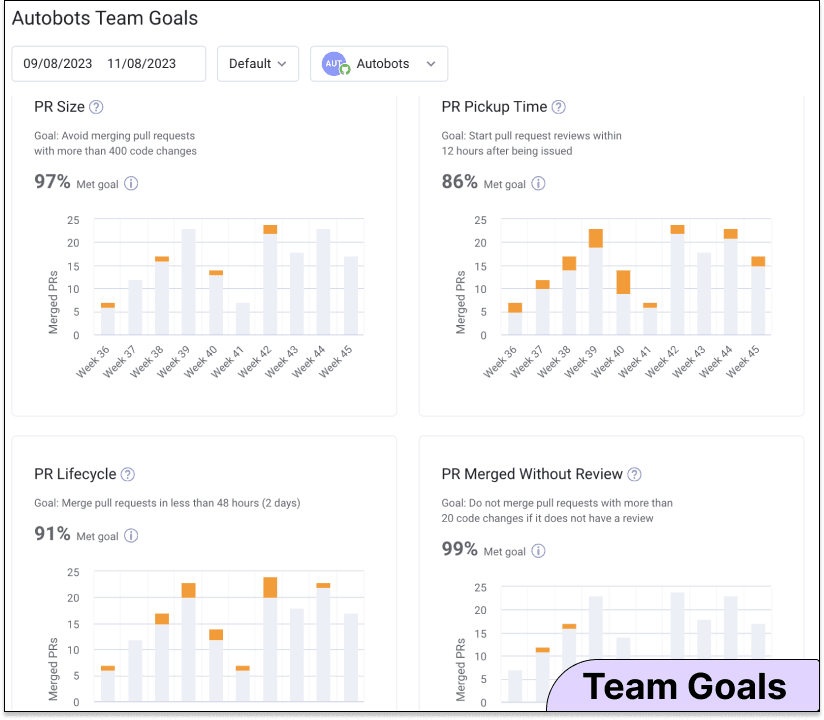
Dev teams also use LinearB to set and track goals against quality metrics. Our team goals dashboard lets teams set targets against quality metrics like PRs Merged without Review and PR Size, which comes with goal-focused Slack/MS Teams updates to help drive best practice behaviors.
Flexibility in how quality metrics are tracked is also an essential factor. We offer org-level and team-level settings that allow customers to track their team’s quality metrics without changing how they work.
Org-level settings like incident detection (via API or PM Tool) and team-level settings like team scope and methodology play a crucial role in our platform's quality metrics data integrity.
4. Business Value Metrics:
Business value metrics are an emerging aspect of Software Engineering Intelligence Platforms, and integrating metrics like product revenue growth or customer satisfaction could significantly demonstrate the business impact of R&D investments. However, no SEIPs natively integrate with customer relationship management systems (CRMs), enterprise resource planning software (ERPs), human resource information systems (HRIs), or other generalist enterprise systems.
SEIPs integrating with these systems in the future will offer another opportunity to align engineering operations with broader business objectives.
LinearB’s Perspective
LinearB does not currently integrate with customer satisfaction platforms or provide a way to measure metrics of this, as we are focused on helping engineering leaders meet their dual mandate of operational excellence and business alignment.
We are approaching the opportunity through webhooks, APIs, and gitStream, which offers a variety of paths to developers to orchestrate data and workflows across tools and systems.
5. Organizational Efficiency and Software Engineering Intelligence:
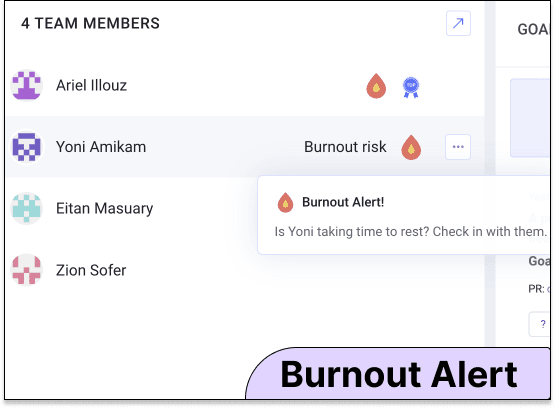
Organizational efficiency in Software Engineering Intelligence Platforms is often linked with developer experience and developer productivity. SEIPs should track quantifiable metrics like Work in Progress (WIP) and Burnout Alerts at the team level. They should also apply automation to reduce developer toil and invest in tools that enhance developer experience.
LinearB’s Perspective
We strongly believe in the correlation between a strong developer experience and team happiness/retention. To help our customers’ organizational effectiveness, we offer the ability to track quantifiable developer experience metrics at the team level (e.g., WIP & Burnout Alerts), automation tools that reduce developer toil, and our upcoming DevEx surveys via our Slack/MS Teams tool integrations.
There is strong evidence and feedback from our customer base that dev teams with faster, automated reviews, low waiting times for CI, and high merge frequencies score higher when surveyed on team happiness. In conjunction with gitStream’s popularity in the development community, published research has convinced us that teams who focus on applying a Continuous Merge mindset (applying workflows that optimize the PR merge path) improve their developer experience and productivity hand-in-hand.
The quantifiable outcome or ROI of teams using gitStream is tied to dev hours saved; currently driving an average 61% reduction in cycle time in every repo where it is applied.
6. Benchmarking and Comparisons in SEIPs:
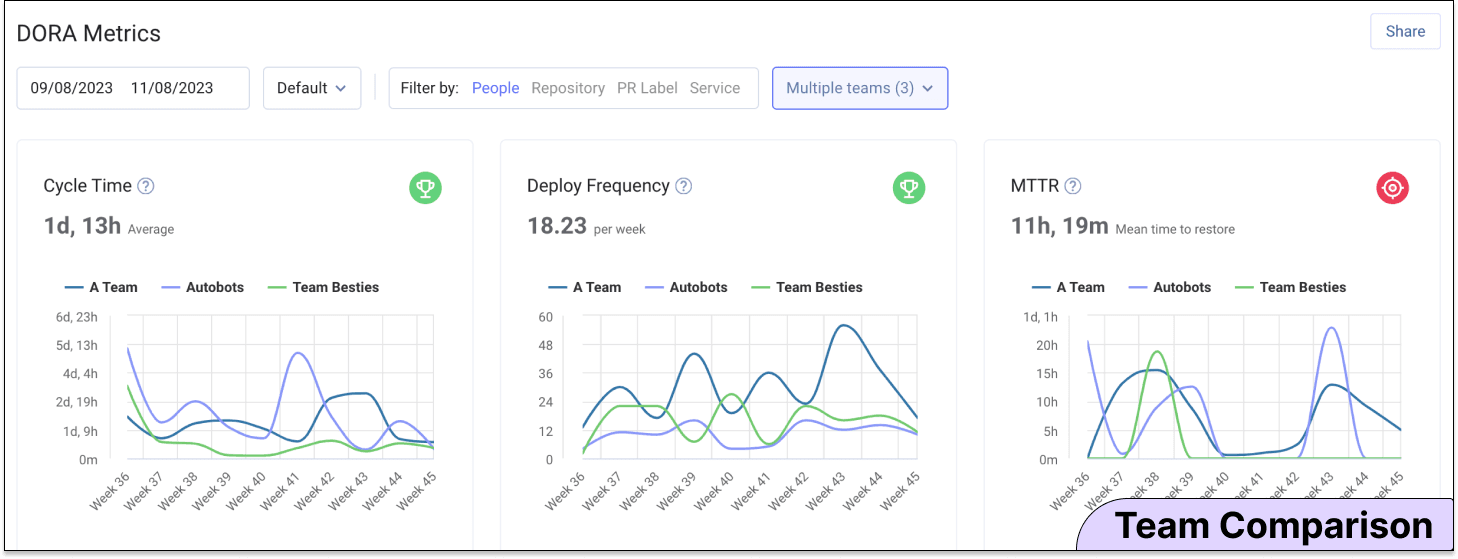
Software Engineering Intelligence Platforms should provide benchmarking data to help engineering leaders better understand their metrics, define “good,” and set data-backed performance goals. Investing in data science to produce comprehensive benchmark reports, leveraging those insights on metrics, and offering in-app visuals for setting and understanding goals is crucial. These platforms should enable multi-team comparison across various metrics, offering a tailored approach to performance improvement.
LinearB’s Perspective
Understanding what a team’s engineering metrics mean is a pillar of the LinearB metrics program.
We have invested heavily into the data science of our proprietary data to produce an annual Engineering Metrics Benchmarks Report to provide the community and our customers with a quantitative gauge of the health and performance of their organizations.
LinearB benchmark data is operationalized for our users with in-app visuals that help engineering leaders set goals and understand where their efforts will make the most significant impact.
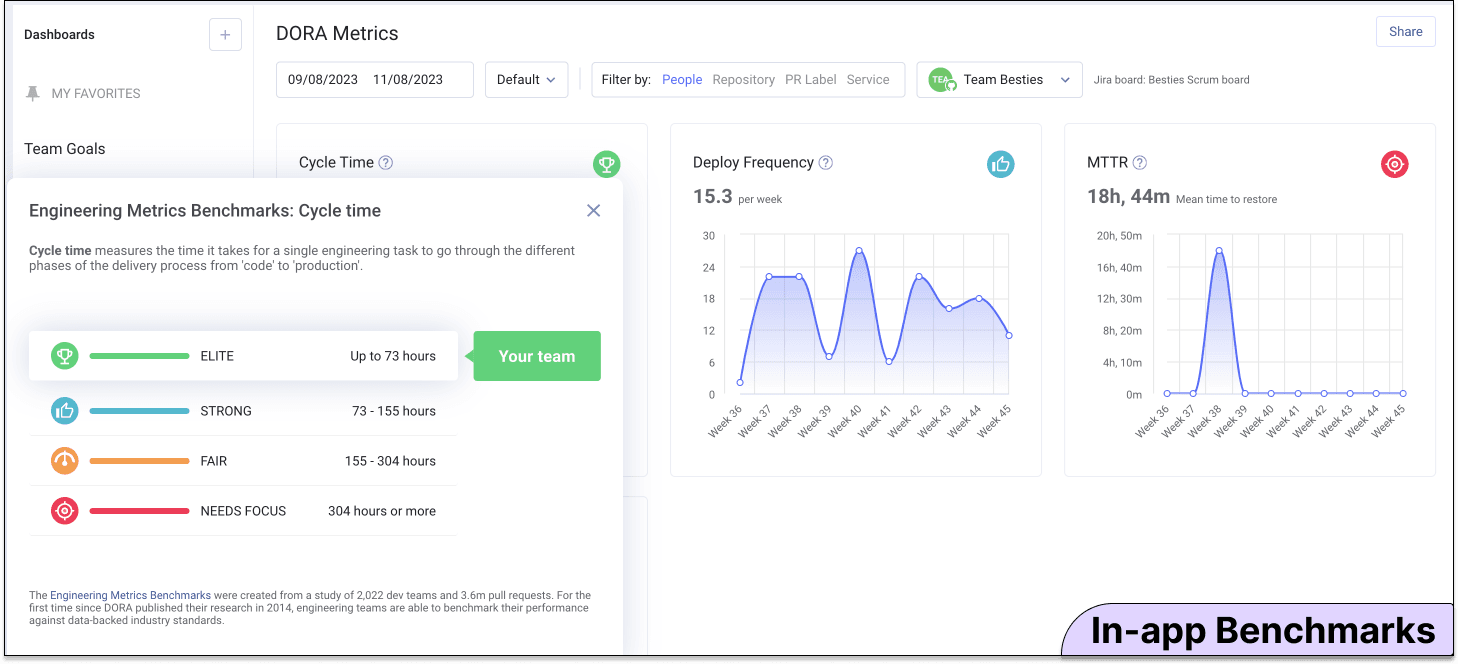
It is also crucial for engineering leaders to compare and identify team performance trends across time per metric. Our flexible metrics dashboard allows multi-team comparison across any time period or team level. This comparison feature helps leaders to customize their feedback on improvement opportunities on a per-team basis.
Outside of the proprietary data operationalized with our platform, we also provide our community with external research.
LinearB partnered with the DORA team at Google this year to survey over 3,000 engineering professionals worldwide for the 2023 Accelerate State of DevOps Report. This qualitative research provides a unique perspective on performance predictors and trending topics.
7. Capacity Planning and Forecasting in SEIPs:
Software Engineering Intelligence Platforms should offer dashboards for resource allocation, investment profiles, and project delivery tracking, providing visibility into project health and delivery risks. This visibility is essential for aligning team efforts with business objectives and stakeholder promises.
LinearB’s Perspective
As engineering leaders mature beyond only leveraging operational metrics, they begin to look at the business as a whole and how they can align their resources to business goals.
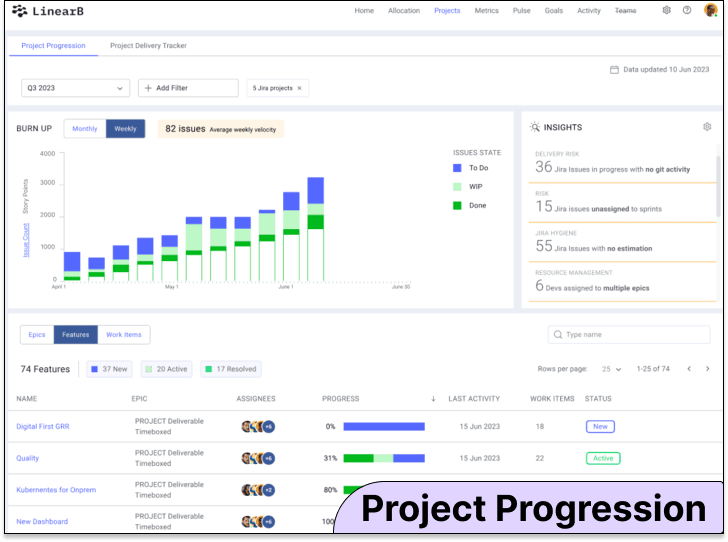
LinearB’s resource allocation and project delivery tracker dashboards give engineering leaders visibility into the projects their teams are working on and project health and delivery risks. This level of visibility helps engineering leaders achieve business goals and deliver on promises to stakeholders.
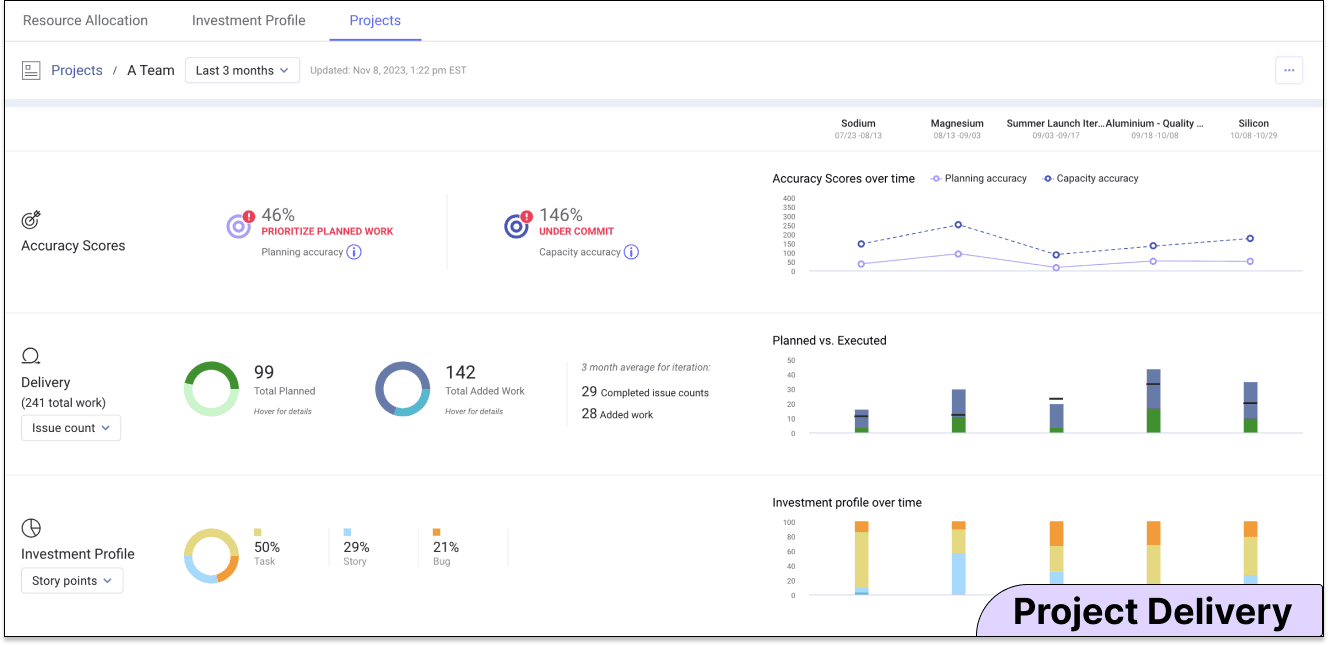
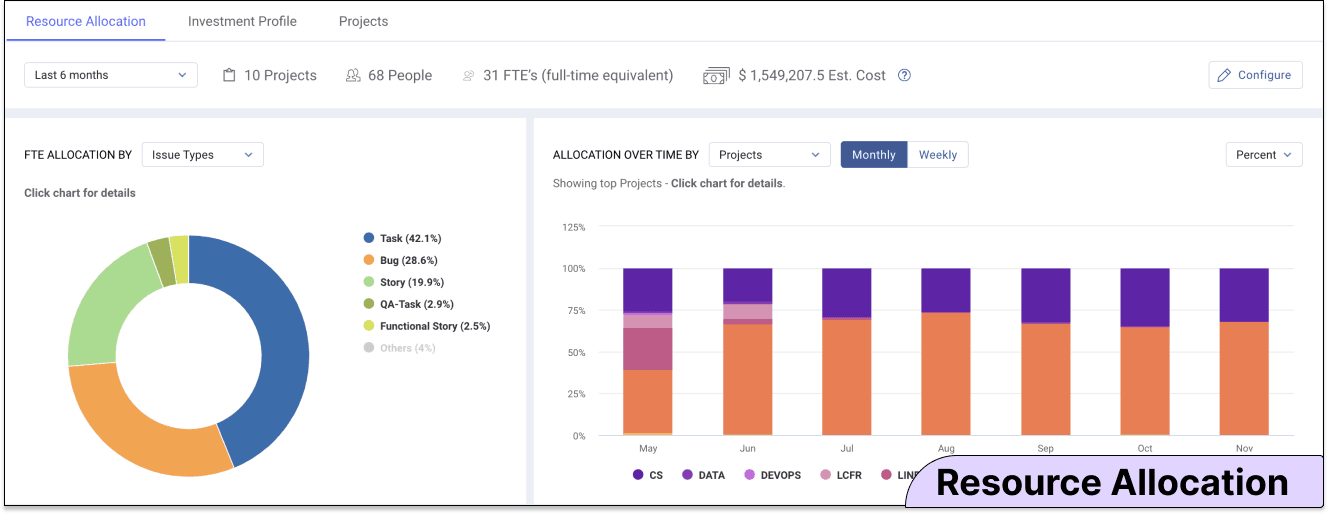
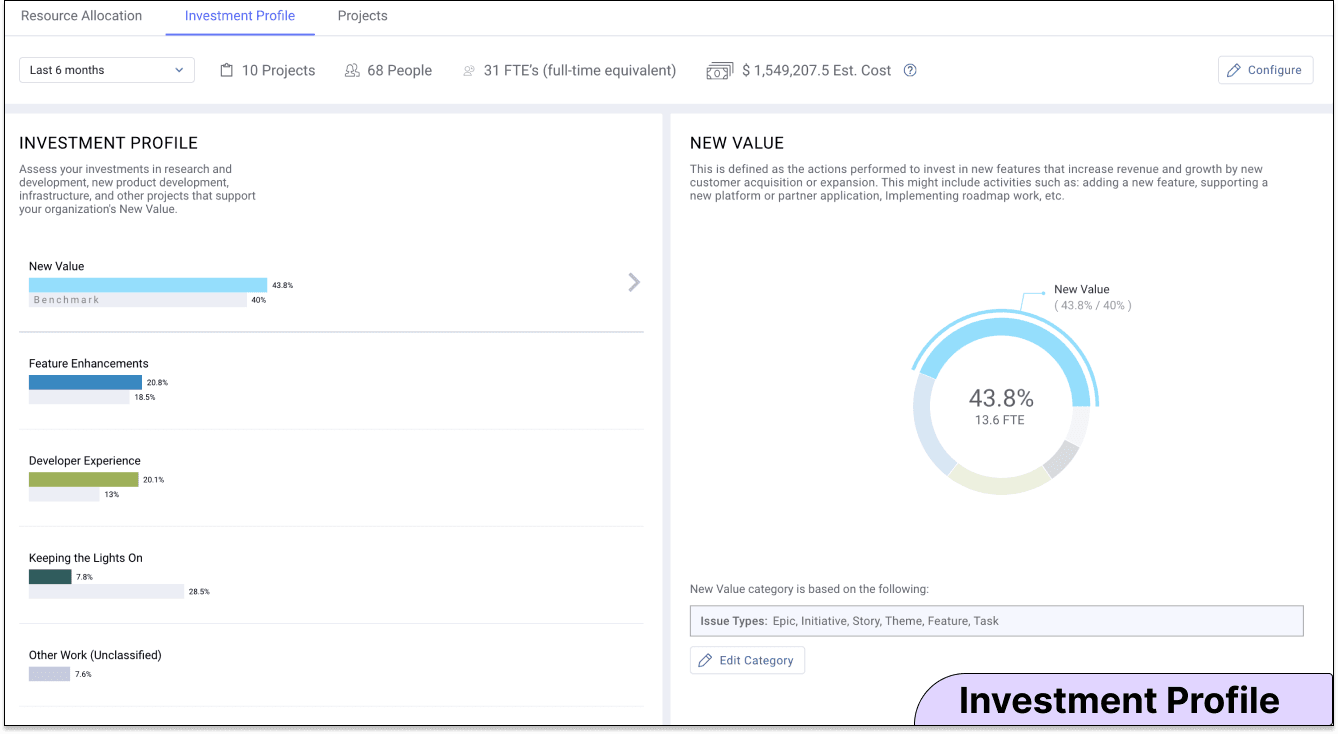
LinearB’s capacity planning and forecasting capabilities are broken into three dashboards: Resource Allocation, Investment Profile, and Projects.
The Resource Allocation dashboard is an evolution of project management tool reporting. It helps engineering leaders understand their investments across projects, teams, initiatives, epics, etc., regarding full-time employee effort and cost. This dashboard also shows project and issue-type investment trends over time.
The Investment Profile dashboard helps engineering leaders translate R&D investment into terms the business will understand. Bucketing development work into one of five buckets (New Value, Feature Enhancements, Developer Experience, Keeping the Lights On, Other) helps business leaders understand their organization's engineering strategy, helping guide conversations on headcount and project type investment.
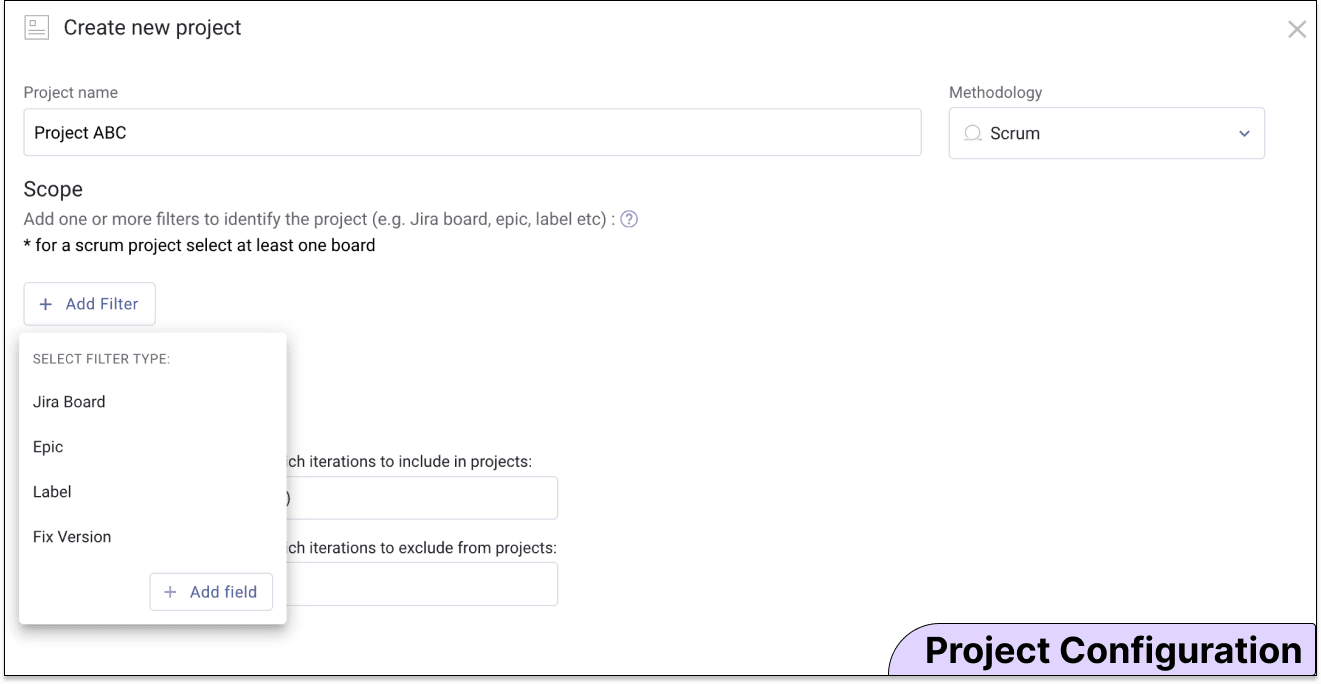
The overall goal of many engineering metrics programs is predictable project delivery. The projects dashboard in LinearB allows teams to self-configure projects across multiple PM boards, epics, custom labels, methodology, etc.
Once created, engineering leaders can see the project investment by full-time employee, investment profile by issue type, and delivery metrics (Planning Accuracy & Capacity Accuracy). The delivery metrics are leading indicators of project health and delivery forecast. This view also gives users a per-sprint breakdown of the completed and added work.

To achieve maximum data integrity and accuracy, the data used to digest all the information mentioned above is based on PM provider data (Jira/Azure) and on data from GitHub.
8. Role-Specific Customizable Reporting and Dashboards in SEIPs:
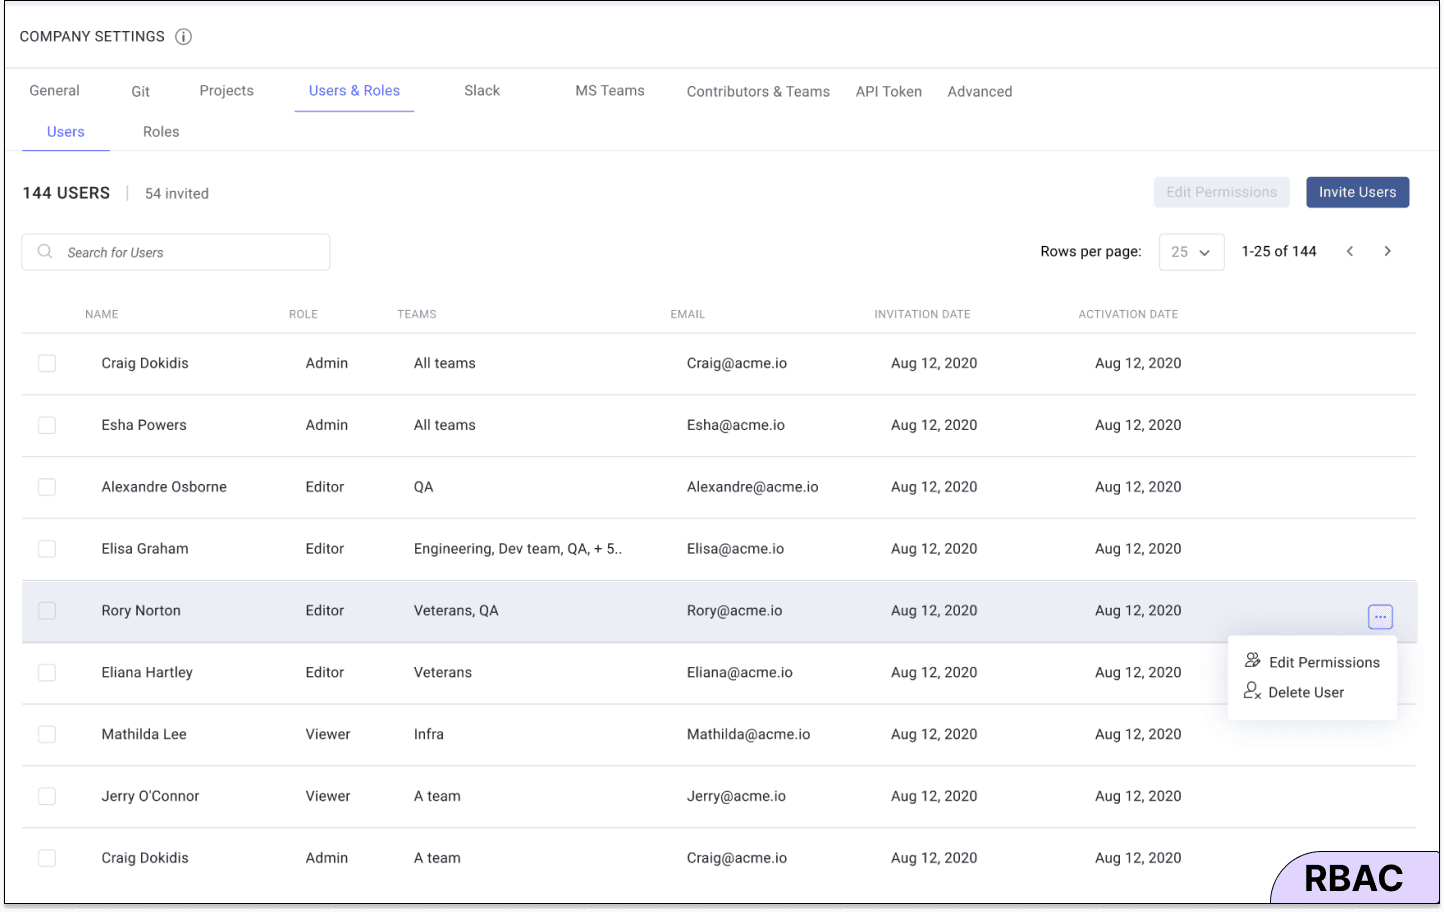
Adaptability to the diverse roles within an engineering team is vital. SEIPs should offer customizable dashboards and reporting tools for different team needs, such as self-service configuration and custom reporting. The platform should also support role-based access control to manage data access and permissions, ensuring data security and integrity.
LinearB’s Perspective
The needs and responsibilities of the engineering leader versus the manager can vary widely. The ways of working can vary widely between teams in the same organization.
We have invested significantly in self-service configuration and custom reporting to adapt to role-specific requirements.
While the engineering leader typically uses the Resource Allocation dashboards and org-level settings, the engineering manager is provided with dashboards and tools focusing on the daily inertia of value delivery.
Team dashboards like our Home and Activity dashboards allow teams to see per team, per sprint reporting, and trends over time. Many of these metrics include our one-click context feature that drills into the metric to show the branches and PRs behind them.
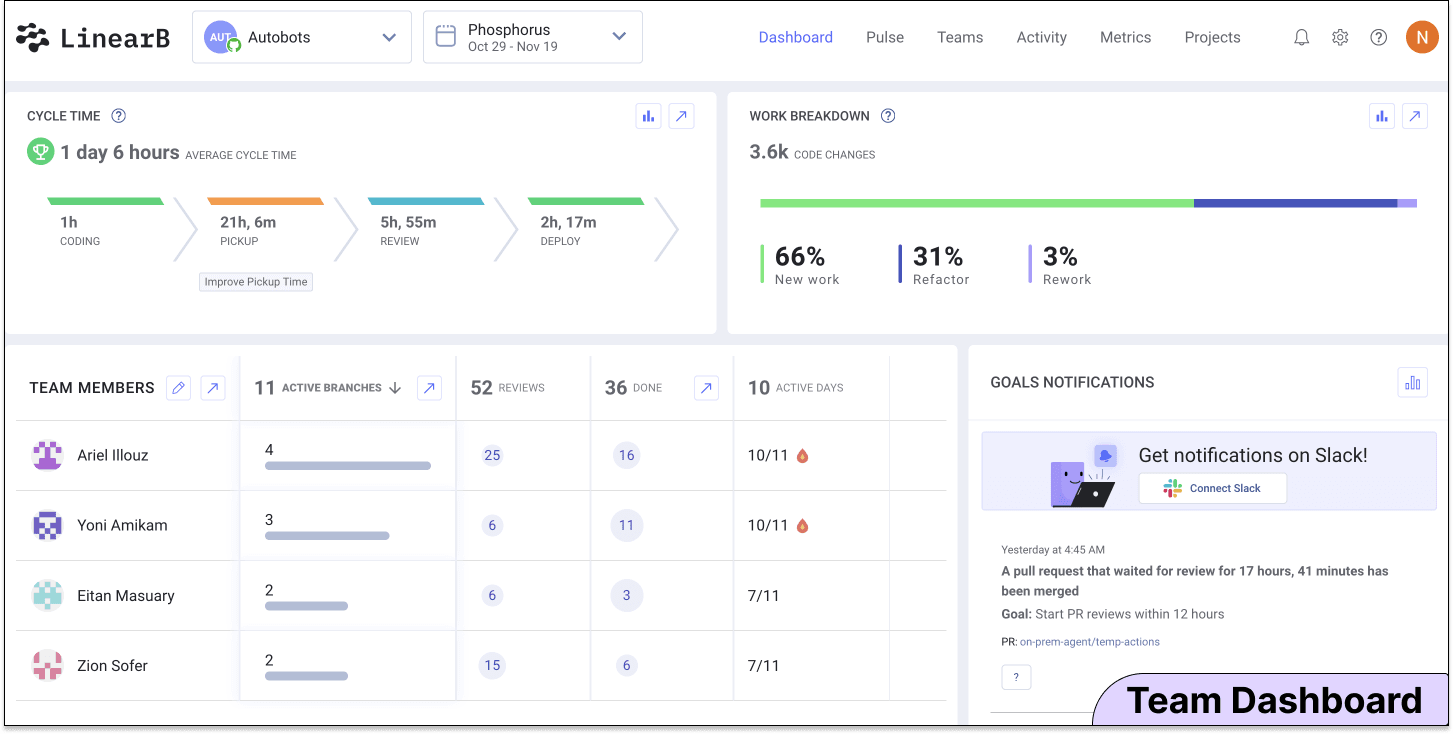
Each team using LinearB has its own settings page that allows them to configure settings like when your team works, what PM boards to include in their metrics, and their Slack/MS Teams updates.
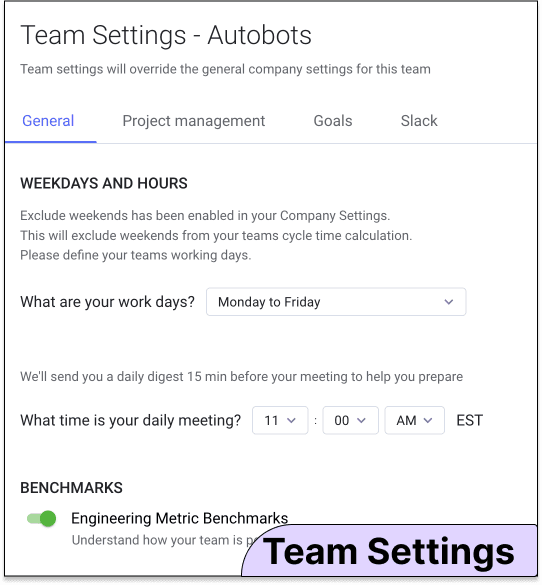
Individual teams can also create a custom team metrics dashboard and configure their team goals settings. All of these capabilities and more are self-service and highly flexible.
LinearB uses a two-dimensional model to restrict data access based on these roles and permissions. Each user is assigned a role determining how to interact with the data. The roles go from least privileged to most privileged:
- Viewer - permission to view data
- Editor - permission to view/edit/delete data
- Admin - permission to view/edit/delete data and modify system settings
By default, each user is restricted only to the data of a team/group they are a member of. This ensures that users only have access to the resources and information necessary for their daily work.
Restrictions can be modified at any time in case the team structure changes. RBAC also supports bulk actions to seamlessly change multiple user roles and permissions simultaneously.
9. Context-Specific Insights and Recommendations in SEIPs:
Beyond metrics, Software Engineering Intelligence Platforms must provide actionable insights and recommendations based on specific contexts. This includes visual cues on team metrics' health and performance, prescriptive recommendations for improvement, and automation tools to enforce best practices. These insights and recommendations are key to driving meaningful improvements in software development teams.

LinearB’s Perspective
Metrics alone don’t improve dev teams. Without applying workflow automation to your bottlenecks, you’re just staring at numbers instead of actively unclogging your delivery pipeline.
gitStream is our 100% free workflow automation tool that applies policy rules to your repositories that classify and route your PRs down specific paths. We built this flexible rules engine directly into our platform to give teams easy access to improvement automation that directly aligns with their engineering metrics goals. Teams that connect repos to gitStream improve their cycle time by an average of 61%.
Here are four quickstart gitStream rules that teams can use to start improving their efficiency and stability metrics:
- Missing Tags: Flag PRs without tests
- 2 Reviewers: Require 2 reviewers for major changes
- Code Experts: Identify and assign reviewers based on knowledge
- High-Risk Tags: Let the security team take the reins on sensitive code
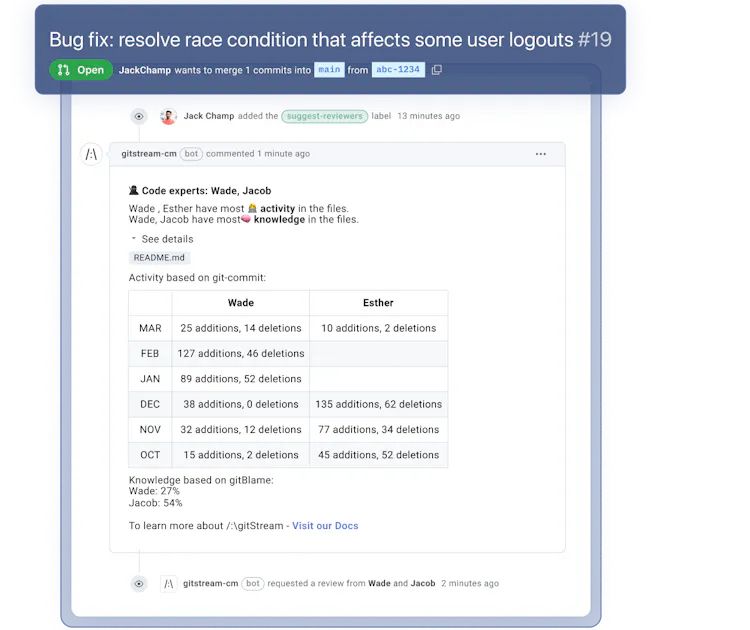
Beyond automation, SEIPs must also provide context-specific insights and recommendations to deliver value. We accomplish this in several ways, from visual cues to prescriptive recommendations.
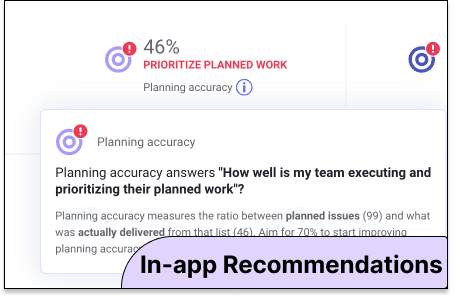
Visual cues into the health and performance of team metrics are one of the first things LinearB users see when they enter the platform. These visual cues are typically color-coded icons with our proprietary benchmarking data behind them. Teams use these benchmark cues to set achievable improvement goals.
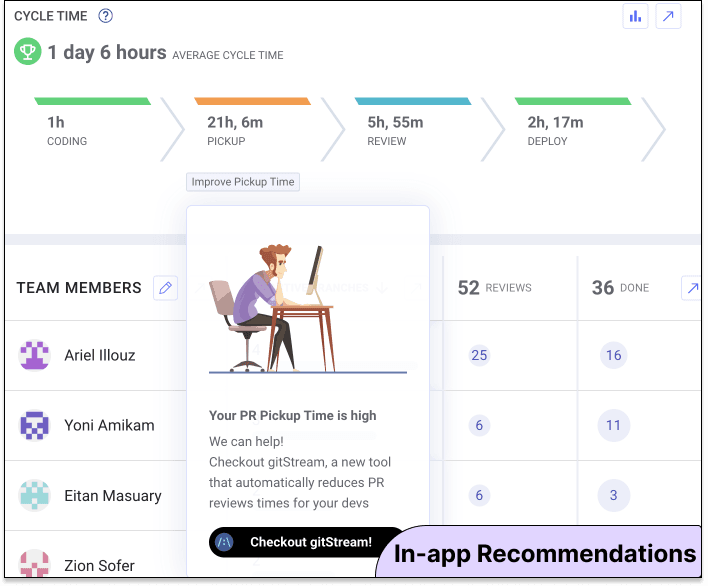
Prescriptive recommendations are also vital in helping new users understand their metrics and what they should do differently to improve them. A great example of these recommendations is within the project's dashboard when a team is outside the healthy threshold for capacity or planning accuracy. Our platform can automatically flag this disparity as a project risk and recommend sprint planning actions to resolve it.
10. Work Items Visibility and Tracking in Software Engineering Intelligence Platforms:
Comprehensive tracking of work items throughout the Software Development Life Cycle (SDLC) is crucial for Software Engineering Intelligence Platforms. SEIPs should offer dashboards that correlate git and project management data for real-time visibility and tracking features that allow teams to monitor metrics by team repository, service, or custom pull request label.
LinearB’s Perspective
LinearB was built as a highly flexible, self-service configuration platform so users can decide how to track work items through the SDLC.
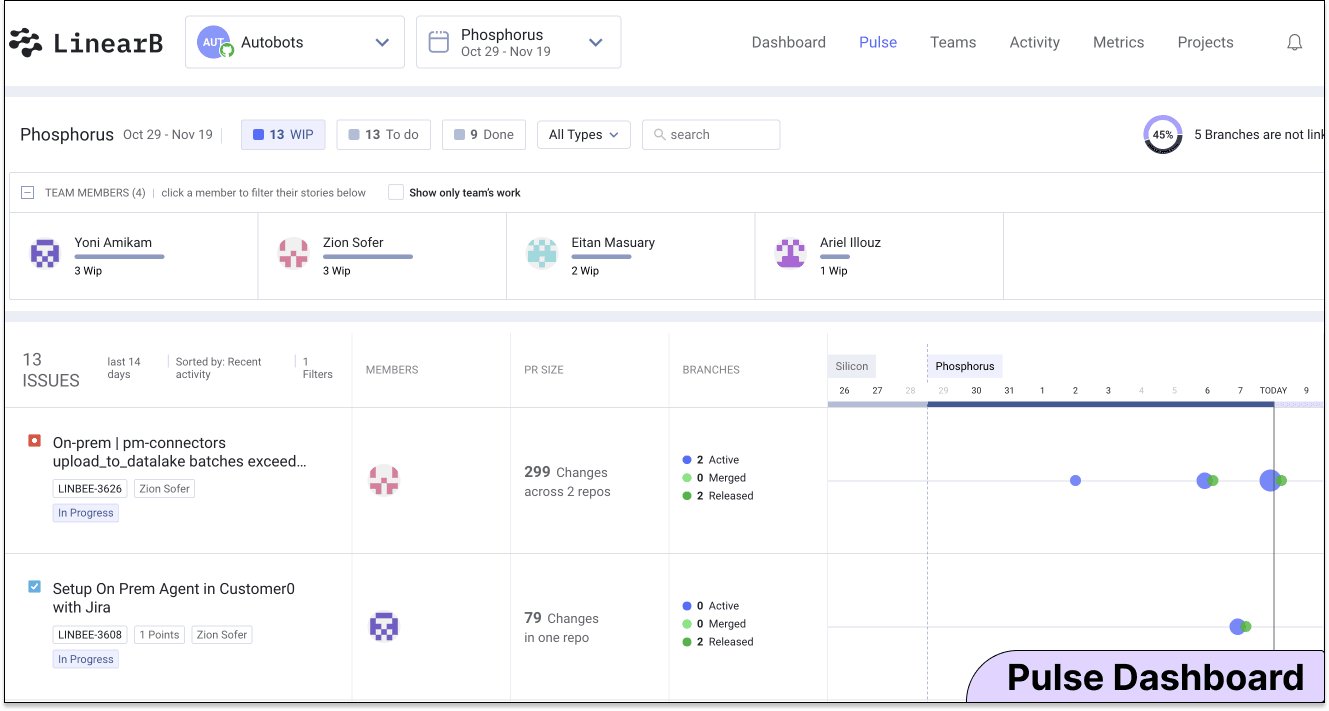
At the team level, managers have the Pulse Dashboard that correlates git and project management data to provide a live view of the activity on a specific issue. If they want to explore how a particular Branch, Pull Request, or Release is doing, they have the Activity dashboard. They can configure a self-service project to track any amount of work across PM boards or by custom label.
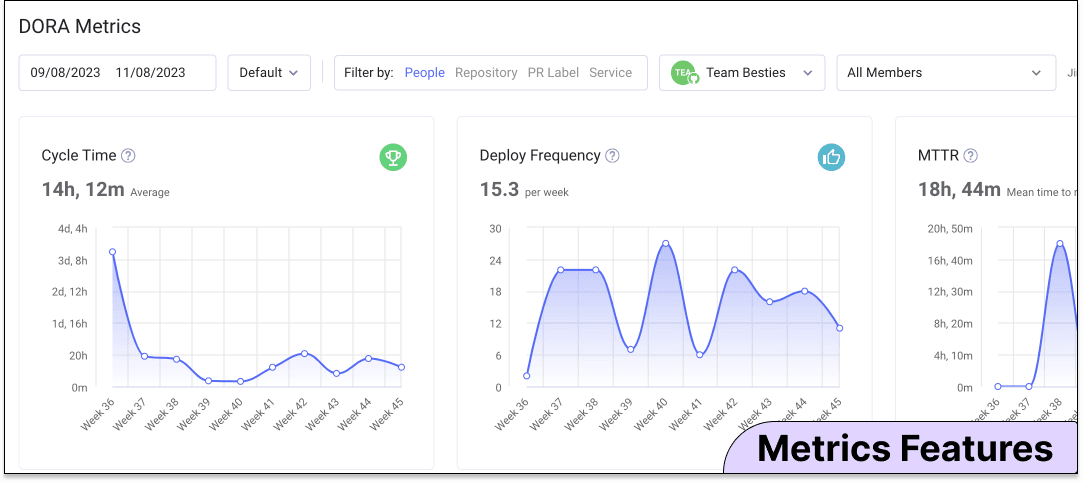
Our metrics dashboard also includes flexible settings that enable teams to measure metrics by team, repository, service, or custom pull request label–useful for measuring the impact of initiatives (like implementing AI).
Just as important, LinearB provides visibility into what isn’t being tracked using our unlinked branches feature in the Pulse Dashboard.
This feature identifies which active branches are not correlated to a PM issue - giving managers deeper visibility into what is being worked on and helping improve the platform's overall data integrity.
11. Integrated AI in Software Engineering Intelligence:
While not yet a standard feature, integrated AI in Software Engineering Intelligence Platforms can significantly enhance data analysis and predictive capabilities. Features like natural language processing for in-app queries and rule generation for git operations are examples of AI integration that can provide a competitive edge.
LinearB’s Perspective
Integrated AI has yet to surface as a mandatory required capability in our ability to deliver value to customers. We do have two experimental features in development that will be released soon in private beta:
Natural language processing for in-app queries (e.g., customers can ask, 'When was cycle time at its lowest for the tech warriors team?')
gitStream rules generation (e.g., customers can ask the gitStream playground to 'generate a file that helps auto approve safe changes for specific repo')
We use these two features internally, and they will need further incubation before releasing them to the customer base in 2024.
Beyond the direct integration of AI into the codebase, we have also focused on measuring the impact of GenAI on our customer’s software delivery lifecycle. Using gitStream, customers are auto-labeling pull requests powered by GenAI implementations, enabling them to compare those pull requests to the baseline. This ability to auto-label and measure specific pull requests provides users with a quantitative understanding of the impact of their GenAI implementation. The feature is available today.

For the past five years, we have worked diligently to educate the development community on why metrics matter and how to translate them into business insights. AI will help us scale our current success, and gitStream will be a strong enabler to capitalize on the productivity promise of GenAI.
Conclusion:
Software Engineering Intelligence Platforms are not just about aggregating data; they are catalysts for transformative change in software development processes and dev team culture. By understanding and leveraging these key features, engineering leaders can streamline operations, align them closely with business goals, and ensure a more efficient, productive, and profitable software development organization.
If you want to start implementing software engineering intelligence across your SDLC, schedule a demo with one of our experts and learn how LinearB’s Software Engineering Intelligence Platform can help you achieve predictable software delivery.


