Chocolate or vanilla? Batman or Superman? These are tough decisions to make and really come down to personal preference. But these decisions rarely–except for maybe sparking vigorous debate at the local comic book store–result in a ton of impact once a choice is made.
Scrum vs. Kanban, however, is not such an impact-free decision. There are functions and disciplines in engineering and development teams that seem to be a more natural fit for one methodology or another.
- A team devoted to building a tightly-scoped new product or enhancement within the quarter (like a big bet that the whole company will rally around), will likely gravitate towards Scrum. It’s structured, time bound, process intensive, and can be reported on daily (if need be).
- A team that is open to changes in the scope of what they’re building, handles infrastructure, practices DevOps, or has a customer support role may find more success with the fluid nature of Kanban–where issues are taken as they come, prioritized by need and importance, and worked through at a (ideally) consistent pace.
But LinearB takes more of a Batman vs. Superman view of the Agile debate. We love both equally and can help you no matter which one you choose! Although Batman is clearly better.
We’re here to help you improve your engineering team, create a great developer experience, become more efficient, and better align engineering efforts to the needs of the business–and none of that requires picking one Agile discipline over the other.
We’re all about flexibility and integrating into how YOU do things, not the other way around. But if you’ve chosen Kanban as your preferred Agile development methodology, LinearB can help you improve your team’s productivity and overall pipeline health by providing answers to four key questions:
- Are we maintaining or improving our overall flow?
- Where is my team spending its time?
- Where are my bottlenecks and how do I find them?
- How can I improve my processes?
Are we maintaining or improving our overall flow?
This is the whole point of Kanban: to maintain a steady, consistent flow of work and get stuff done–so answering this question should be a chief concern. There are several KPIs that tell this story, but we’ll focus on three: Cumulative Flow, Cycle time, and Throughput.
Going back to Kanban’s roots in car manufacturing, the mentality is that it’s better to maintain a steady flow of 1000 cars a week for 10 weeks, than to commit to 10000 cars by the end of the quarter. Why?
- Kanban lets you optimize your processes as you continue to build–prioritizing speed.
- Scrum means stopping to discuss/solve problems, break everything into sprints, look back on what’s working/what’s not and hopefully all of this is backed up with data–prioritizing process.
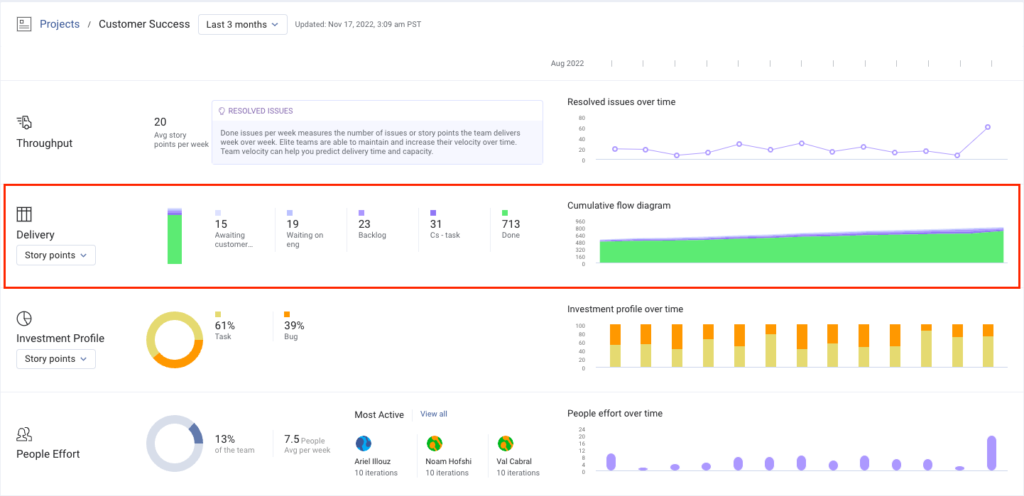
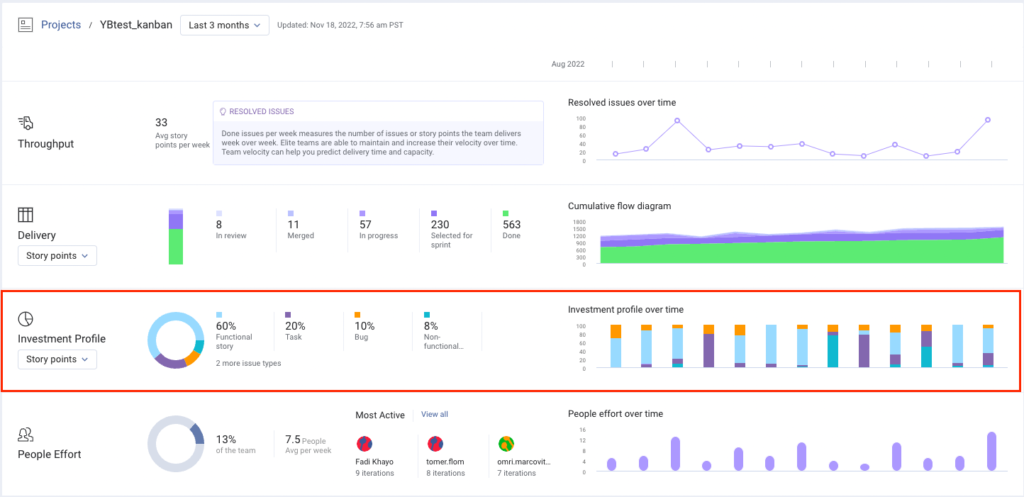
Project Delivery Tracker (PDT)–specifically the Cumulative Flow Diagram–is going to provide the quickest answer to the flow question. This view shows you where your issues are spending time (like “To-do” “In process” and “Done”). It’s organized by issue count or story points, whichever works best for you.
In a single view, you can see how well you’re moving your work through the stages of your pipeline–however you define it. In short: The flow diagram shows you how well you’re maximizing “Done” issues and keeping “In-progress” to a manageable level (the overall best practice for Kanban).
But flow is only part of the equation, you’ll also want to look at cycle time–the time to move a piece of work (a pull request or “PR”) through the development pipeline. LinearB breaks it down by phase (Coding, Pickup, Review, Deploy) to show you an average of how long things spend in each phase.
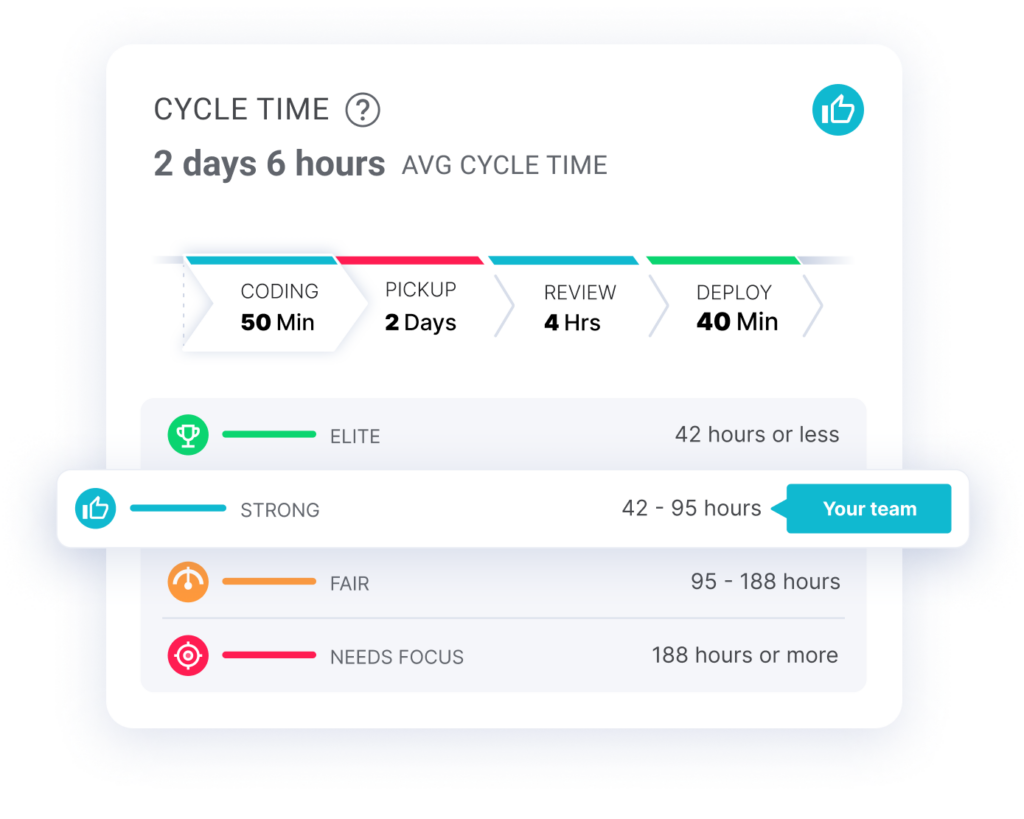
It’s crucial that cycle time remains stable (and of course in the “Strong” or “Elite” category). Why? Because cycle time is the foundation for moving work through the pipeline. You’ll never achieve a healthy flow if your cycle time isn’t healthy.
It’s important to remember that while cycle time is important for Kanban teams, WIP (and keeping it to a manageable number) is equally important. A PR doesn’t just affect a single person–it creates WIP for 2 people (the requester and the reviewer)–more on WIP later.
Back to the original question: Do we have healthy flow? To answer more completely, we’ll go back to PDT.
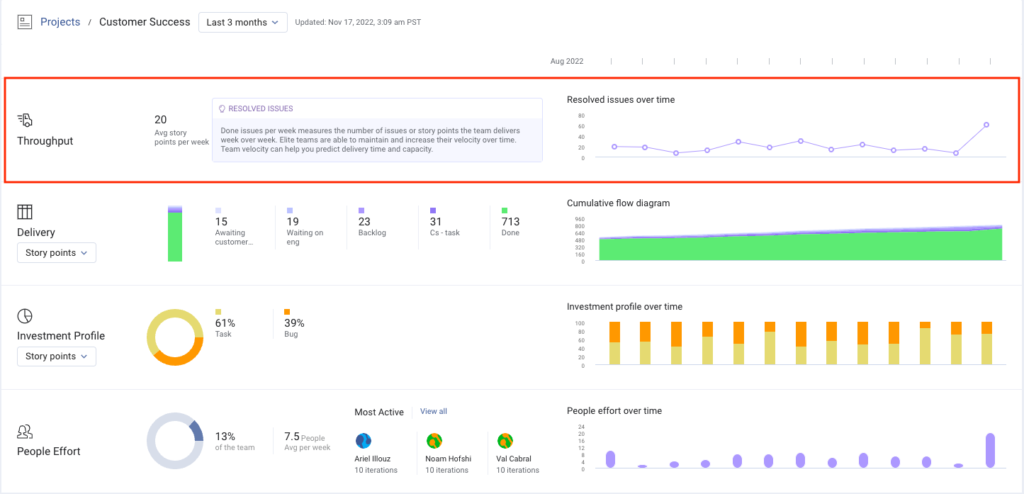
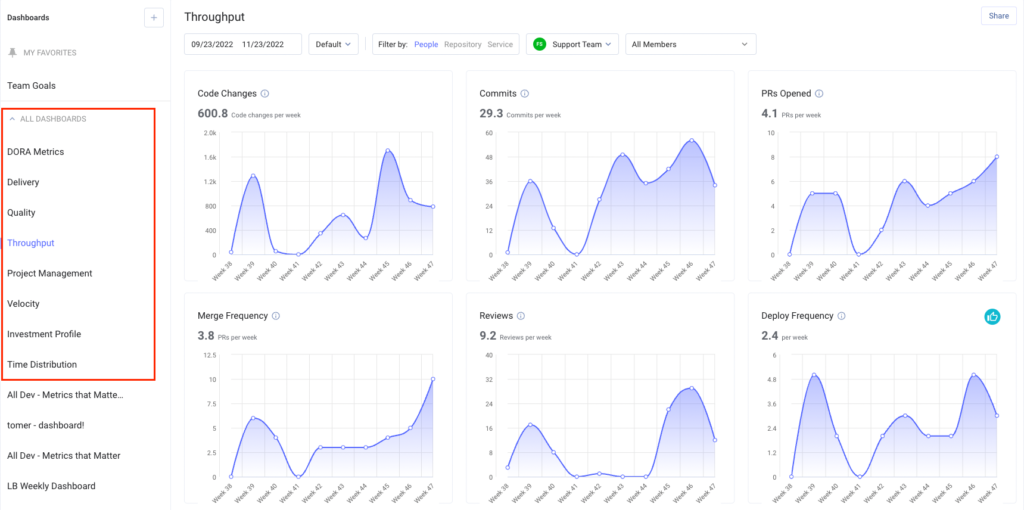
Throughput shows you the number of issues or story points the team delivers week over week. This is great for historical analysis of performance, seeing improvement trends, and providing a roadmap for planning future activities. Elite teams are able to maintain and increase their throughput over time–which will help you predict delivery time and capacity.
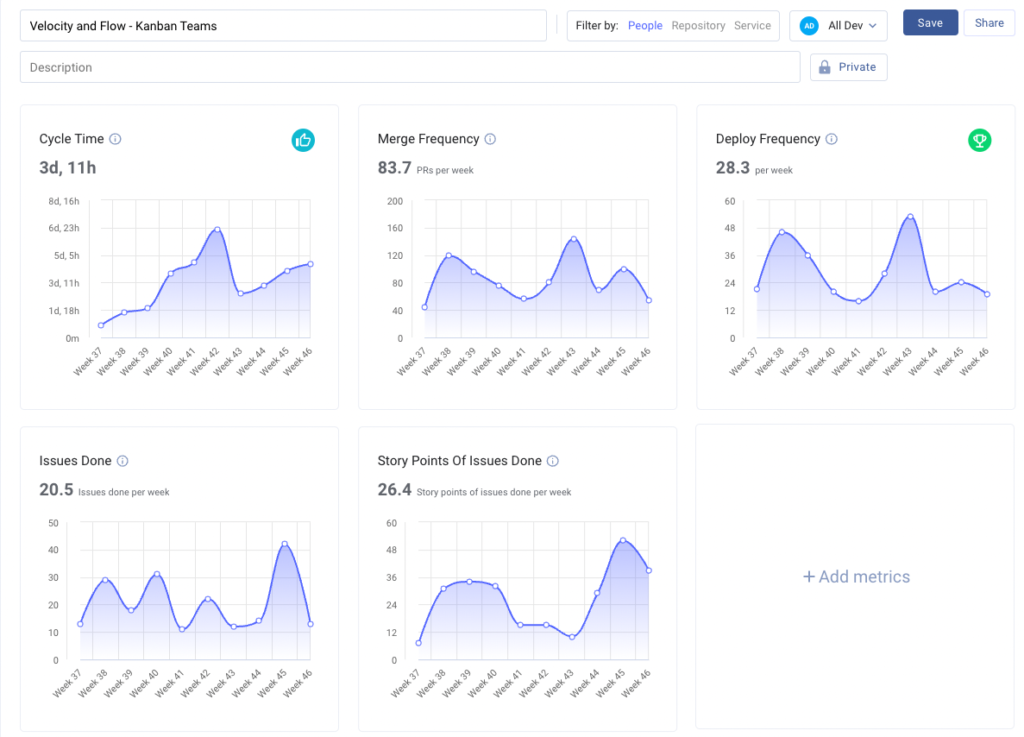
Tying it all together and providing more context, the Metrics tab is full of KPIs that will inform Kanban teams about the health and flow of their development pipeline–users can leverage out of the box dashboards or create their own that puts all of these velocity and flow metrics in one place–things like Cycle Time, Merge Frequency, Issues Done, and more.
We’re also excited about some upcoming features that give teams more custom and granular metrics in LinearB that better reflect your PM tool. Kanban teams will have a more clear sense of the total lead time (the time from ideation all the way through to delivery into customer’s hands). Stay tuned for more information on these exciting updates!
Now let’s answer the next question.
Where is my team spending its time?
In his session at Interact LinearB CEO, Ori Keren, talked about the ETA of developer productivity. In a nutshell, he explained that in order to have real productivity and value, teams need a good developer Experience, a good Tempo and flow of work, and Alignment to the needs of the business. If teams are missing one of those aspects, optimum engineering productivity will remain just out of reach.
That’s a big part of what this question is about–a good experience and solid velocity don’t mean much if your team is headed in the wrong direction–which needs to be a big concern for Kanban teams where (ideally) the flow never stops.
Fortunately, there are several areas in LinearB that help teams decipher if they’re aligning to business priorities.
First, let’s head back to PDT. There is one metric here that really tells a team if they’re working on the right things: Investment Profile. This metric shows you what your teams are working on in the context of your project (defined by board, epic, story, or label). This is where you can see if the team is working on new features, optimization, tech debt, bugs, or however your work is organized in your PM tool.
Kanban teams need to meet commitments to the business for new features, work to improve the product and ensure customers get a good experience, and still take new work as it comes. Investment Profile will tell you if you’re striking the right balance between all of these areas.
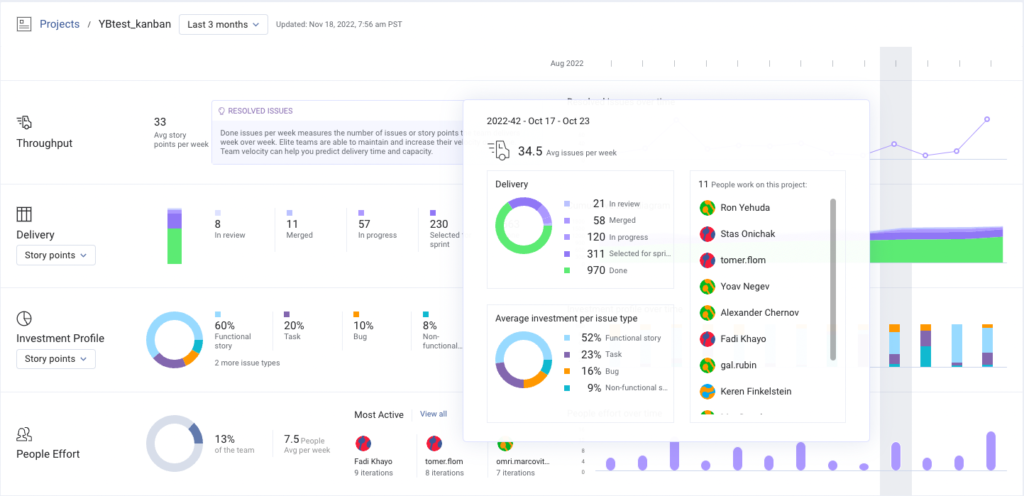
PRO TIP: Investment profile should be taken into account within the context of cumulative flow diagram (how much and what kind of work is getting done in a given time frame).
You can also get this information on a team level (rather than a project view) with Pulse Retro View.
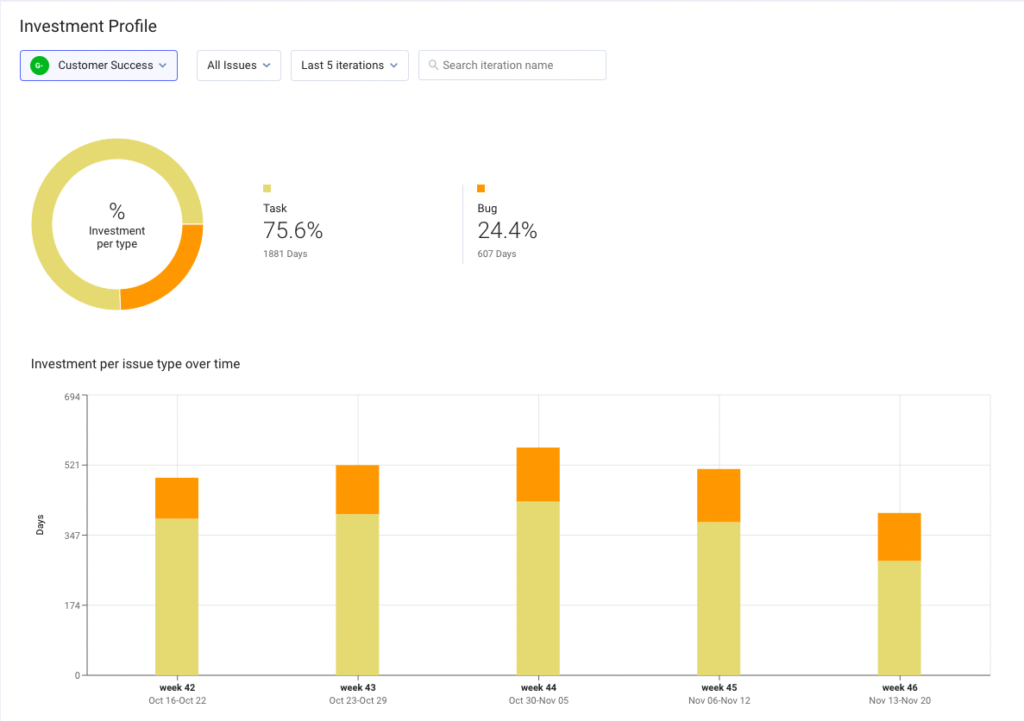
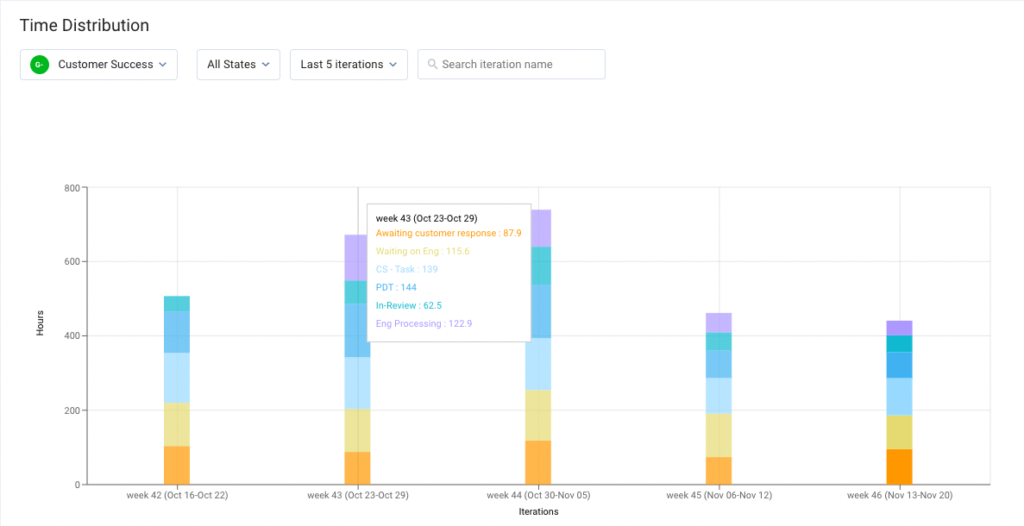
And you can take it a step further in the Metrics tab, which features a Time Distribution and Investment Profile view–again organized by team rather than by project. You can slice the data however you’d like–different time presentations or filtered by work type or issue status.
In short, your team will always know where they’re spending their time and resources–and have the insight to adjust quickly if it’s not a priority for the business.
Where are my bottlenecks and how do I find them?
All the metrics and dashboards we’ve discussed so far lay the foundation for answering this question. For a Kanban team, removing all the blockers that impede flow needs to be a priority initiative. LinearB has several metrics that can help teams find those bottlenecks and provide insight into what to do about them.
You know where your teams are spending their time. You also know that you’ve got a deadline looming for a project that is a big bet for the company. Do you have enough people working on it?
To find the answer, we’ll head back to Project Delivery Tracker.
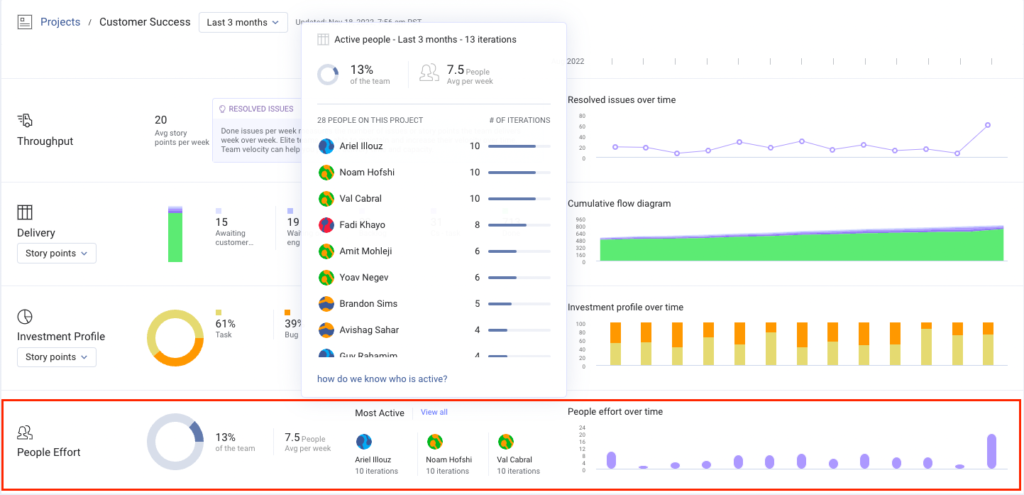
The People Effort metric will tell you quickly if the project your team (and/or the org at large) has deemed mission critical is resourced appropriately.
In addition to seeing if the project has enough people working on it, which is often a significant blocker, the cumulative flow diagram and cycle time breakdown will tell you where work is getting stuck. If you’ve got cycle time that “Needs Focus” and more WIP than done issues, you know that project will likely be delayed.
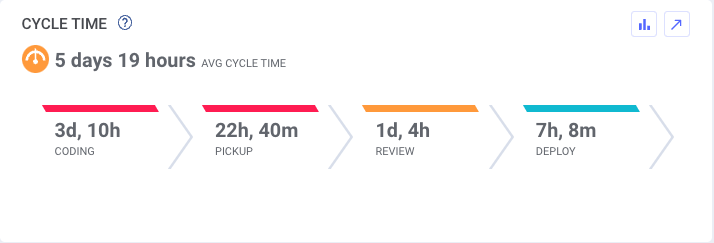
In the above cycle time breakdown, pick up and review time are problem areas (denoted by their color). Clearly work is getting stuck in these phases–which is a fairly common scenario. It’s easy to think that when a PR has an owner it’s that person’s WIP and therefore their problem–”you build it, you own it.”
In reality, every time a PR is issued it creates two pieces of WIP: The original PR (still in progress) and now the WIP of reviewing and approving that work.
And WIP is the killer of Kanban success.
To address this issue, teams first need to find the root cause. One click context and the Activity tab make that easy. Users just need to click into a phase of cycle time–they’ll then be taken to a pre-filtered view of the Activity page where they’ll find all the work that contributes to the metric.
What you should look for here is large PRs and a high number of active branches (WIP). These are your project bottlenecks. The goal should be to keep WIP down and PRs small (more on goals later).
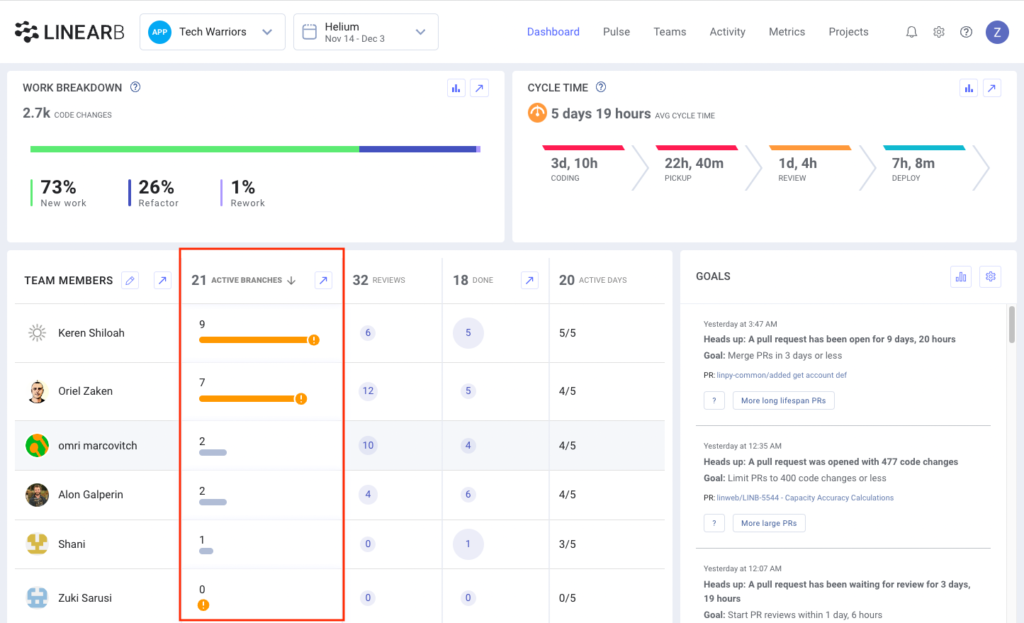
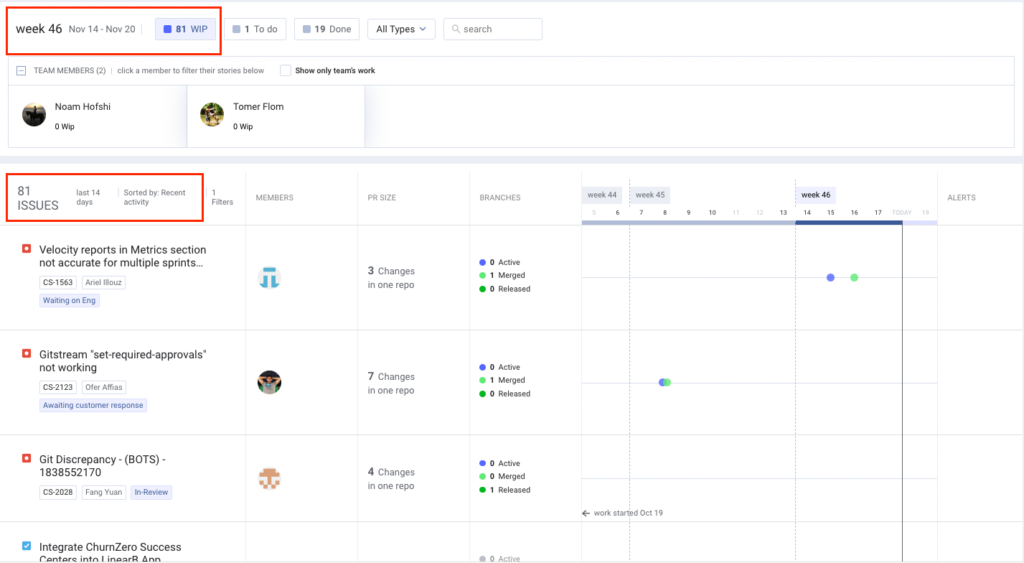
You can also quickly determine if WIP is your problem on the Home Dashboard by looking at your team’s active branches–too many active branches splits focus and creates high cognitive load and context switching. This is all counter to the goal of Kanban. The same goes for if there is too little work assigned to a team member, if you have overloaded people and those with no WIP, it’s worth having a conversation about.
A great place to determine project status and find bottlenecks in real time is Pulse–specifically the WIP count. Pulse is great because it combines git and PM activity in a single view so getting a status update is fast and straightforward. It also shows you everything currently in progress for the team and helps you determine if there is too much WIP.
Finally, you can use Metrics to find bottlenecks and see KPIs that affect Kanban teams–things like PR size, cycle time phases, and throughput metrics. You can do this from the out-of-the-box Metrics dashboards or by building custom dashboards that include the metrics you want to see in a single screen–LinearB is flexible!
And just like from the Home Dashboard, you can use one click context to deep dive into activity that’s informing your metrics and find your process bottlenecks faster right from the Metrics tab.
How can I improve my processes?
Answering this last question really doesn’t depend on your agile methodology. Here’s the thing: Knowing there’s a problem and knowing what that problem is doesn’t make any difference without the ability to do something about it.
If you use PRs, you’ll find success with optimizing your pipeline with these tools in LinearB:
Team Goals enable you to set and adjust objectives around your engineering health metrics, like the size of PRs, the time it should take your team to pickup/review PRs once they are issued (or merged), ensuring PRs are reviewed adequately, and avoiding merges without review.
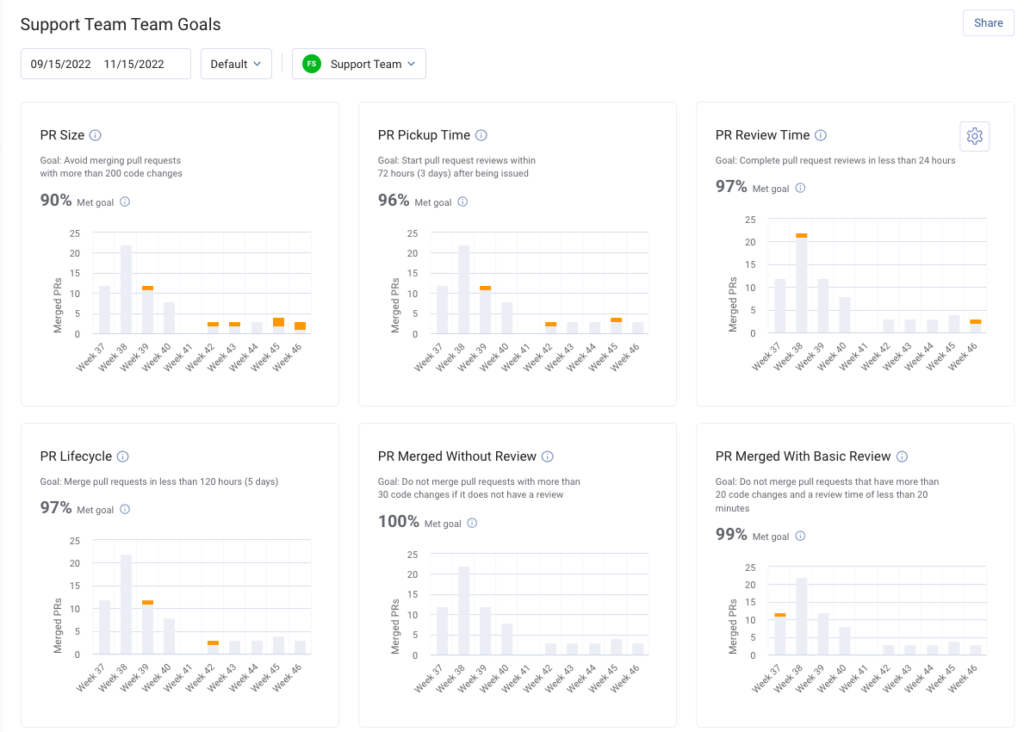
When implementing Team Goals, be sure to set them according to the Engineering Benchmarks (those little icons you see around the product). The idea is to go from Fair to Strong and from Strong to Elite.
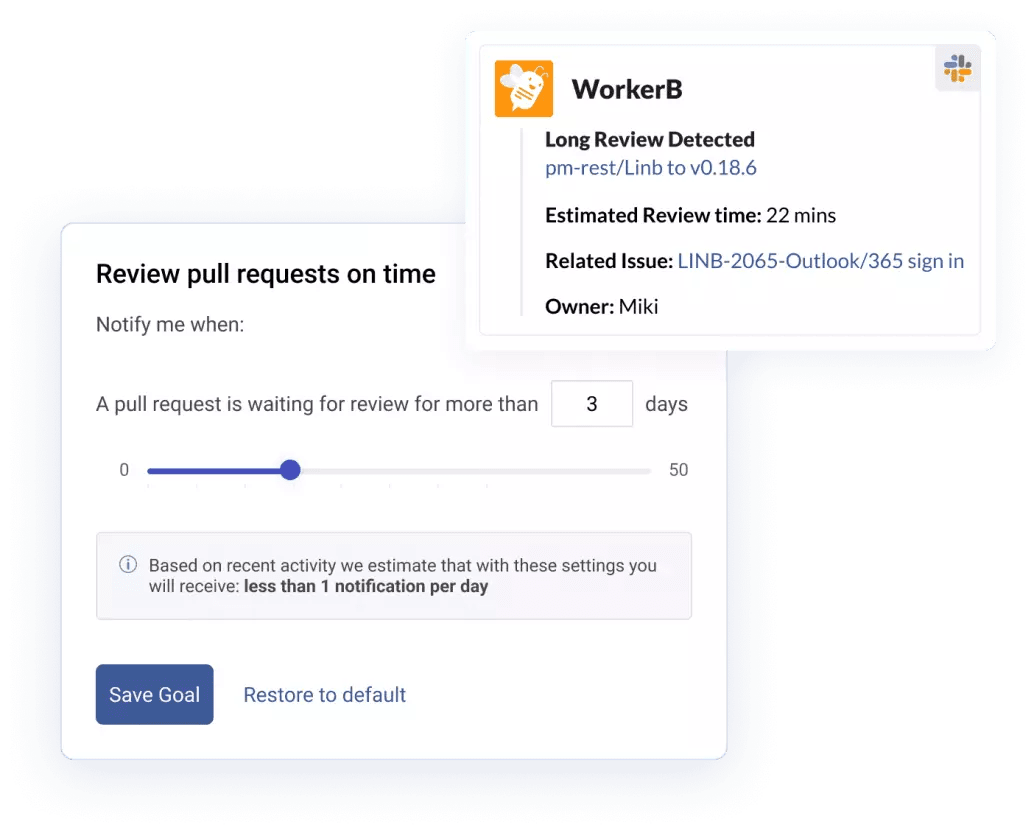
WorkerB is the automation and notification engine for LinearB and what makes it easy for teams to take action, stay aligned to team goals, and sustain improvement initiatives. This bot works with Slack or MS Teams–where your teams spend the most time–and optimizes developer workflows by doing things like:
- Sending team alerts related to goals
- Sending personal alerts to keep teams organized and help prioritize work–like a PR review assigned to you that will only take an estimated 15 minutes (maybe do this before lunch?)
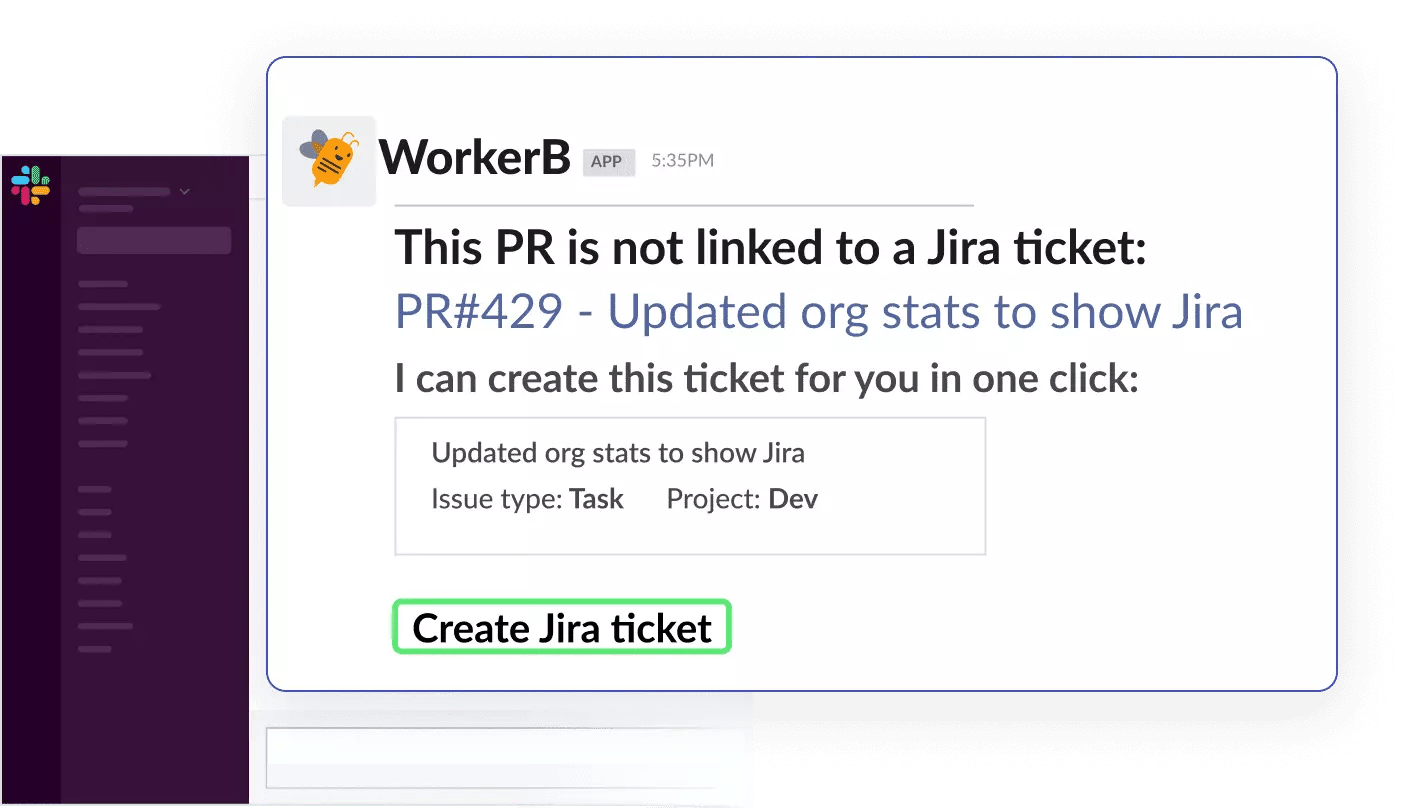
- Automating annoying tasks that get in the way of getting work done like creating Jira tickets in a single click when your team is in the flow and doesn’t want to stop
- Approving and merging small, menial PRs (like doc changes) directly from Slack–no need to sign in to git
All of these help to improve flow and get work out of “in progress” and over the finish line into “done” faster and with less friction.
Finally our latest offering, gitStream, is all about helping teams merge more frequently (because merging devs = productive devs = happy devs), improve their developer experience and align to the principle of Continuous Merge. It works by giving teams the ability to apply the right level of effort to the right PR–with the ultimate goal of moving work through the pipeline faster.
gitStream provides visibility and context for PR reviewers and in cases of PRs that really don’t need any human intervention (like a doc or README.md file change) can automatically approve and merge the PR. gitStream also includes other automations for finding and assigning available/appropriate reviewers (like two senior devs for complex or mission-critical work).
Final Thoughts
We covered a lot in this post – like how to:
- Ensure alignment to the needs of the business with Investment Profile
- Confirm a healthy flow with PDT and the Cumulative Flow Diagram
- Keep stability and quality high with DORA metrics and Cycle Time
- Improve teams with automated tools like WorkerB (crucial for driving meaningful change).
But hopefully we made one point crystal clear: LinearB helps answer the key questions that Kanban teams should frequently ask themselves about their development pipeline.
You can learn more about how LinearB can help you improve your Kanban team with a free dev account (for teams of <8) or a personalized demo. Get started here!