Translate Engineering Health to Business Impact
Software development is a key driver of business success. Engineering leaders need to show how teams are moving the business forward–using terms other than “more story points.” With LinearB you can:
Control spending with Resource Allocation
Reduce delay risks with Predictable Project Delivery
Automate reporting on capitalizable projects for finance
Build a connection between engineering output and ROI
Flat Budgets. More Demands.
Tough Calls.
Leaders know how to solve complex problems–and software development has no shortage of those. Engineering leaders face many challenges: competition, shrinking budgets, rising costs, and a lot of inefficiency baked into the SDLC. And “standard tools” lack meaningful visibility into or ways to improve team (and business) health–which just compounds these problems.
Prove Engineering ROI
with Data-Backed Insights
Make the tough calls (correctly) with engineering metrics that translate to business impact. LinearB gives leaders the insight they need to scale efficiency (and revenue), prioritize projects correctly, rationalize investments, reduce costs, and answer “When will feature X be ready?” or “Can we get it faster?” before they ask.
Get Started
Transform Engineering from Cost Center to Revenue Driver
Engineering
ROI
Cost Control
Predictability
Impact
Metrics
Bottom line: Engineering health is business health. When you improve key engineering metrics it has a direct impact on the business. A tool that helps your engineering practice improve is no longer a nice-to-have. LinearB helps you improve by:
Benchmarking your team with metrics that matter in minutes
with more context and meaning
Identifying inefficiencies and improvement opportunities including over-or-under resourced projects
Automating improvement with tools like data-backed goals and one-click workflows to drive better outcomes in engineering
Transform Engineering from Cost Center to Revenue Driver
Engineering
ROI
Cost Control
Predictability
Impact
Metrics
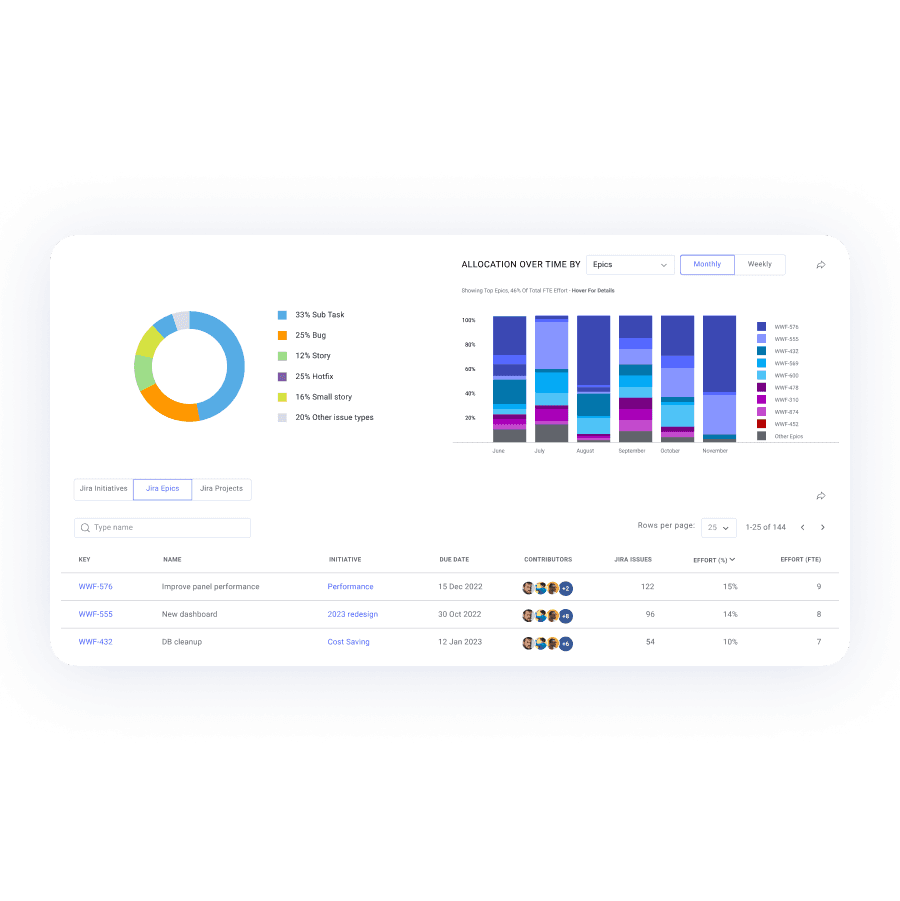
In the world of shrinking budgets, engineering leaders have to get creative to do more with less–that means being smart about project priorities, resource allocation, and keeping costs in check. With LinearB, you can do all of that in a single view.
Quickly generate reports on capitalizable projects for finance
See how much each project is costing in FTE effort and real currency
See the projects and kinds of work your people are spending the
most time and effort on
Transform Engineering from Cost Center to Revenue Driver
Engineering
ROI
Cost Control
Predictability
Impact
Metrics
Every business counts on engineering to deliver when they say they will. If they don’t, sales suffer, customers lose faith, and campaigns can’t launch. LinearB’s Project view helps team identify delay risk and become more predictable with:
Metrics around planning and capacity accuracy
Work breakdown that shows the impact of unplanned and added work
Customizable views by projects, teams, or both
Proactive suggestions on how to improve and set data-backed OKRs
Transform Engineering from Cost Center to Revenue Driver
Engineering
ROI
Cost Control
Predictability
Impact
Metrics
Build a metrics program with engineering health data that really matters to executive stakeholders. Then connect the dots between those metrics and business goals you want to achieve. With LinearB you can:
See foundational metrics like DORA right out of the box
Dive into leading indicators to get additional context for metrics
Set goals and show progress against engineering benchmarks
Illustrate how your reduced cycle time or PR size has propelled the
business forward

Documentation
Learn how LinearB metrics can help you improve work breakdown and reduce cycle time, change failure rate, and mean time to restore.
Read LinearB Documentation
Blog
Explore the details of software delivery excellence, PR workflows, and how to persuade the boardroom as an engineering leader.
Read the LinearB Blog
Podcast
With 13,000+ community members, Dev Interrupted is your weekly source for what engineering leaders are thinking, doing, & solving.
Listen to the Dev Interrupted Podcast
