We moved to 100% work-from-home two weeks ago and our dev team productivity has taken a hit.
Some of outputs are down 60-75%.
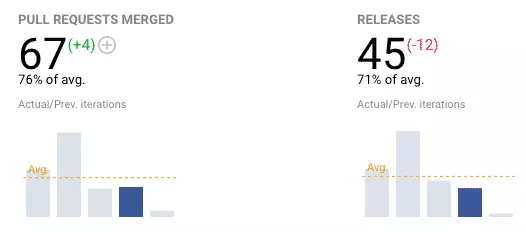
Our cycle time (the amount of time it takes us to deliver work from start to finish) is up almost 80%.
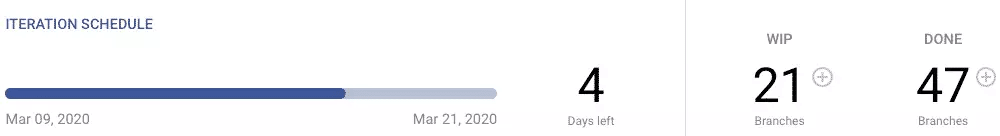
With a few days left in our current iteration, we have much less work completed and much more work left to do compared to our average two-week iteration.
The reasons are obvious.
Our team was thrust into remote work last week.
We are a primarily work-from-the-office company
so it was a big disruption for us.
Our working dynamics changed literally overnight across every possible dimension. Physical working environment, family demands during working hours, communication with co-coworkers, team meetings. And of course the actual process of making software changed. Writing code, getting your PRs picked up, going through the review process, merging, releasing, getting help from your manager for all of the above, etc.
If you’re a leader in your organization in any capacity (CTO, VP, team lead, guild lead, senior dev) like me, the nature of our responsibility to our team also changed overnight.
We’re under a lot of pressure right now. To take care of ourselves. To take care of our families. To take care of our teams. To keep our organizations moving forward. To help our customers. The job just got a lot harder. And there is no roadmap for this one.
But I believe every single one of us has experience we can draw on to get through.
We are experiencing an incredible amount of change. More than normal. But as leaders we deal with change all the time:
- New person coming on to the team.
- Someone leaving the team.
- Someone getting promoted.
- Manager moves on.
- New manager comes in.
- Be part of a new team.
- Go through a reorg.
- Build an offshore team.
- Move office spaces.
- Migrate to a new project management system.
- Move to cloud-based git platform.
- Switch from Kanban to Scrum.
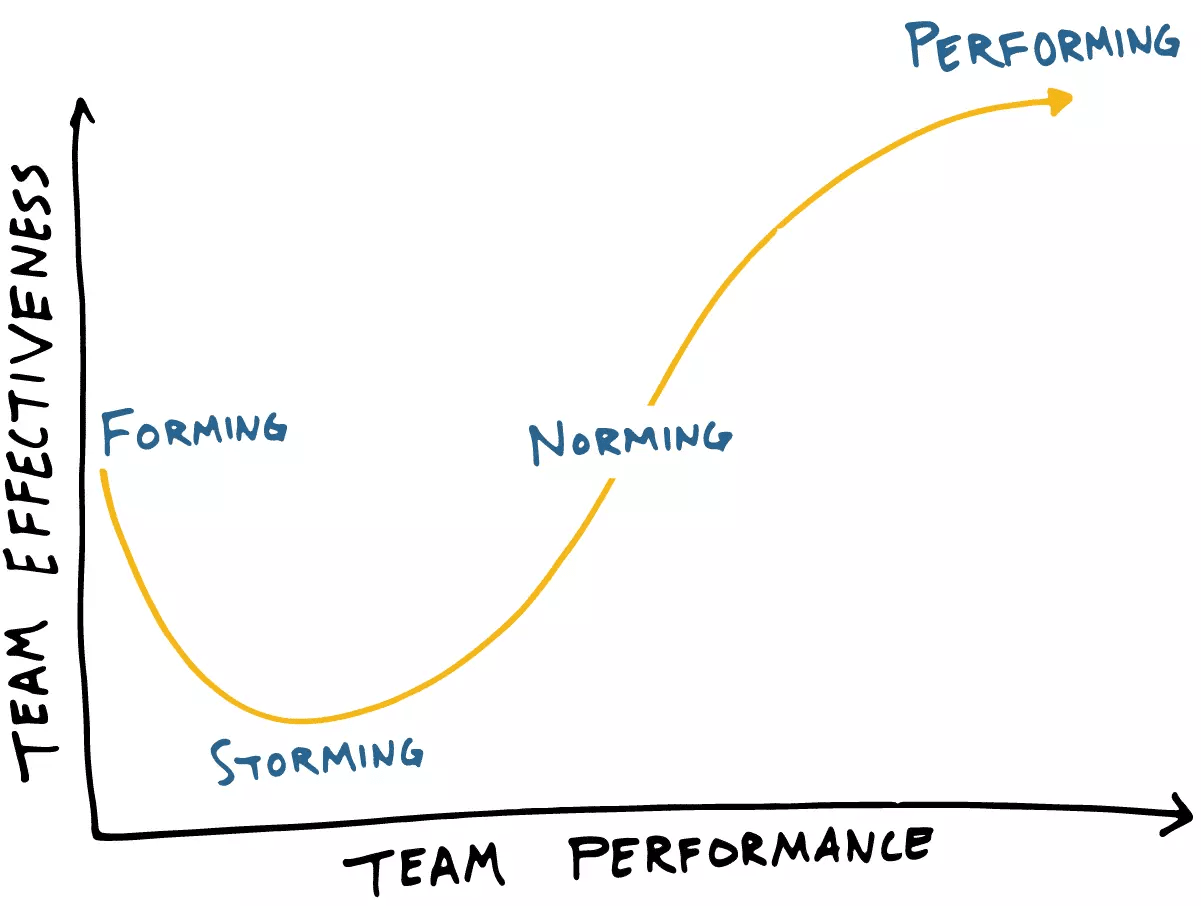
Every time one of these changes occurs, your team that was in a state of “norming” or “performing” gets reverted back to a state of “storming”. Depending on how big the change is, your period of storming may not last long. But it does happen.
(Forming, storming, norming and performing are the four stages from Tuckman’s rule of team development)
When I think about big changes I’ve gone through in my career, several come to mind:
- I got my first team lead job in 2009 in the heart of the financial crisis.
- My boss asked me to start a new dev team from scratch in the Ukraine (where we had no existing presence).
- Rapid growth necessitated that for 2 years I reorg my team every 6 months.
- We got acquired in 2017 and had to integrate into Cisco’s huge dev organization.
One of the core ideas I used to help my team move from storming to performing in each of those turbulent situations was…
Focus on the process.
Specifically, we break work down into chunks and measure our development process at every step.
I’m not saying outputs and outcomes don’t matter. They do. We still have a responsibility to produce value. But in times of change (like right now), your outputs are likely going to be down (like ours are). So measuring the process first is one of the best things you can do for your team. Here’s why:
- Measuring the process helps you detect your biggest delivery bottlenecks so you know where to focus your time and energy. You’ll know you’re moving the levers that will help your team the most.
- Everyone sees their impact on the outcome. In times of change your people feel out of control. By focusing on each step of the process, your team will feel a greater sense of control over what they can personally do to help.
- You can celebrate small wins. It may take you a little while to get your output levels back to where they were. Focusing on the process makes it easy to see small, incremental improvements that you can celebrate on a daily basis. This is great for morale.
When I think about the process of delivering software, I break it into two categories.
1) Core delivery process
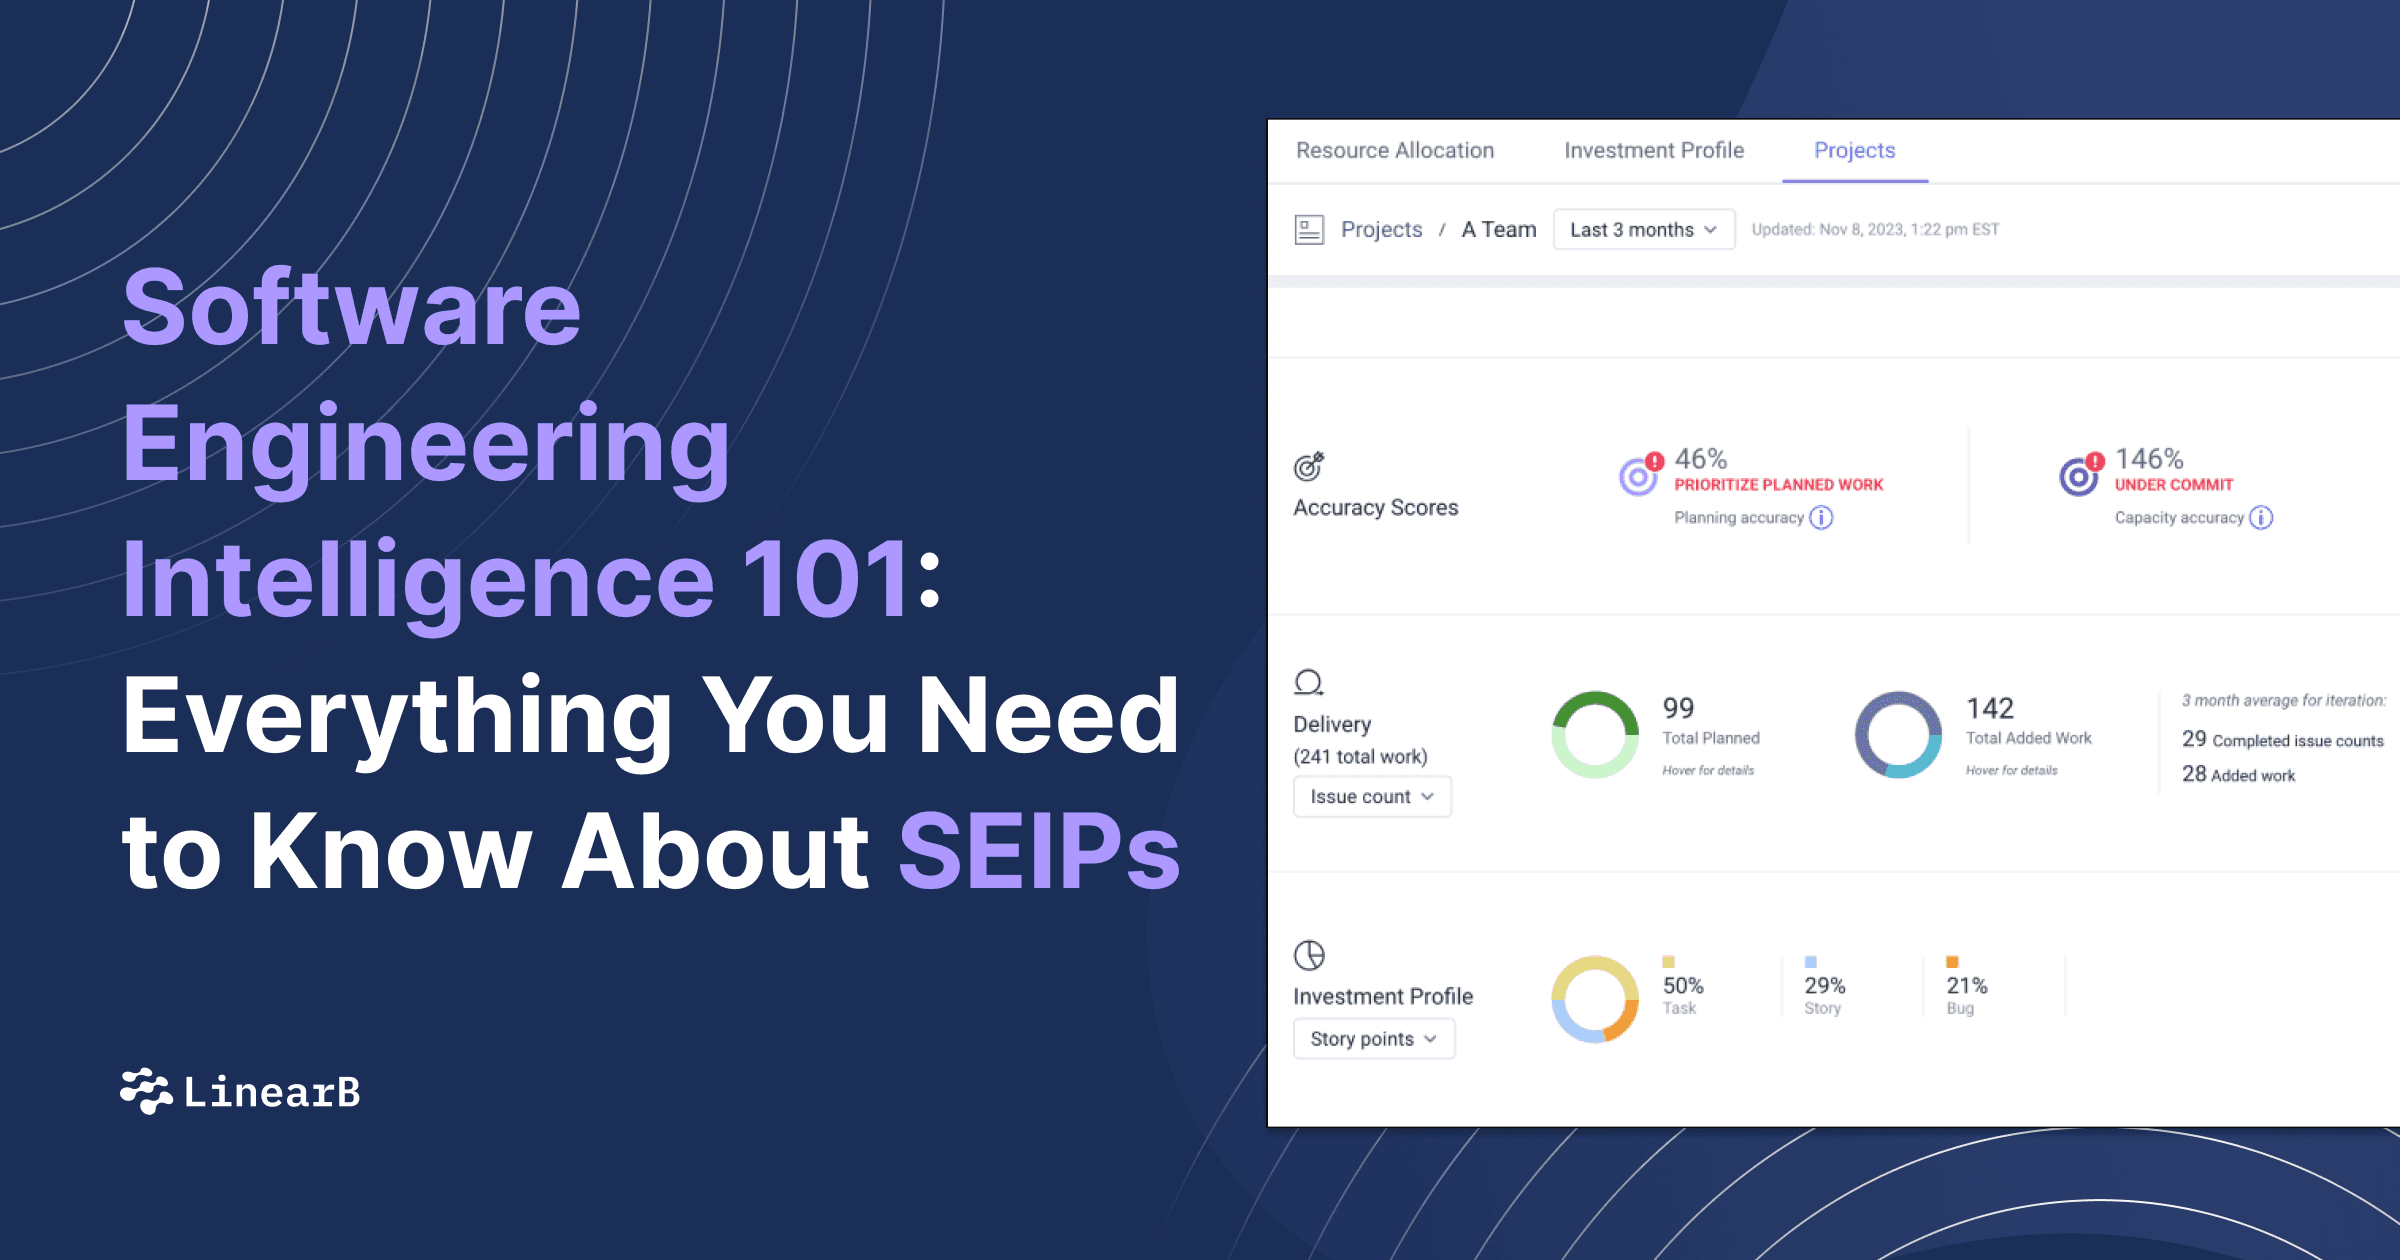
The primary metric we use to measure our development process is cycle time. We look at cycle time across our entire org as well for individual teams. Yes, it is useful to know if releases are up or down (they’re down for us right now) and if you’re hitting/missing your deadlines. But it’s even more useful to know why. Cycle time shows us that because it breaks down the full process into individual phases:

Coding time (which we call fun time) is the amount of time spent writing code for a new item.
Pick-up time is the amount of time it takes for a PR to get picked up by another dev for review.
Review time is the amount of time it takes to review and merge the pull request.
Release time is the amount of time it takes to release code after merge.
Note that if you have full CI/CD in place then your merge time is basically your cycle time.
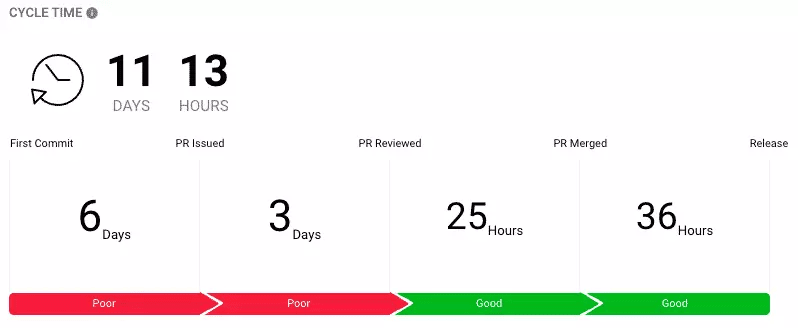
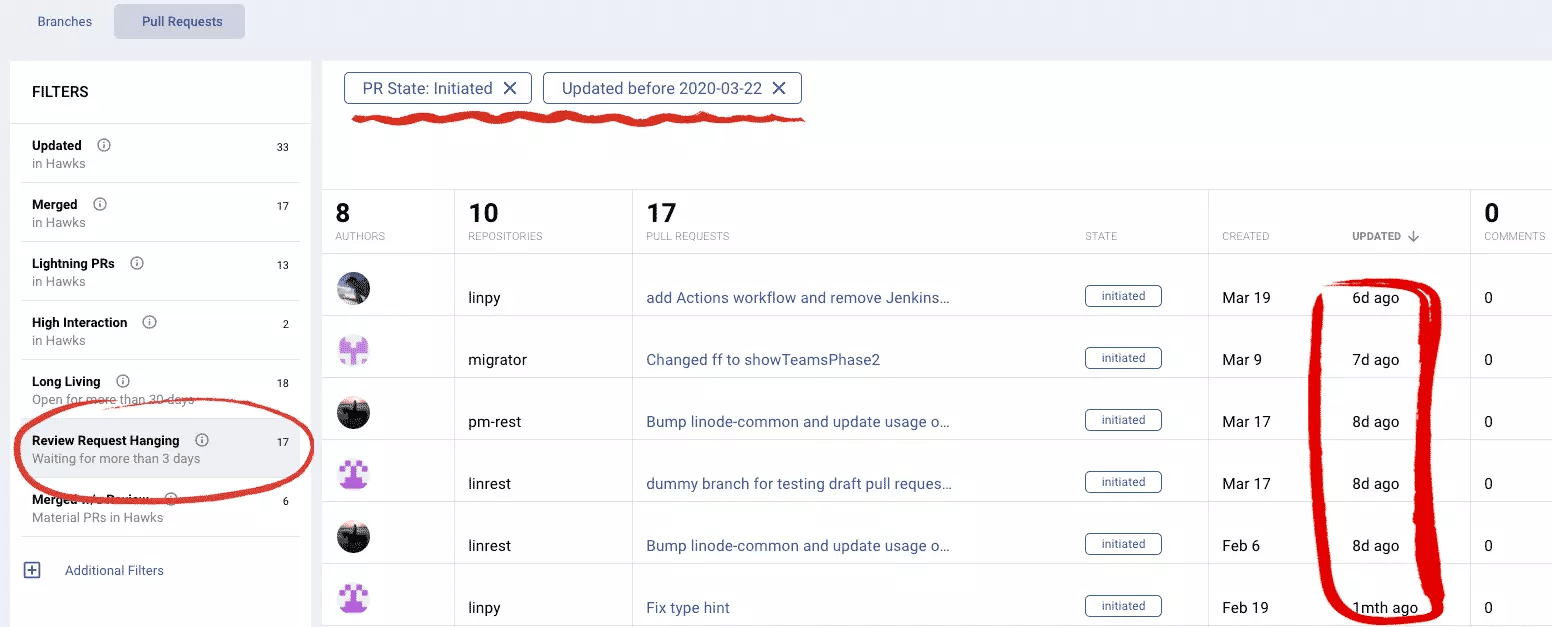
So here’s what we can learn from looking at our current cycle time dashboard.
Our PR review time is 25 hours and has not been greatly affected but our PR pick-up time is way up to 5 days. What does that mean? We think it means a few things:
- Once our team picks up a PR they’re able to focus on helping their teammate.
- But we need more mechanisms in place to ensure our people are proactively looking out for teammates who need a review.
- Since we’re used to sitting next to each other in the office, normally if a PR hasn’t been picked up after 24 hours we can tap our friend on the shoulder and ask for help.
- To address this, we’ve lengthened our daily stand-up by a few minutes specifically so each person can mention PRs awaiting review. So now each person covers 4 things (yesterday, today, blockers, PRs) instead of the classic 3 when it’s their turn.
- We’re also flagging any PRs that have not been picked up after 48 hours as another reminder to the entire team.
Our release time has not been affected by our shift to WFH. Why?
- Before our permanent move to working from home, we did a WFH test day. One of the things we tested was running a release 100% remotely.
- It went really well overall. In part because all of the technology we rely on for the process is cloud-based.
- We did find some areas for improvement during the test including the need to open a Zoom meeting for discussions. We initially tried to communicate through Slack but it wasn’t real-time enough for the release process.
- We summarized our learnings in writing, made the immediate changes we needed and our leaders have been monitoring that process closely.
Our average coding time for new work has skyrocketed from 3 days to 8 days. Why? To be honest, we’re not 100% sure but we’re looking at it closely and speaking to all of our developers to understand what’s happening with them individually. Here’s what we know so far:
- Many of our team members were working reduced hours or no hours at all over the past week.
- Some of our people needed a few days to get things settled at home. Others continue to struggle with disruptions from kids in the house and a lack of a private work space.
- Some were blocked in particular areas and weren’t able to get help as quickly as they normally would.
- Based on the impact the increased coding time has had on our overall cycle time, we decided to write up an individual plan for each developer and increase the amount of 1:1 time every dev has with their manager.
- We have reason to believe that the issues causing the increased coding time are temporary which allow us to forecast a much faster cycle time over the next few weeks.
2) Communication, collaboration, and teamwork
There’s all of these other things that support the core development process that are harder to measure but no less important. UX design meetings, stand-ups, team meetings, 1:1s. Even informal discussions at lunch, hallway conversations and impromptu chats when you just swivel your chair around and ask your teammate a question. All of these help us get our work done.
How do we focus on that part of the process? And how do we measure it?
For us at LinearB, we looked at each of those scenarios, decided how important they were and then figured out the best way we could recreate them in a WFH environment.
Since there is no data to measure the result of a hallway conversation on the development process, we did the next best thing… asked everyone what they thought 🙂
Asking all of your people the same questions and seeing what patterns emerge = legit qualitative data you can use to make decisions.
Here’s two things we’re doing:
1:1 meetings:
We found out that our devs were having really productive meetings with their manager on a regular basis but the conversations were not structured and (mostly) not scheduled. So now every developer has a scheduled time at least once per week.
We also learned that important relationship-building discussions (getting to know one another) was happening outside of the framework of format 1:1 conversations. So, since our team won’t be able to have those conversations any more over coffee, at lunch or in the hallway, we put together a little check list to remind our team leads to ask personal questions to continue those important relationship-building conversations.
- Ask about personal well being. How are they feeling? How is their health?
- Ask about family well being. How is their partner, kids, and family?
- Ask about life changes. What is different about the daily routine at home?
- Ask about the physical workspace. Is it safe and comfortable?
Team meetings:
Our teams told us they were already missing the camaraderie of being with their work friends. Our stand-ups and other team meetings in the office tend to be all business because lots of fun activities are happening at other times. So to make up for all of the mini hoop basketball games that aren’t being played, we’ve lengthened our stand-up and added a weekly full dev org meeting. And we’re adding in fun segments to help our people stay connected. Our UX designer Dana shared an incredible video of her son checking in with his school teacher using his muppet alter identity during our “kid corner” segment.

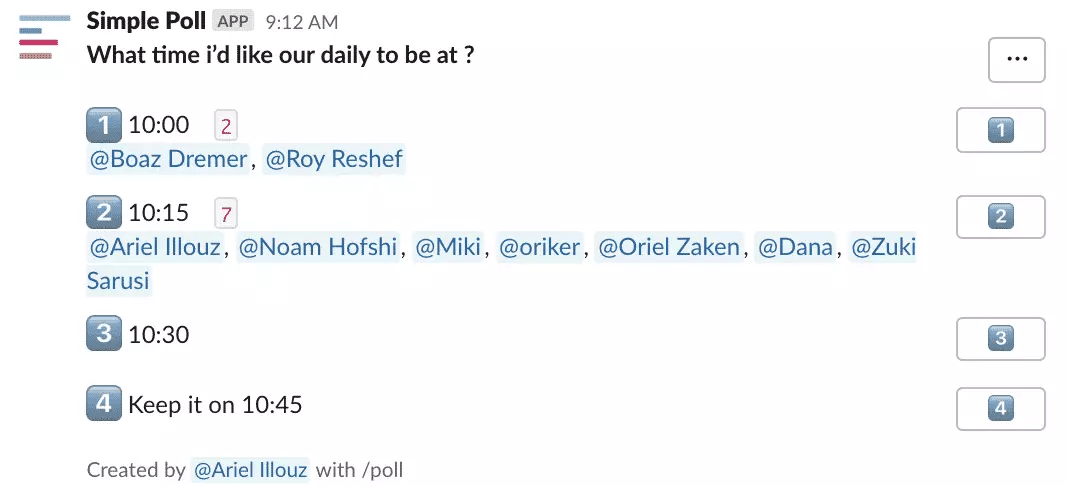
Another thing we learned from interviewing our people was that the days and times of some of our meetings no longer make sense now that we’re 100% WFH. Especially since we just increased overall meeting time (which normally would be unpopular with our devs) we started to evaluate the optimal meeting schedule. There were two things we were solving for:
1) Create as many meeting-free days as possible (not counting our stand-up).
2) Create as many three-hour, uninterrupted blocks as possible.
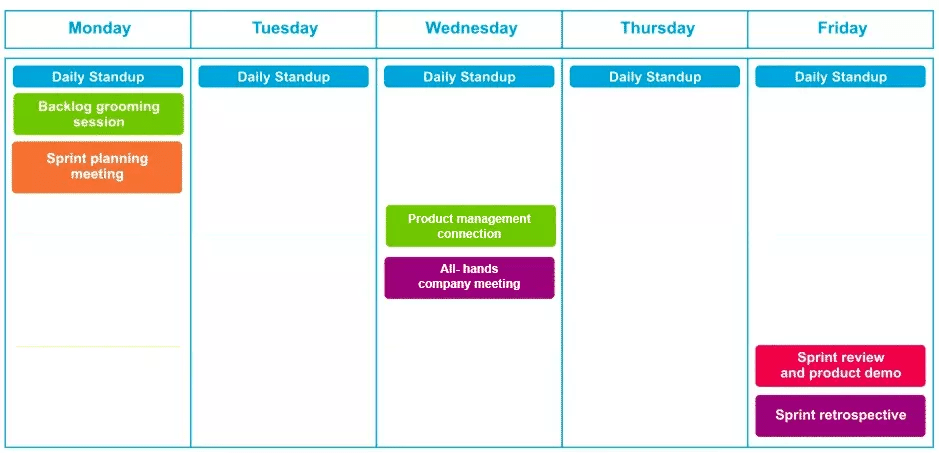
The value of the first point is obvious. The reason for #2 is that we found that, for our team, three hours was the right amount of time for them to get in the zone, get a lot of work done and then take a break. Kind of like a REM sleep cycle. But for coding.
So we decided on an approach to our meeting schedule called clustering. By grouping meetings together, we create more meeting-free zones where deep work can occur. And it also enabled us to find two full days with no meetings (except for our stand-up).
What are you working on?
One other process-related measurement we’re monitoring closely… What are we actually working on and do we need to invest more in non-functional work right now to set our team up for success going forward?
This is a breakdown of our task types from our last few iterations:
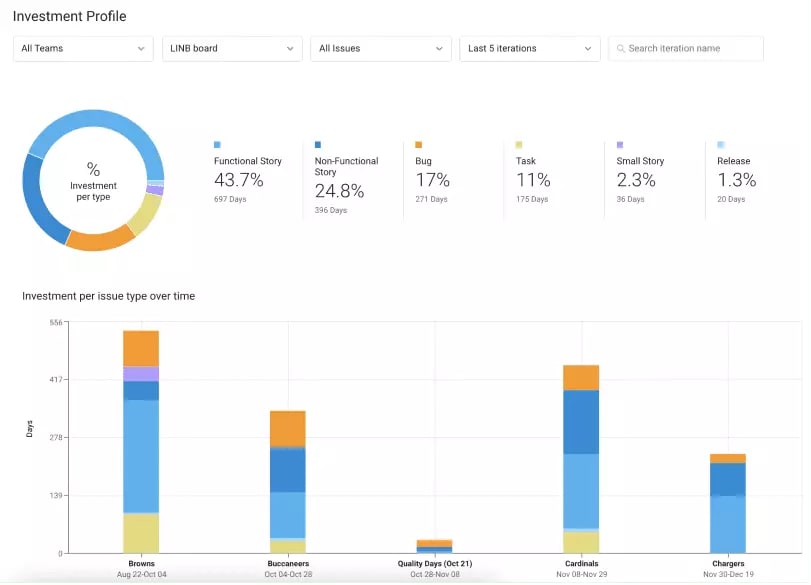
You can see we invested a lot in non-functional back in January and that investment has allowed us to focus more on customer-facing features the last two months. We’re working with our CEO to reevaluate our roadmap right now so it makes sense to evaluate this mix of work as part of that decision-making process.
A New Hope
Just in the last two days since I started writing this blog our cycle time has gone down. Coding time is down 50 hours which means our team is starting to settle in and get in the zone more. And pick-up time is down 26 hours which means the new mechanisms we put in place are beginning to work.
Both are contributing to our efficiency trending up.
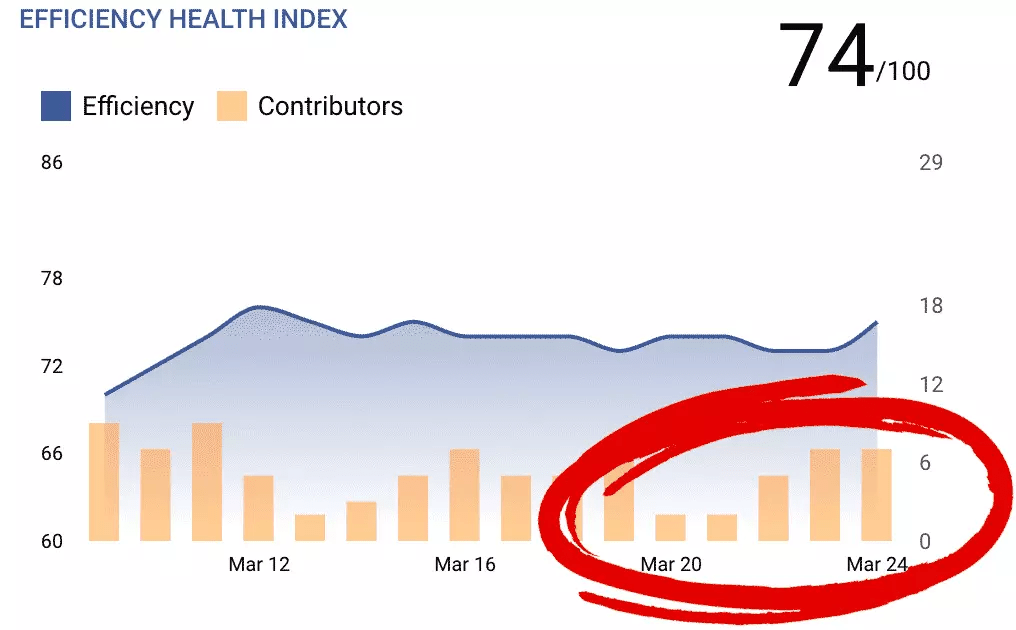
It will probably be a while before we’re back to where we were pre-change. But for now, measuring the process is giving us a lot of small wins to celebrate.
If your team productivity is down, or if it isn’t but you’re picking up a vague sense of uncertainty from your people, start incorporating a few of these ideas into your leadership plan:
- Emphasize process over output
- Look at both aspects of your development process, break it into chunks and focus on a few areas where you can have a big impact in the short term.
- Where you don’t have quantitative data, augment with qualitative data from your people.
- Take extra time to show each dev how they are contributing to the overall process and find a way to celebrate small wins every.
- Encourage your team to stay patient while you settle into your new team dynamics.
By the way…
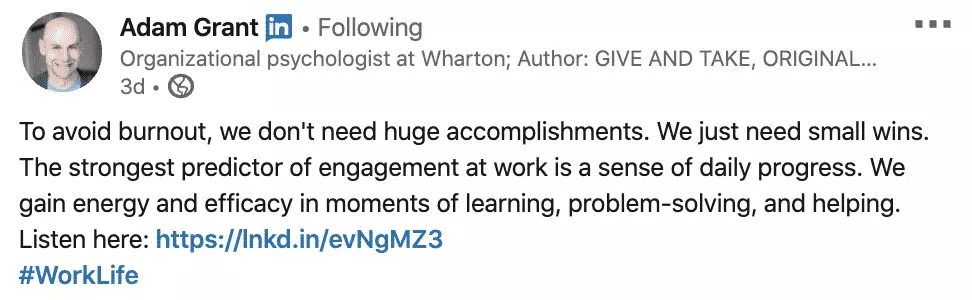
It always makes sense to focus on the process. Even in times of relative normalcy. Adam Grants talks about the best way to avoid burnout in the workplace in his latest podcast.
Where does this data come from?
Earlier in my career, getting the data I needed to measure our development process and guide my teams through change was a lot harder.
Cycle time is tough to measure when the developer source of truth is constantly moving from the project management system, to our git repos to our CI/CD systems, etc. You can get some data from Jira but I’ve never worked in an org where the data was updated consistently so accuracy is spotty.
When I was managing a large team at CloudLock I had the luxury of having data engineers to pull this data for me. It was a manual process that took them hours so we could only get it at the end of each iteration which limited the usefulness of the data. Plus they were only able to pull basic info around tasks types completed (e.g. stories, bugs, non-functional) and carryover work.
My co-founder Ori experienced the same struggles which is why we started LinearB. We pull data from Jira and git systems to create the cycle time dashboard above and other real-time analytics that illustrate how dev teams work across dimensions like speed, efficiency, quality, and resource allocation. You can try it for free.