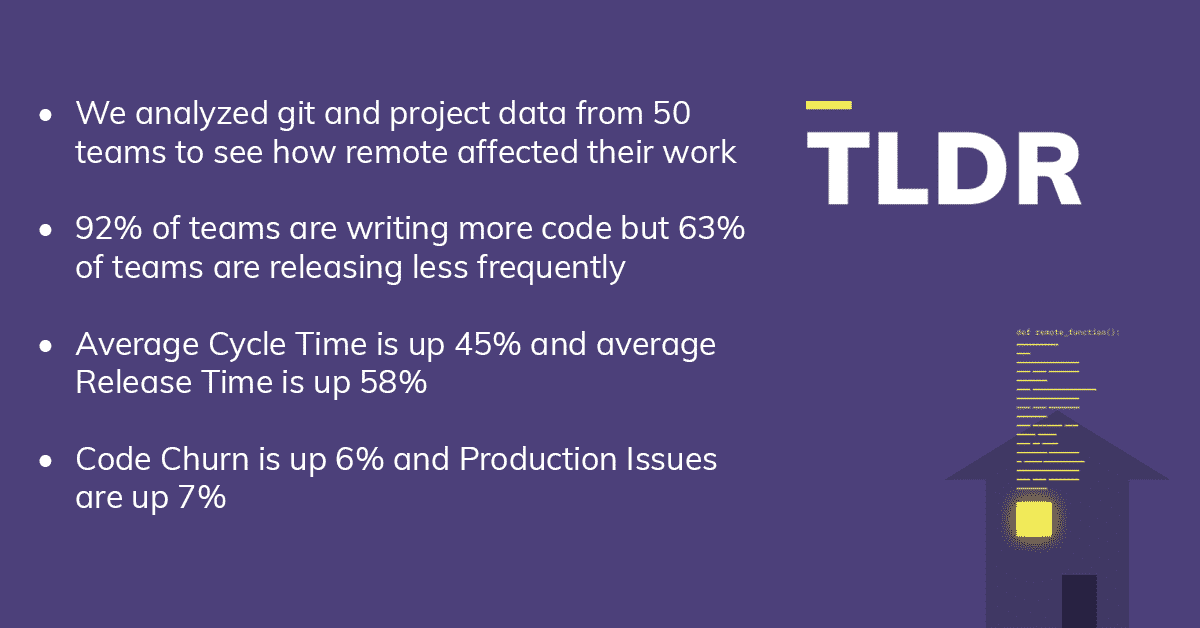
This blog summarizes key findings from the report and includes opinions from LinearB CEO Ori Keren about how we can interpret the data.
If you want all of the facts, click here for the full 17-page report.
We’ve talked openly at LinearB about how our dev team productivity took a hit during our transition to 100% work-from-home.
We expected this. There were short-term disruptions of adjusting to new workspaces and learning to focus with kids and other distractions. And there were longer-term questions to answer like which of our development processes need to be adapted to fit remote development?
Then we heard from some customers that their developer outputs were actually up since they switched to remote. Chris Downard, VP of Engineering at GigSmart, told us recently
“We are actually seeing an increase in productivity across my organization since going fully work-from-home. And it is a little surprising because we are traditionally not a remote-first mindset company although we do have contractors that are 100% remote. There was a concern and worry from my ecosystem that productivity was going to tank. After our first week, I was looking at our numbers and was like ‘oh my gosh’, we are way above what I was expecting.“
The LinearB community is made up of dev teams of all shapes and sizes around the world so we decided to look at the data to see how the abrupt transition to work-from-home was affecting software development teams at large.
Our analysts reviewed 8 weeks of data from 50 dev teams across 11 countries. They used the four week period spanning Sunday, February 9th through Saturday, March 7th as the baseline. Then they compared it to the four week period spanning Sunday, March 8th through Saturday, April 4th. Since the data was completely anonymized for security and privacy purposes, we worked off of the assumption that these teams were working from home by the week of the 8th. The 50 teams range industries and include small teams from start-ups and large teams from enterprises.
Our goal was to answer several questions including:
- Has team productivity been affected?
- Has individual developer productivity been affected?
- Has delivery speed and efficiency been affected?
- Has delivery quality been affected?
- Has the type of work teams are spending time on been affected?
You can access the full report here.
After analyzing the data, we see four trends emerging.
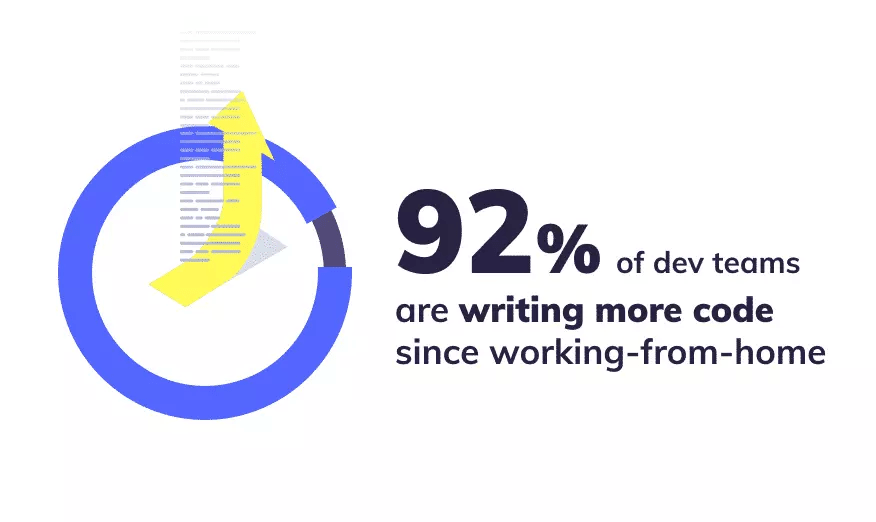
1. Individual dev outputs are up for almost everyone
Additional data
Overall code changes are up 10% but we did see big variances on both ends of the spectrum. 4% of teams had an increase of 200% or more while 6% of teams saw their code changes drop 25% or more.
Our take on what it means
This makes sense. Building software is a team sport. But, for most organizations, the act of writing code is a solo endeavor. Developers need long, uninterrupted blocks of time to “get in the zone”. At the office, they get interrupted by co-workers, meetings, and last-minute design brainstorm sessions. At home, they have the ability to focus more on whatever task needs their attention at that moment.
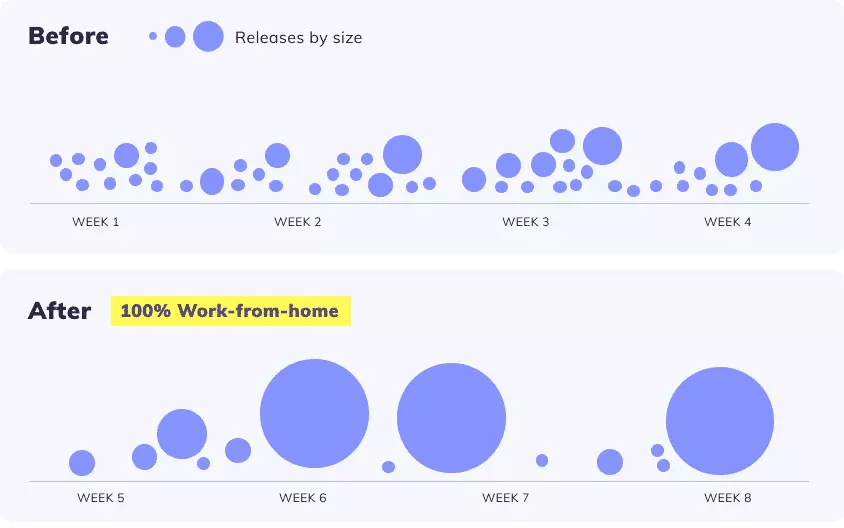
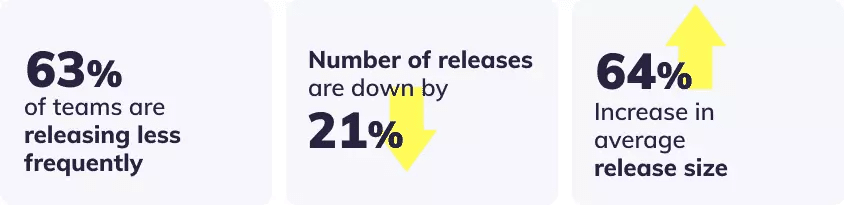
2. Release frequency is down and release size is up
Additional data
Only 10% of teams are releasing at about the same frequency as before and, interestingly, 27% of teams are actually releasing more often since work-from-home started.
For the top 12% of teams, their average release size is up 155%.
Our take on what it means
For agile teams, more code + fewer releases + larger average release sizes = a combustible combination. Frequent releases ensure release sizes stay small and manageable which ensures too much pressure never builds up in the system. When the code change rate goes up and the release frequency goes down, it puts extra pressure on the system which can result in quality issues.
Why are teams releasing less frequently? Manual release requires teamwork and coordination. Many teams with manual release processes get in a room together to orchestrate their releases every 2-3 weeks. Since this is not possible, they may be trying to be more cautious or it may just be harder to get everyone together like they did when they were in the office.
3. Code churn is up and quality is down
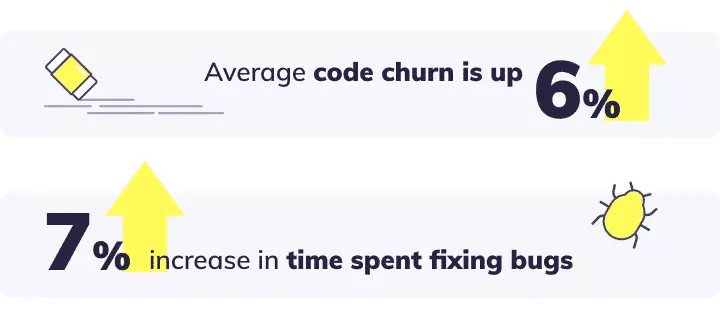
Code churn is the opposite of code retention. It’s when work is refactored after it has been reviewed and merged within 21 days of the original commit date. A 5-10% code churn rate is normal. When the numbers are higher than that, it can be a leading indicator of quality issues and an inefficient development cycle.
Time spent on issues like bugs and hotfixes is more of a trailing indicator of quality but it’s a leading indicator of your ability to invest in new features and other innovation.
Additional data
Before work-from-home, teams were investing 40% of their time dealing with these issues. Now it’s up to 47% on average. Which means they are only investing 53% of their time on average working on new value.
Our take on what it means
This is consistent with the first two trends. The combination of more code and fewer releases is resulting in quality issues. Whatever the cause or motivation is for teams to be releasing less often is, it’s causing more harm than good.
The numbers may not seem big at first but consider the butterfly effect they could have on the roadmap for the rest of the year. For a team of 30, spending 7% less time on new value equates to hundreds of hours lost in a single month. That could be enough to derail an iteration or two which could set you back on any big projects you’re working on.
There are two other theories worth mentioning that could explain why bug fixes are up and new value is down.
It could be intentional. Some companies may be adopting a strategy of focusing on existing customers and that could potentially translate to an engineering strategy of fixing all of the little things that affect customer satisfaction and user experience.
On the other side of the spectrum, decision making and therefore roadmaps may be stalled right now because the future is uncertain. If you’re avoiding making any big decisions or investing in new big features, it’s a great time for a bug smash.
4. Cycle time is up – by a lot
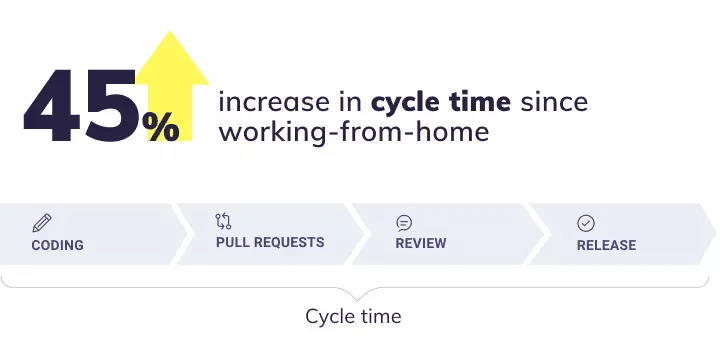
Cycle Time is the amount of time it takes to complete work from the first commit to release. It’s a good indicator of a dev team’s speed and efficiency. When you measure each phase of your Cycle Time, it’s also useful for detecting bottlenecks in your delivery process.

Additional data
Before work from home, the average Cycle Time across our 50 teams was around 7 days. After work from home, it rose to an average of around 10 days.
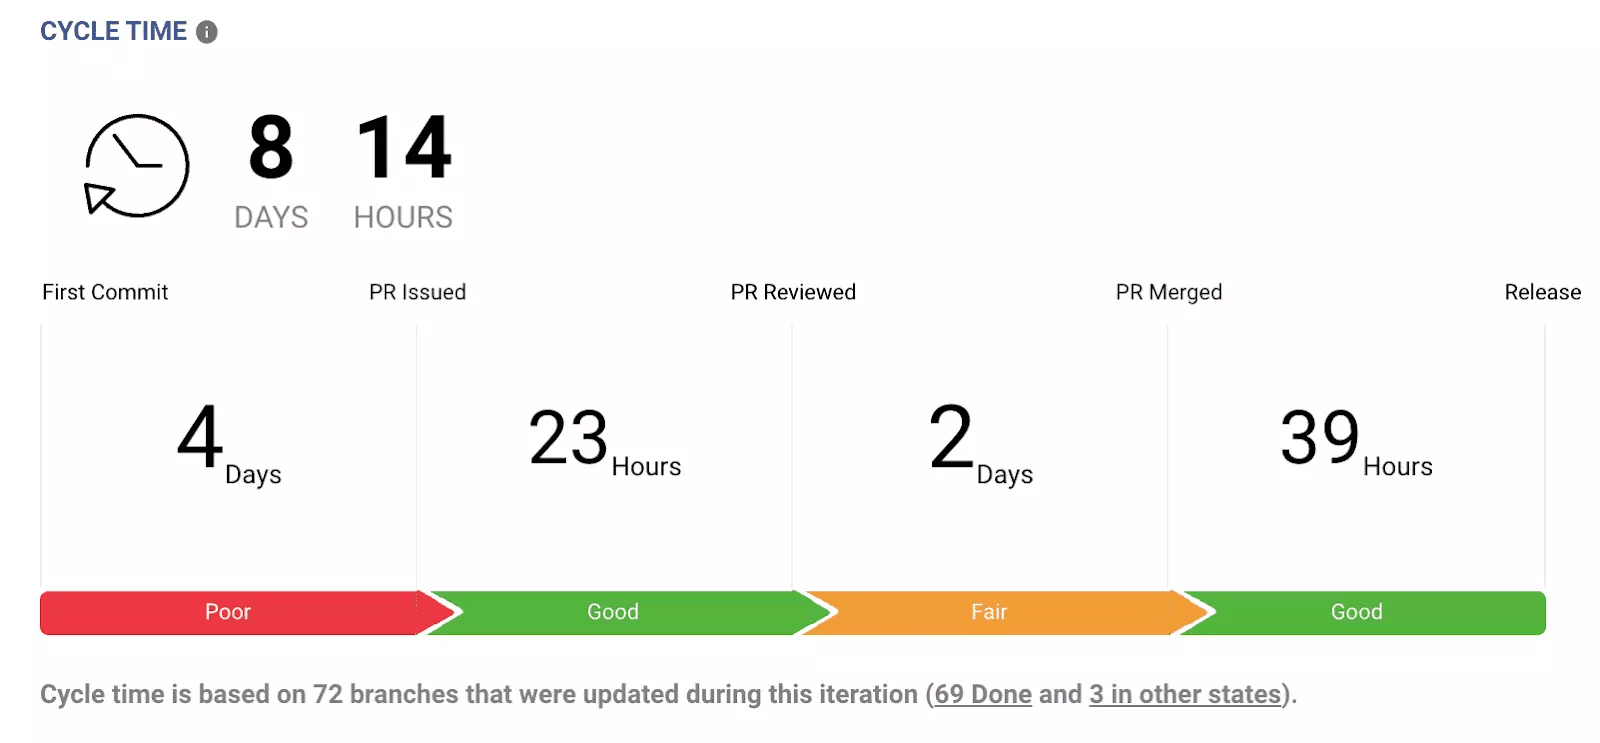
Also, every individual phase of Cycle Time went up: Coding Time is up 47%, PR Pick-Up Time is up 6%, Review Time is up 71% and Release Time is up 58%. You can view the report for definitions of all of these metrics.
Our take on what it means
The combination of higher code throughput and significantly longer average Coding Time points to developers holding their code longer and merging it less often. This is consistent with the other data we’re seeing and it has a cascading effect. Bigger PRs…
- High higher risk for code quality issues
- Are less likely to get a complete peer review
- Which leads to higher churn and change failure rates
- Which leads to more time spent fixing problems
- Which leads to less time working on new value
- All of which can eventually lead to lower customer satisfaction
But why are we holding our code longer? Unlike teams who are releasing less frequently out of some conscious notion of being more cautious, I don’t think individuals are doing it on purpose. We’re at home with fewer distractions and longer periods of time “in the zone” so we are more likely to just keep going.
And I know for me personally, my team holds me accountable to keeping things lean and simple. Without them being around physically to hold me accountable, I sometimes can get excited about solving bigger problems and I can get carried away 🙂
PR Pick-Up Time is only up slightly which I choose to take as a sign that shifting to work-from-home has not caused the average dev to forget about the importance of helping their teammates 🙂
I think there are a couple of things we can take away from the average Review Time being up significantly.
- Collaboration patterns have been disrupted and need to be re-learned.
- Asynchronous communication, for better or worse, takes longer.
To be clear, from what I observe within our own team, I’m not sure more time is being spent on reviews. I just think more time is elapsing before reviews are being marked complete.
Some might say both points are connected and that actually moving towards asynchronous communication is better for dev teams and will lead to deeper code review, more thorough documentation, etc.
For example, before work from home started, we saw a pattern that many reviews started online (async) and then moved offline to a discussion (sync). This pattern is great for solving relatively complex problems quickly but the drawback is often the comments from the offline discussion are never recorded. As a result, the important collective knowledge that lives inside of PR comments is lost.
At LinearB, we encourage both. Get in a room (now get on a Zoom) together and figure it out but capture all of the comments from the review process in the repository. We’re ok with our review times going up a bit if it means the depth and quality are increased.
The increase in Release Time is, again, consistent with the data we already observed. And it highlights an opportunity for some teams to introduce more automation into the process.
One interesting fact that is not in the report… 20% of the teams had very little change in their Release Times. Those teams had a high correlation to short release times (minutes). We can infer safely that those teams have an active CD infrastructure in place. If we remove those teams from the equation, the remaining 80%, who seemingly do not have CD in place, saw their Release Times go up even more than the average increase in the report.
Our take on what it all means
When we look at our own dev team at LinearB since March 8th, we see many similarities to the 50 teams we analyzed in the report:
- Our Cycle Time is up significantly.
- Our Coding Time is up significantly.
- Our Review Time is up.
- Our Code Churn is up.
- Our Deployment Frequency is down.

Here’s how we’re thinking about it and what we’re doing about it.
First, and maybe most importantly, we’re focused on releasing often and keeping our average release size small – just like it was before work-from-home.
We’re re-emphasizing our lean, agile approach and reminding ourselves to break our work into small tasks and to merge as frequently (or more frequently as we did before).
We’re encouraging deeper, more thorough reviews on material PRs to keep code churn down and quality high. Even if it means a slight increase in Review Time and overall Cycle Time.
We’re investing in all kinds of automation and tools that help our devs work better together remotely across both asynchronous and synchronous communications styles.
We’re expecting that our previous culture of being together in the office every day might not return for a long time if ever. So we’re adapting our processes assuming work-from-home is going to be part of the long term fabric of our dev team going forward.
And finally, we’re reviewing the metrics we care about weekly but staying patient and trying to make small, measured changes to our process so our people have time to adapt with the process.
Click here to check out the full 17-page report.
If you want to see how your team has been affected by the shift to remote work, click here to get a free 21 day trial of LinearB. We automatically analyze 90 days of historical data so you can compare your team to the 50 teams from the report.