Measuring software quality by counting lines of code or tracking how many bugs were fixed in a sprint misses the bigger picture.
Quality is no longer any single person's job, it's a continuous, data-informed practice that spans coding, testing, deployment, and developer experience. It’s what separates high-performing engineering teams from those constantly stuck in firefighting mode. When code is reliable, it builds user trust, keeps team velocity sustainable, and empowers teams to innovate confidently.
This guide explores 12 essential software quality metrics that define and quantify quality practices. More importantly we’ll go beyond simplistic code coverage numbers to provide actionable insights across your code health, delivery processes, and user experience.
What Are Software Quality Metrics?
Software quality metrics are quantifiable measurements that evaluate how well software meets specified quality attributes throughout its development lifecycle. These metrics give engineering teams standardized ways to assess code maintainability, reliability, performance, and security.
Software quality metrics can be quantitative, like Mean Time to Recovery (MTTR), or qualitative, like user satisfaction via Net Promoter Scores. Our recommendation is to combine qualitative and quantitative metrics for a complete picture of how software behaves in real-world scenarios and how your team operates under the hood.
A robust quality metrics practice serves multiple purposes:
- Benchmarking performance: Establishing performance baselines that allow teams to measure improvement over time
- Early problem detection: Identifying quality issues before they reach production or customers
- Process refinement: Highlighting inefficiencies in quality focused development workflows
- Objective evaluation: Establishing a feedback mechanism for making process or architectural changes
- Decision support: Creating a regular cadence with stakeholders to discuss investment decisions around testing, refactoring, or tooling
When implemented effectively, software quality metrics turn subjective conversations about quality into concrete, data-backed discussions. They align teams around common goals and create shared accountability for delivering exceptional software.
The 12 Software Quality Metrics You Should Measure
After working with thousands of development teams, we’ve found that quality metrics are most valuable when organized to reflect different areas of your development process. The following framework divides metrics into three categories: workflow and review health, delivery and process efficiency, and customer and experience measurements.
Workflow & Review Health Metrics
These metrics focus on how code is created, reviewed, and maintained, providing early indicators of quality issues before they reach production.
1. Rework Rate
Definition: Rework rate measures the percentage of code that is rewritten or modified within 21 days of being committed. It quantifies how much of your team's work needs to be redone shortly after completion.
Why it matters: A high rework rate indicates underlying quality issues in your development process. It suggests instability in the codebase, unclear requirements, or rushed implementation that doesn't hold up under real-world conditions.
Use case: Rework rate can identify code that's being touched too frequently, whether due to bugs, performance issues, or short-sighted implementation. Teams with rework rates exceeding 15% should investigate their requirements gathering and design processes. Excessive rework often stems from misunderstandings or incomplete specifications.
How to improve it: Implement more thorough design reviews before coding begins, strengthen your code review process, and ensure requirements are clearly defined and validated with stakeholders.
2. PR Maturity
Definition: PR maturity represents the percentage of code that remains unchanged after a pull request is opened. High maturity rates indicate that PRs are well-prepared before review, reducing time spent on back-and-forth changes during the review process.
Why it matters: Mature PRs signal stronger pre-review diligence, fewer reworks, and faster review cycles. They indicate that developers are thinking critically about their code before requesting feedback. However, it’s important to be cautious of extremely high PR maturity (>98%) rates as they might suggest rubber-stamping rather than thorough reviews.
Use case: Track this metric to identify teams submitting inadequately tested code (low maturity) or teams not conducting meaningful code reviews (excessively high maturity). An optimal range usually falls between 85-95% maturity.
How to improve it: Encourage developers to self-review code or use AI code reviews before submitting for a team review, implement pre-commit hooks that run automated checks, and build a culture where PRs are expected to be production-ready when opened.
3. PRs Merged Without Review
Definition: This metric tracks the percentage of pull requests merged without a code review from another team member.
Why it matters: Code that bypasses review represents a significant quality and security risk. A high rate of unreviewed merges indicates bypassing critical quality controls and poor engineering practices.
Use case: This metric is particularly valuable for security posture, compliance requirements, and establishing healthy review culture. In regulated industries or when working with sensitive data, this number should be as close to zero as possible.
How to improve it: Implement branch protection rules that require reviews before merging, establish clear review standards, and create automated workflows that assign reviewers to ensure nothing slips through the cracks.

4. Code Churn
Definition: Code churn measures how frequently code changes after being committed, focusing on modifications that occur within the same feature branch or immediately after merging to main.
Why it matters: High code churn suggests code performance instability, unclear requirements, or constant rethinking of solutions. It often correlates with higher defect rates and increased technical debt.
Use case: This metric complements test coverage by revealing where seemingly well-tested code may still be unstable. You can use churn data to identify problematic code areas that need architectural improvement or better specification.
How to improve it: Invest in more thorough design discussions before implementation, improve requirements gathering, and consider implementing feature flags for controlled introduction of new code.
Delivery & Process Metrics
These metrics focus on how efficiently your team delivers high-quality software and how quickly you recover from issues when they occur.
5. Mean Time to Recovery (MTTR)
Definition: MTTR measures the average time required to restore service after a production failure or incident. It captures your team's ability to diagnose problems, implement solutions, and recover from disruptions.
Why it matters: As one of the four DORA metrics, MTTR reflects your system's resilience and your team's incident response capabilities. Lower MTTR values indicate more efficient troubleshooting processes, an organized codebase, and robust incident management systems.
Use case: This metric helps engineering leaders assess operational readiness and identify gaps in monitoring, alerting, or incident response procedures. It also highlights whether architectural decisions enable or hinder quick recovery.
How to improve it: Invest in comprehensive monitoring, implement automated rollback capabilities, create detailed runbooks for common issues, and conduct regular incident response drills.
6. Lead Time for Changes
Definition: Lead time for changes (aka cycle time) is the total time it takes for a process to move from the start to the final completion, encompassing all activities, delays, and waiting periods. In this case, it measures how long it takes for code to move from initial commit to successful deployment in production. This DORA metric captures the entire software delivery pipeline.

Why it matters: Shorter lead times enable faster feature delivery and bug fixes, allowing teams to respond more quickly to market changes and customer needs. Long lead times often indicate process bottlenecks or inefficient approval systems.
Use case: Use this metric to identify where delays occur in the delivery pipeline—whether in code review, testing, or deployment stages. Teams with lead times exceeding industry benchmarks should examine their CI/CD practices.
How to improve it: Break work into smaller increments, automate testing and deployment, optimize approval workflows, and implement feature flags to decouple deployment from feature release.
7. Deployment Frequency
Definition: Deployment frequency measures how often your team successfully deploys code to production. It reflects your ability to deliver changes in small batches with minimal risk.
Why it matters: This DORA metric indicates your team's agility and CI/CD maturity. Higher deployment frequency typically correlates with smaller, safer changes and greater development velocity.
Use case: This metric helps you assess DevOps maturity and identify teams that may be batching changes too infrequently, increasing release risk. Teams deploying less than weekly should investigate their delivery pipeline for efficiency bottlenecks.
How to improve it: Reduce pull request sizes, improve test automation coverage, adopt feature flags for risk mitigation, and streamline approval processes while maintaining appropriate controls.
8. Change Failure Rate
Definition: Change failure rate measures the percentage of deployments that result in degraded service or require remediation (like hotfixes or rollbacks). It quantifies how often your releases cause problems.
Why it matters: This DORA metric reflects the safety of your deployment process. A high change failure rate indicates inadequate testing, poor quality controls, or insufficient production validation.
Use case: Use this metric to assess whether speed is being prioritized over stability. Teams with change failure rates exceeding 15% should reevaluate their quality gates and deployment practices.
How to improve it: Enhance automated testing coverage, implement progressive deployment strategies, conduct more thorough pull request review strategies, and improve monitoring to catch issues earlier.

Customer & Experience Metrics
These metrics extend beyond code to measure the human impact of your software quality, both for end users and developers.
9. Customer-Reported Bugs
Definition: This metric tracks the number of unique defects reported by customers in a given time period, often normalized by user count or transaction volume, to enable meaningful comparison.
Why it matters: Customer-reported bugs typically represent a quality issue that escaped your testing processes. They directly impact user trust and satisfaction while increasing support costs.
Use case: This metric helps identify gaps in your quality assurance process, especially around edge cases or real-world usage patterns that in-house testing might miss. Tracking the severity and frequency of customer reports provides insights into the effectiveness of your test automation strategy.
How to improve it: Implement more comprehensive test coverage, conduct user acceptance testing with representative personas, analyze patterns in reported issues to identify systematic gaps, and invest in enhanced monitoring to catch issues before users do.
10. User Satisfaction
Definition: User satisfaction measures how positively users perceive your software's quality, reliability, and usability. It's typically captured through surveys, Net Promoter Score (NPS), app store ratings, or product feedback channels.
Why it matters: User perception determines the success of your software. High technical quality metrics mean little if users find the product difficult to use or unreliable.
Use case: This qualitative metric complements technical measurements by capturing the user experience dimension of quality. Engineering and Product leaders should track satisfaction alongside technical metrics to ensure technical priorities align with user needs.
How to improve it: Establish regular feedback loops with users, prioritize fixes for issues that most impact satisfaction, conduct usability testing, and implement feature usage analytics to understand which capabilities deliver the most value.
11. Developer Satisfaction
Definition: Developer satisfaction captures how positively your engineering team feels about working with the codebase, tools, and processes. It's typically measured through anonymous surveys focused on the developer experience.
Why it matters: Developer satisfaction serves as a leading indicator of long-term quality and retention. Teams frustrated by poor tooling, fragile code, or burdensome processes are less likely to produce high-quality software or remain with the organization.
Use case: Identify friction points in the development process that may not be visible through purely technical measurements. Declining satisfaction often precedes quality issues or team attrition.
How to improve it: Invest in developer tooling, allocate time for technical debt reduction, streamline cumbersome processes, and foster a culture that values sustainable development practices.
12. Time Spent on Maintenance vs. Innovation
Definition: This metric tracks the ratio of engineering hours spent maintaining existing code (fixing bugs, addressing technical debt) versus building new features or capabilities.
Why it matters: A high maintenance-to-innovation ratio indicates that quality issues are consuming resources that could otherwise drive business value. It directly impacts your ability to innovate and compete.
Use case: Use this metric to demonstrate the business impact of technical debt and quality issues. Teams spending more than 40% of their time on maintenance should consider focused quality improvement initiatives.
How to improve it: Implement proactive technical debt management, improve automated testing coverage, adopt more rigorous code review practices, and periodically dedicate sprints to refactoring problematic areas.

How to Choose the Right Software Quality Metrics for Your Team
There’s no one-size-fits-all dashboard when it comes to software quality. The right metrics for your team depend on what you build, how you ship, and what outcomes you’re driving toward.
Here’s how you can tailor their approach:
1. Align Metrics with Team Type
Not every metric applies equally across infrastructure, platform, and product teams. For example:
- Infrastructure teams should prioritize MTTR, change failure rate, and deployment frequency to ensure uptime and service stability.
- Platform engineering teams may track rework rate, code churn, and developer satisfaction to improve internal tooling and reduce friction.
- Product teams will focus on lead time, user satisfaction, and customer-reported bugs to measure release effectiveness and usability.
Choosing the right metrics means understanding what success looks like for each team and how quality manifests differently across domains.
2. Avoid Vanity Metrics
Metrics like “lines of code written” or “number of commits” might look productive on the surface, but they rarely reflect true value delivery. These vanity metrics can be gamed easily and often incentivize the wrong behaviors.
Instead, focus on leading indicators of quality (e.g., PR maturity, review depth) and outcome-driven metrics (e.g., customer bug reports, deployment stability).
3. Tie Metrics to Business Impact
The most compelling quality metrics directly connect to business outcomes:
Reliability impacts: Calculate the cost of outages or defects in terms of lost revenue, support costs, or customer churn.
Speed advantages: Measure how lead time and deployment frequency improvements enable faster market response and competitive advantage.
User happiness drivers: Track how quality improvements correlate with user retention, expansion, and advocacy.
By tying quality metrics to these tangible business impacts, you can better advocate for quality initiatives and necessary infrastructure investments.
Using Developer Experience to Support Software Quality
You can’t sustain software quality without supporting your developers, and that’s where Developer Experience (DevEx) comes in. DevEx metrics like survey sentiment, WIP limits, and tool friction complement software quality metrics by revealing the environmental and cultural factors behind your metrics.
How DevEx and Quality Metrics Work Together
- If rework rates are high and PR maturity is low, survey your developers. Are they under pressure to rush features? Are they unclear on requirements?
- If deployment frequency is low and cycle time is long, check DevEx signals. Are teams bogged down by flaky tests or manual release steps?
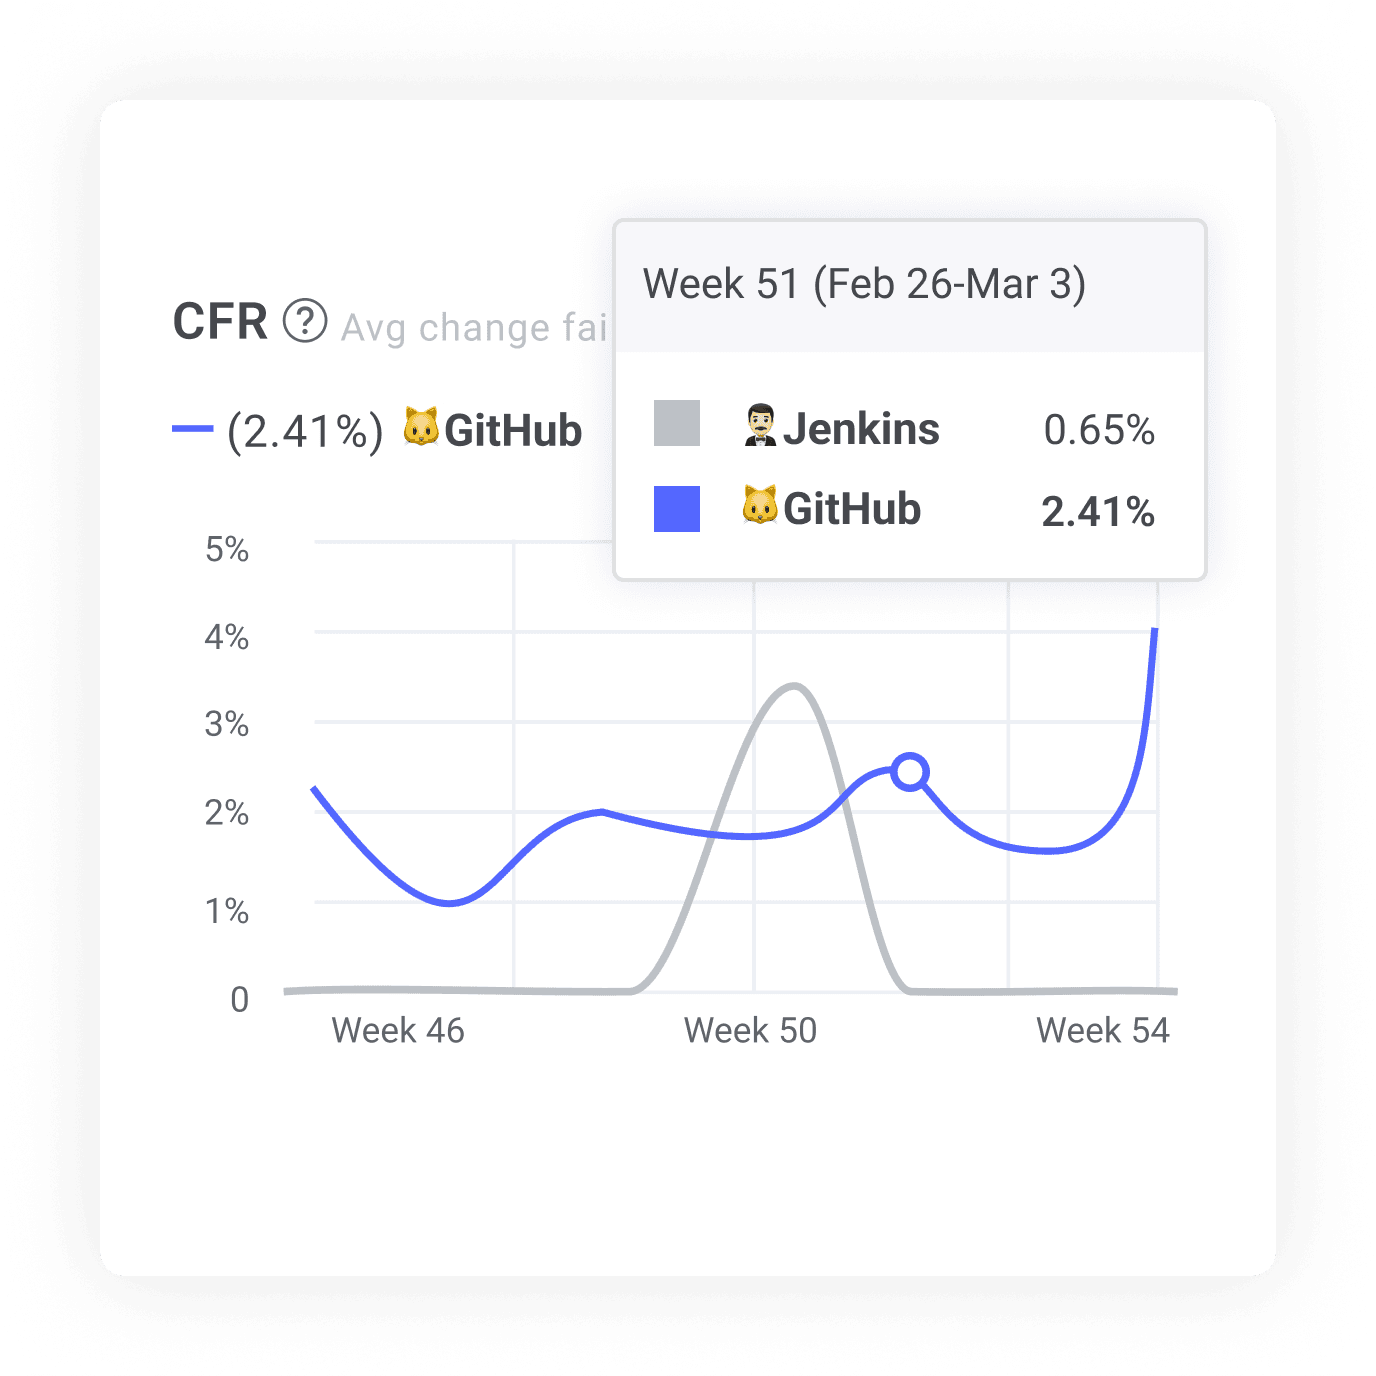
- If CFR is rising, ask about burnout. Are developers struggling with unclear priorities or brittle code?
Combining DORA metrics, DevEx insights, and customer feedback gives you a full-spectrum view of quality that includes both delivery outputs and the human factors behind them.
How Software Engineering Intelligence Supports Code Quality
Traditional approaches to measuring software quality often fall short because they rely on disconnected tools, manual data collection, and delayed feedback loops. Software Engineering Intelligence (SEI) platforms address these limitations by providing a comprehensive, automated approach to quality measurement and improvement.
Unified Data Collection & Analysis
SEI platforms integrate with your entire development ecosystem, from git repositories and CI/CD pipelines to issue trackers and incident management tools. These integrations enable:
- Automated metric calculation: Eliminating manual tracking and ensuring consistent measurement
- Cross-system correlation: Connecting code changes to user-facing outcomes
- Historical trending: Identifying gradual quality deterioration that might otherwise go unnoticed
- Team-level insights: Breaking down metrics by team, repository, or product area
These capabilities transform quality measurement from a periodic, labor-intensive exercise into a continuous, real-time feedback mechanism.
Workflow Automation & Guardrails
Beyond measurement, advanced SEI platforms enable proactive quality improvement through:
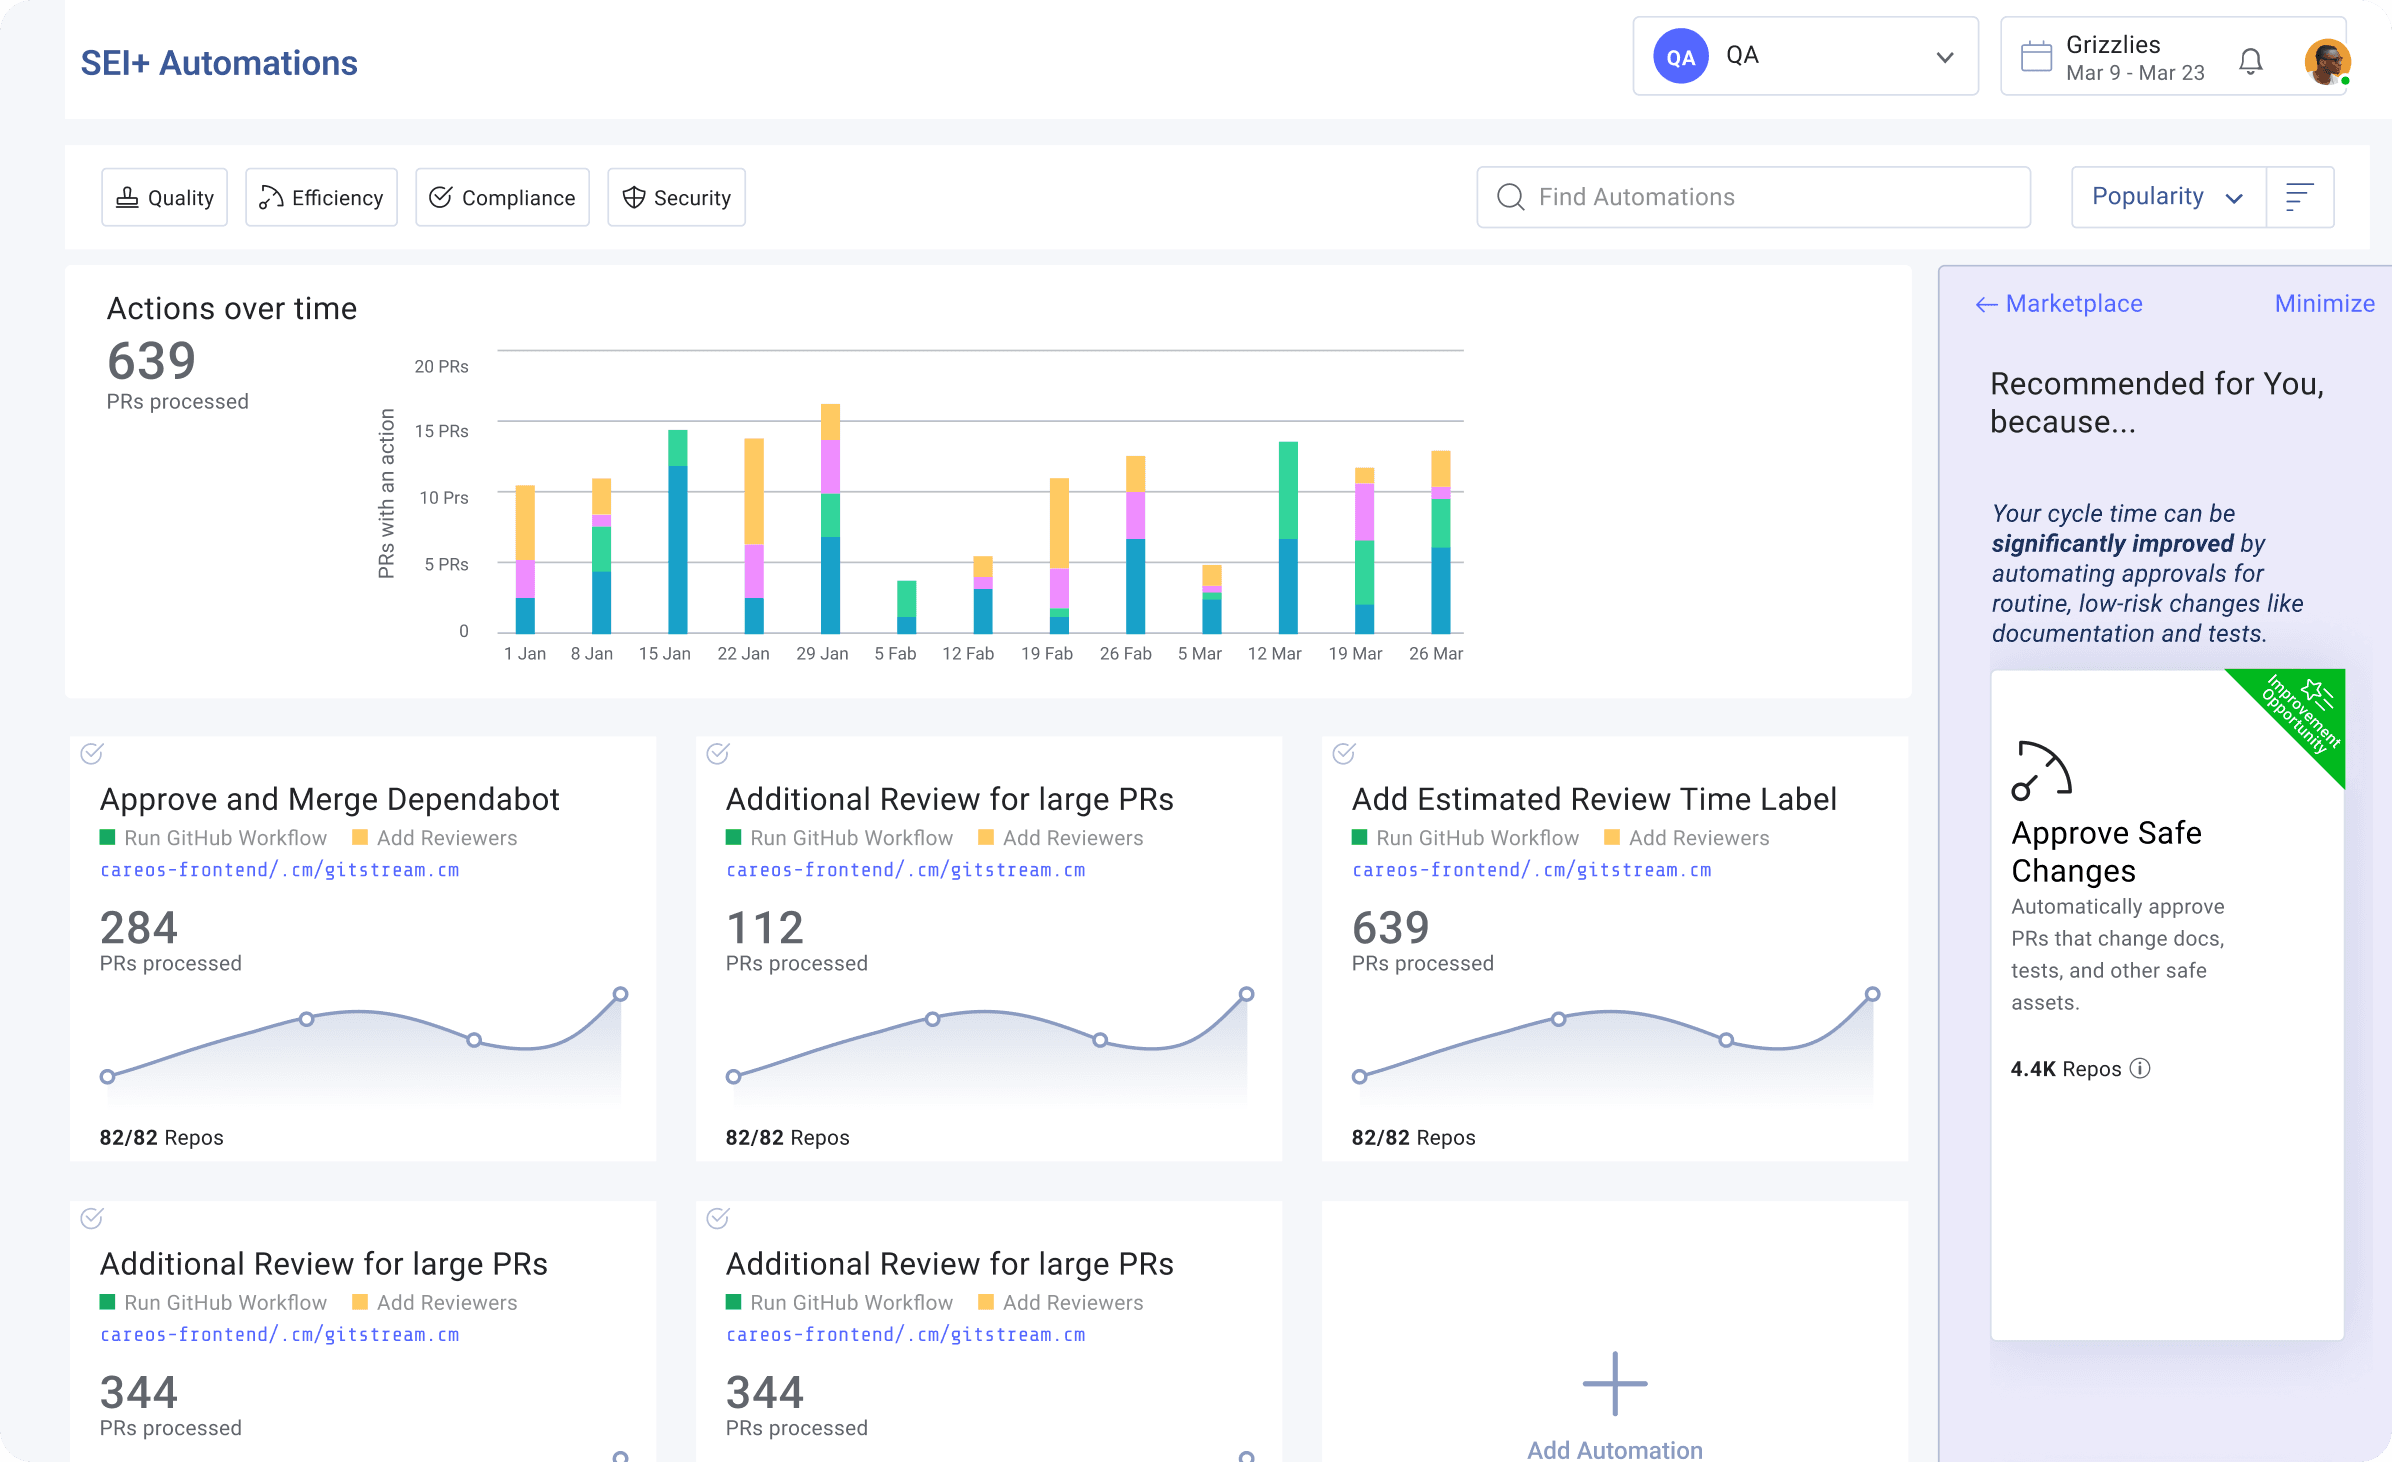
- Automated code review assignments: Ensuring appropriate expertise reviews critical changes
- PR size limits: Flagging excessively large changes that correlate with higher defect rates
- Merge readiness checks: Verifying that quality gates are met before code reaches production
- Review SLA monitoring: Preventing critical changes from languishing in review queues
These automated guardrails prevent quality issues rather than just measuring them after the fact.

Actionable Insights & Recommendations
The most sophisticated SEI platforms don't just present data—they provide actionable insights:
- Bottleneck identification: Pinpointing specific stages in your workflow that delay delivery
- Anomaly detection: Flagging unusual patterns that may indicate emerging quality issues
- Comparative benchmarks: Showing how your metrics compare to industry standards
- Predictive analytics: Forecasting quality trends based on historical patterns
These insights help you prioritize quality initiatives that will have the greatest impact on overall system health and reliability.
Continuous Improvement Loops
SEI creates a virtuous cycle of quality improvement by:
- Establishing baseline quality metrics across dimensions
- Identifying the highest-impact improvement opportunities
- Implementing targeted process changes or tooling improvements
- Measuring the impact of these changes in real time
- Refining approaches based on observed outcomes
This data-driven approach transforms quality from a subjective concern into a measurable, improvable aspect of engineering performance.
By implementing a comprehensive Software Engineering Intelligence program, you can drive substantial improvements across all 12 quality metrics while fostering a culture of continuous improvement.
Want to Measure Software Quality Metrics Automatically?
Implementing a comprehensive quality metrics program manually requires significant effort and often yields inconsistent results. LinearB's Engineering Productivity platform automates the collection, analysis, and visualization of these metrics across your entire engineering organization.
With LinearB, you can:
- Track all 12 essential quality metrics with real-time dashboards customized for each team
- Identify bottlenecks and quality risks before they impact customers
- Benchmark your performance against industry standards and similar organizations
- Drive continuous improvement with automated workflows and recommendations
Start measuring what actually matters. See how your team scores across these 12 metrics with a personalized demo.
FAQ: Software Quality Metrics Explained
What are the 5 views of software quality?
The five perspectives on software quality provide different lenses through which to evaluate your software:
- Transcendental View – Quality is recognized through experience but difficult to define precisely. It's the intuitive sense that code is "clean" or a system is "elegant," often recognized by experienced developers.
- Product-Based View – Quality is tied to measurable product characteristics like defect density, performance metrics, or security vulnerabilities. This view focuses on the quantifiable attributes of the final product.
- User-Based View – Quality depends on how well the product meets user needs and expectations. This perspective prioritizes usability, user satisfaction, and the ability to fulfill functional requirements.
- Manufacturing View – Quality is defined by conformance to development process standards and specifications. This view emphasizes consistency, repeatability, and adherence to established engineering practices.
- Value-Based View – Quality is determined by the balance between cost, time, and the product's ability to meet stakeholder goals. This perspective recognizes that quality assessments vary depending on business priorities.
Understanding these different perspectives helps you develop a more comprehensive quality strategy that addresses technical excellence, user satisfaction, and business value.
Why are software quality metrics important?
Software quality metrics are critical because they transform abstract quality discussions into concrete, actionable insights. They help teams:
- Predict issues before they impact users by identifying problematic patterns in development workflows
- Make objective decisions about architectural changes, technical debt remediation, and process improvements
- Align teams around common definitions of quality and success criteria
- Demonstrate value to business stakeholders by connecting technical improvements to customer outcomes
- Balance competing priorities between speed, stability, and cost
Without meaningful metrics, engineering teams often struggle to prioritize quality initiatives or demonstrate their impact, leading to reactive approaches focused on firefighting rather than proactive quality management.
What are some examples of good software quality metrics?
Some of the most valuable software quality metrics include:
- Mean Time to Recovery (MTTR) — Average time required to restore service after a production failure
- Lead Time for Change — Time from code commit to successful production deployment
- Deployment Frequency — How often you successfully deploy code to production
- Change Failure Rate — Percentage of deployments requiring remediation
- Rework Rate — Percentage of code rewritten shortly after being committed
- PR Maturity — Percentage of code unchanged after PR is opened
- Customer-Reported Bugs — Number of unique defects reported by customers
- Developer Satisfaction — How positively your team feels about code and processes
These metrics provide a balanced view of technical quality, process efficiency, and human factors influencing software quality.


