There are a lot of software development metrics to keep track of, and it can take hours, if not days, to create reports that showcase how your engineering team is doing.
Based on much of the research we have performed ourselves—alongside industry experts, such as the team at DORA—we recommend you focus on cycle time (aka lead time for changes).
Maybe this is a bold statement, but we’d argue that cycle time is the most important metric to track. It will tell you a lot about how well your teams and developers are performing and their efficiency.
In this article, we will discuss what cycle time is, why it's important, how to measure it, and what you can do to improve.
What is Cycle Time?
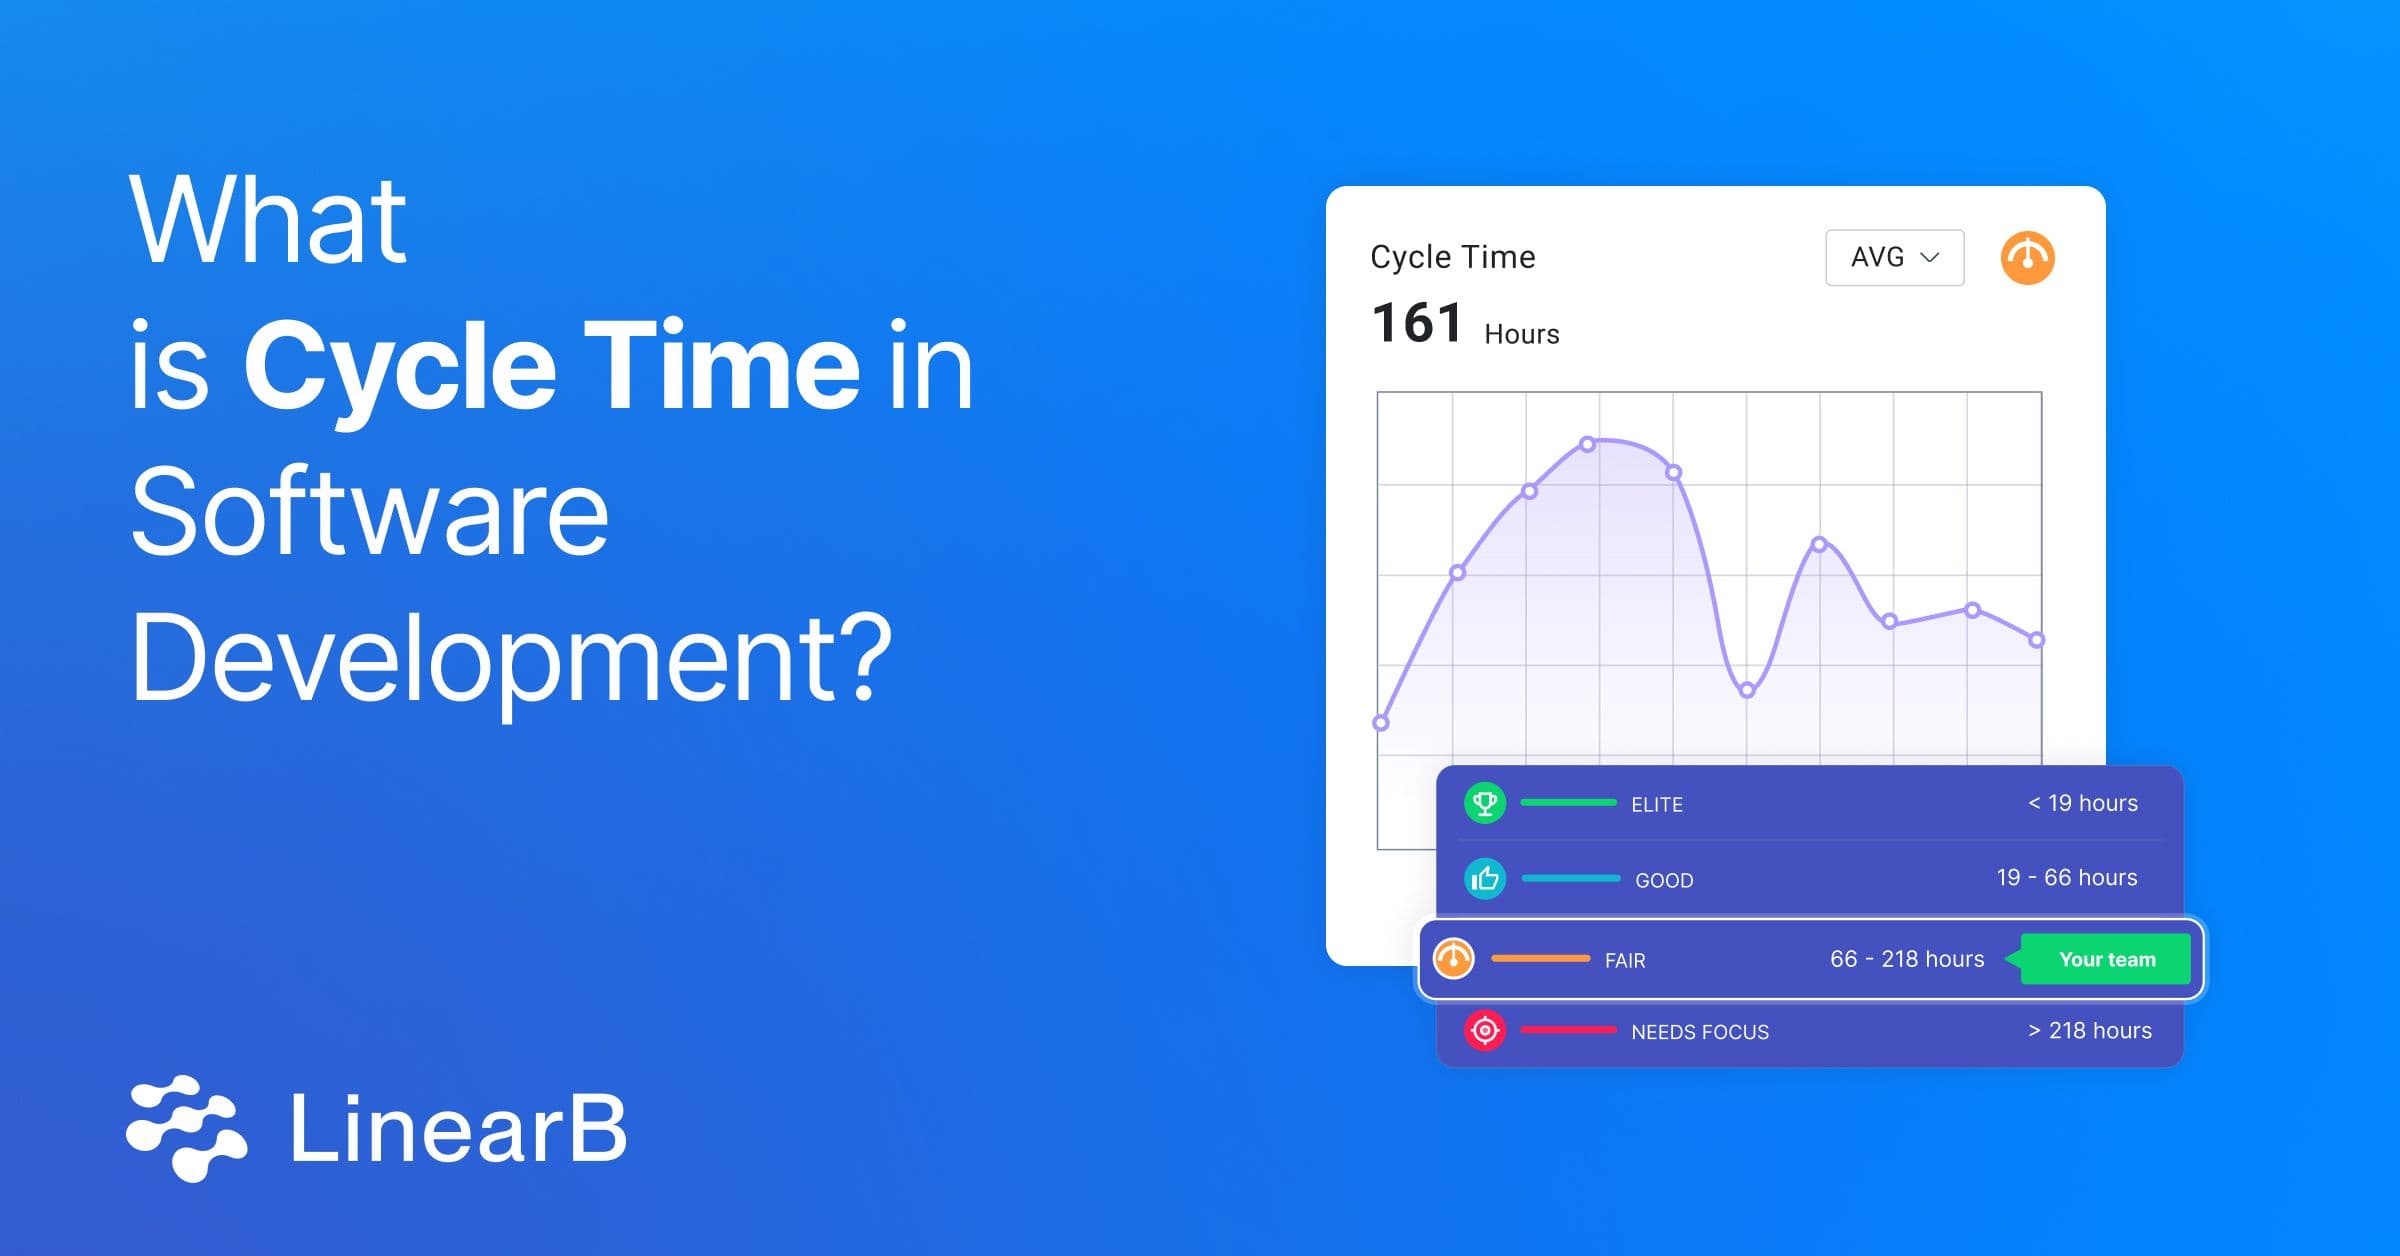
Cycle time in software development is the time from first commit to production release. It is a metric borrowed from lean manufacturing, and it is one of the most important metrics for software development teams. In plain speak, cycle time measures the amount of time from work started to work delivered.
How to Measure Cycle Time
Some engineering leaders try to measure cycle time using Jira or other project management tools. This method is manual and time-consuming, and it relies on good data hygiene. Most leaders, however, lack visibility and understanding of their team’s cycle time.
LinearB instantly measures cycle time for your organization and each development team using your Git provider. And we provide real-time reporting, benchmarks against industry standards, and bottleneck detection.
We divide cycle time into four different phases: coding time, pickup time, review time, and deploy time. Let's take a closer look at what goes into calculating cycle time:
- Coding Time: We calculate coding time from first commit to when a pull request or merge request is created.
- Pickup Time: We calculate pickup time from when the PR is created to when the review begins.
- Review Time: We calculate review time from the start of the review to when the code is merged.
- Deploy Time: We calculate deploy time from when the code is merged to when it is released.
The next step is to examine the phases of your cycle time from many angles, such as at the organizational level, the team level, the iteration level, and even the branch level.
For instance, if this iteration's average review time is 40 hours, you'll want to identify which particular branches are taking longer than usual so you can work with your team to eliminate the causes of the delay.

Why Cycle Time is Important
Shorter cycle times indicate an optimized process and faster time to market. Shorter cycle times for software teams lead to increased revenue, high customer renewal rates, and a happy, efficient dev team.
Longer cycle times indicate inefficiencies in the process and slower time to market. Longer cycle times for software teams lead to delivery delays for customers, lost prospects, and an unhappy, inefficient dev team.
Here are some of the impacts of a long cycle time from the bottom of your organization to the top:
Poor Developer Experience
At LinearB, this is how we define Developer Experience (DevEx): A development team’s overall morale and engagement when interacting with their organization's tools, processes, and environments.
Developers wait on average four days for a pull request review. That's a lot of idle time. And it turns out idle time, particularly in the cycle time process, is a Developer Productivity killer.
Every hour that passes after devs open a new PR increases the cognitive load required to revisit that code. If they get questions or a request for changes a day or two later, it’s tough to get back into the flow state they were in initially. We call this the PR Paradox.
Developers feel the most satisfaction when they can merge code to the trunk, or better yet get it deployed. It is extremely frustrating to have your work blocked for days without review. Developer happiness and satisfaction is always based on solving interesting problems, helping others, and shipping code.
Want to learn about the effects of Bots on your team’s Developer Experience and Productivity?
Watch this hands-on workshop to discover insights like:
- 54% of bot PRs are deleted without action
- 96.18% of all bot-created PRs are not linked to a PM tool
- 12.27 days is the average vulnerability time for bot-created PRs

High Code Churn
Your team is already reworking more than 15% of the code they released last month. And our research shows that PR size is the culprit.
The average PR size is more than 400 lines of changes. Large PRs affect everything from review depth to cycle time and ultimately code churn and planning accuracy.
Don’t expect your devs to willingly shift focus away from their own code to review 400+ lines of changes for someone else. So large PRs often cause major bottlenecks in the pickup time and review time phases of cycle time.
Missed Deadlines
Your CEO doesn’t trust your status reports and roadmap updates. The industry average for planning accuracy is below 50%. That means that you and your team leads are wrong more than you’re right.
As mentioned above, large PRs can bottleneck your cycle time. But even worse, when your devs are just trying to get code merged, large PRs often result in superficial “LGTM” reviews. This introduces poor quality code into the codebase that frequency has to be reworked when you least expect it.
For you and your team leads, this code churn impacts your ability to predict what your team can deliver each sprint accurately.
How to Improve Software Development Cycle Time
So now that you’re confidently tracking cycle time and all 4 phases, what can you do to make the cycle time of your engineering org more consistent and efficient? How can you reap the rewards of good developer experience, efficiency, predictability and delivering on your promises to the business?
Follow our recipe to improve your developer productivity:
1. Benchmark Your Cycle Time & Identify Areas That Need Focus
We don’t just provide you with real-time cycle time calculation and breakdown. We help you benchmark your cycle time and cycle time phases against industry standards.
We studied nearly 3,000 dev teams and discovered that the average cycle time is about 7 days. But like I mentioned above, the PR on average sits in the review process for 4 out of the 7 days. That’s a bottleneck!
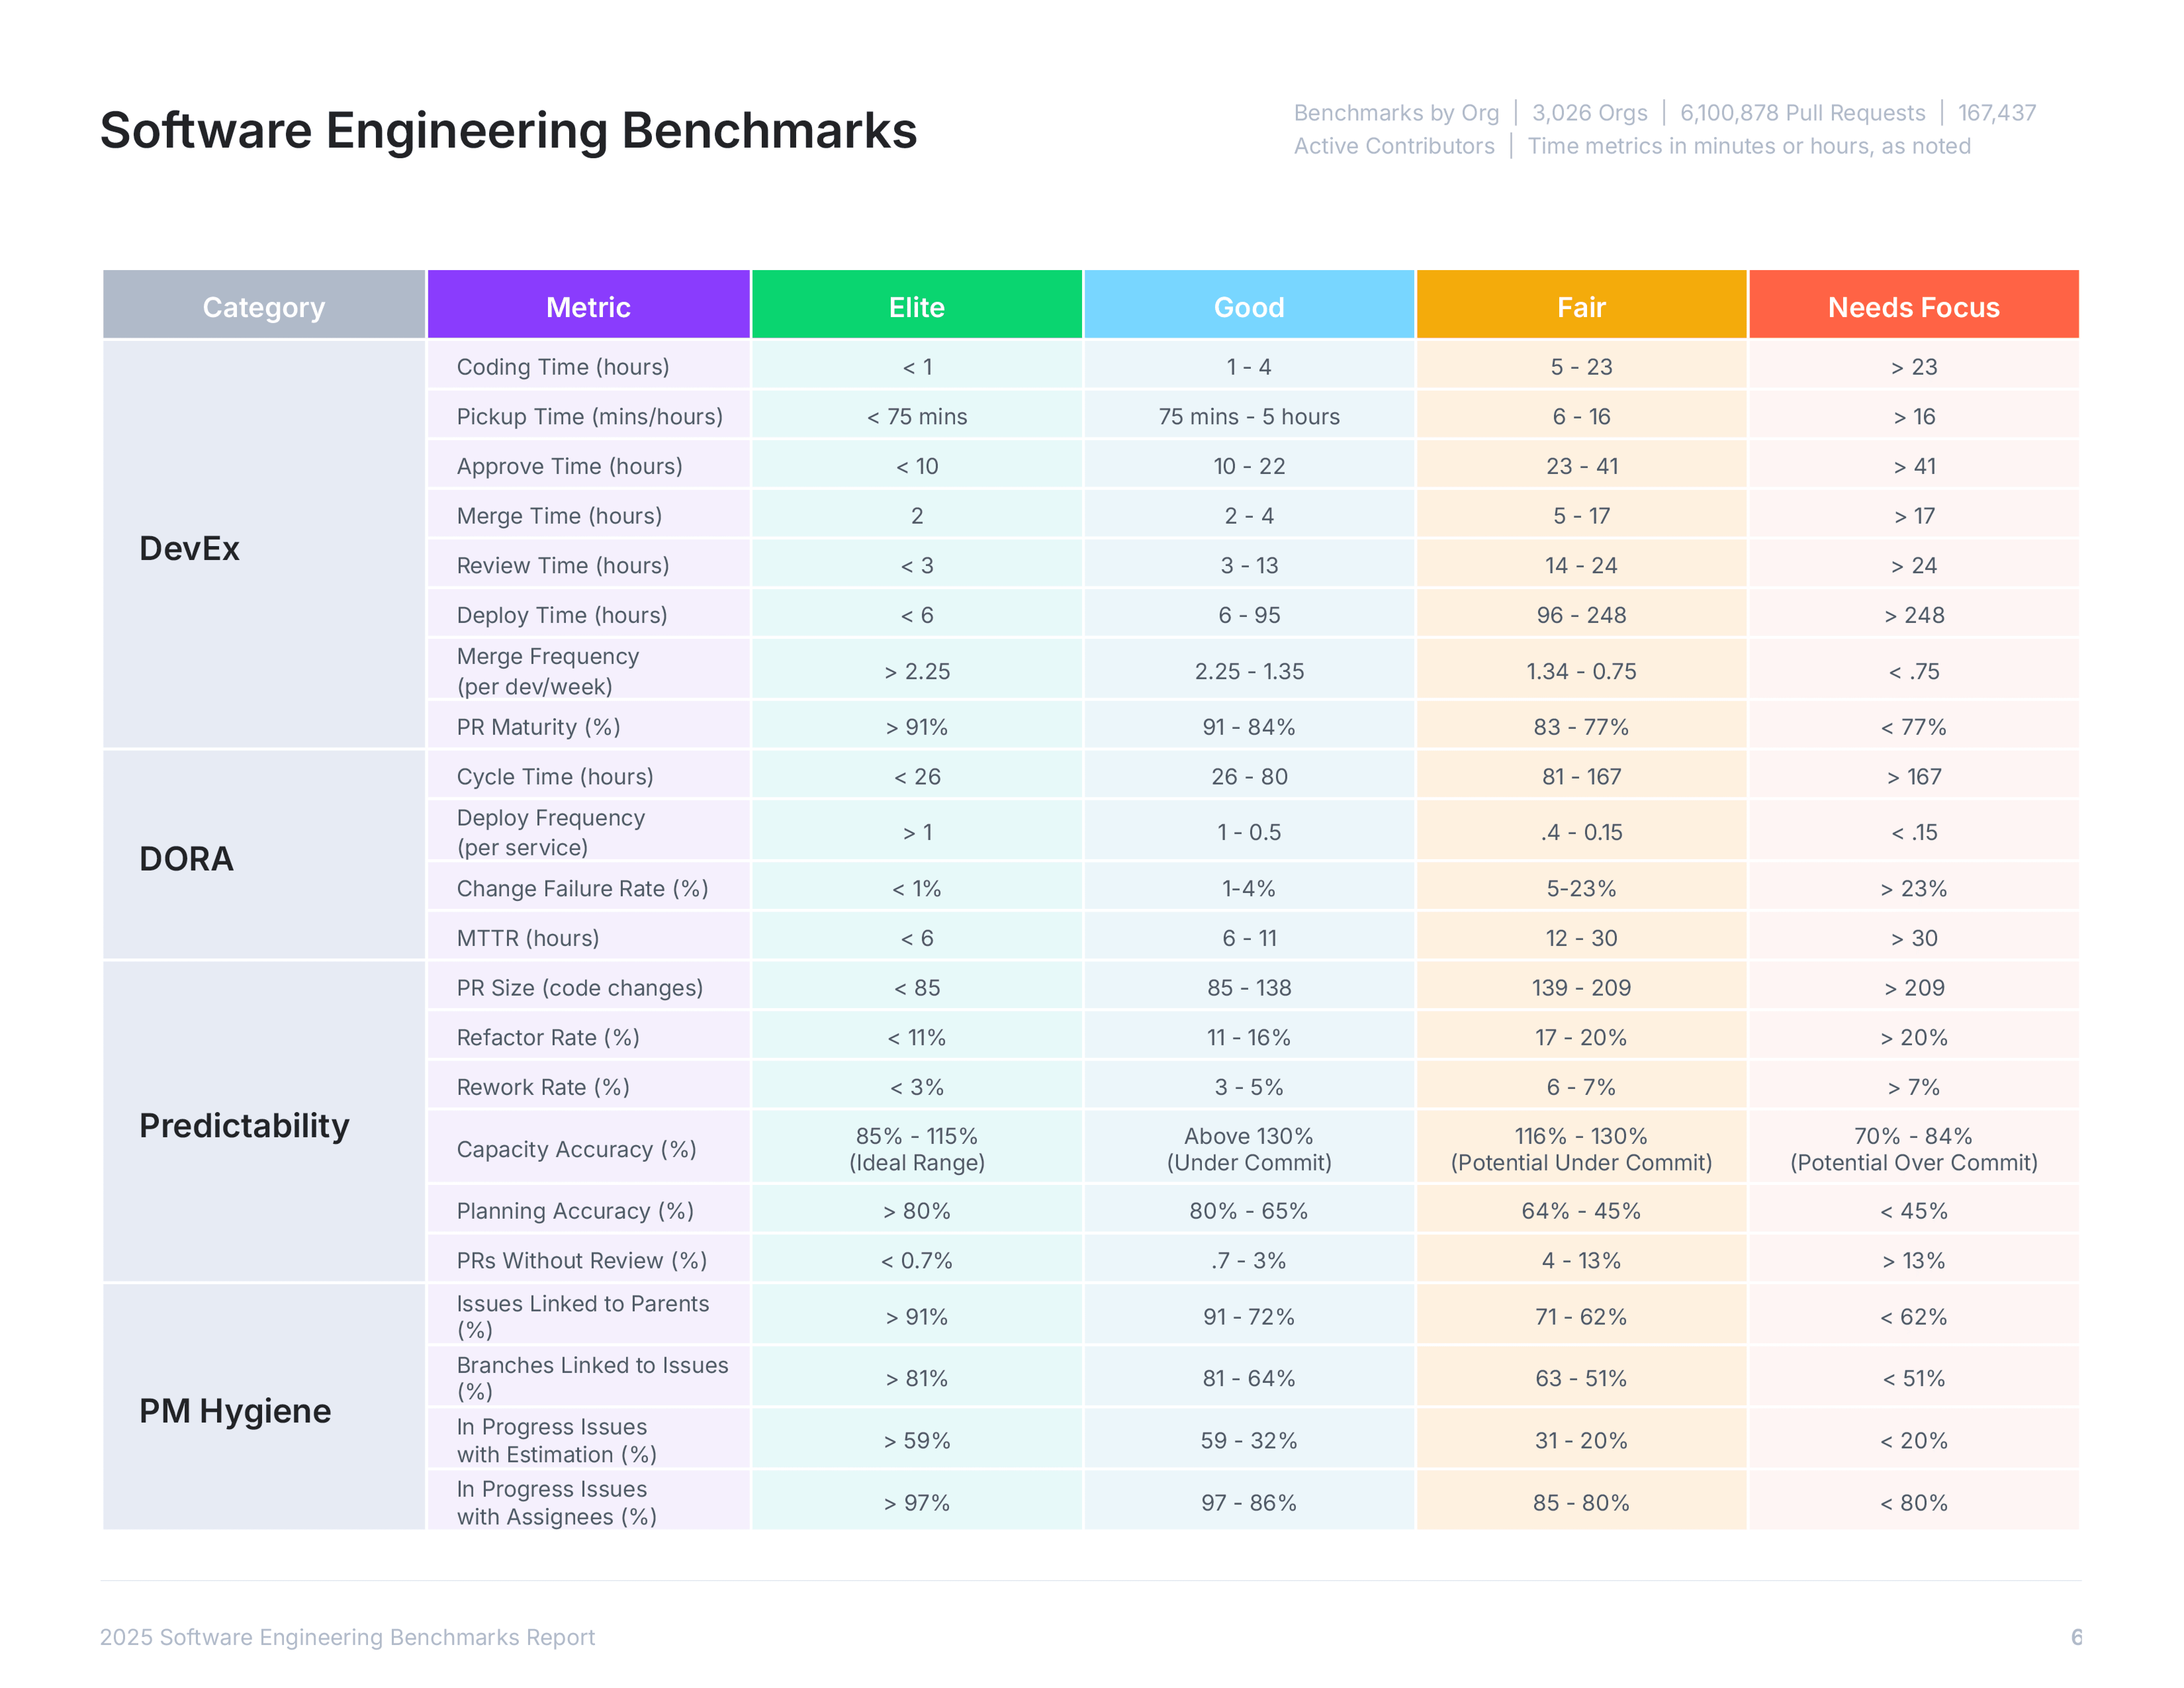
Find out how your team stacks up in the 2025 Software Engineering Benchmarks Report!
Once you’ve benchmarked your cycle time and all four phases, you’ll have identified the area(s) that are causing bottlenecks and need focus. Then everyone in your organization can align on how to effectively reduce cycle time.
2. Set Team Goals to Improve Each Sprint
A common pitfall when attempting to improve processes is a lack of communication and alignment. Initiatives and goals won’t succeed if the team isn’t aware, aligned, and accepting.
We recommend you focus on one or two bottlenecks at a time—PR size and review time, for example—and build your improvement plan around them.
Bring data for past performance to your next retro and align the team. Give them context into performance by using the engineering benchmarks. Then set goals to improve one tier over the next 2-3 iterations (e.g. from “Fair” to “Strong”).
We also recommend you come up with a cadence for checking in on progress. For example, you could repurpose an existing ceremony or set time aside specifically for goals.
LinearB’s Team Goals dashboard also automates the overhead of goal tracking. No more time wasted on spreadsheets and manually generating reports.
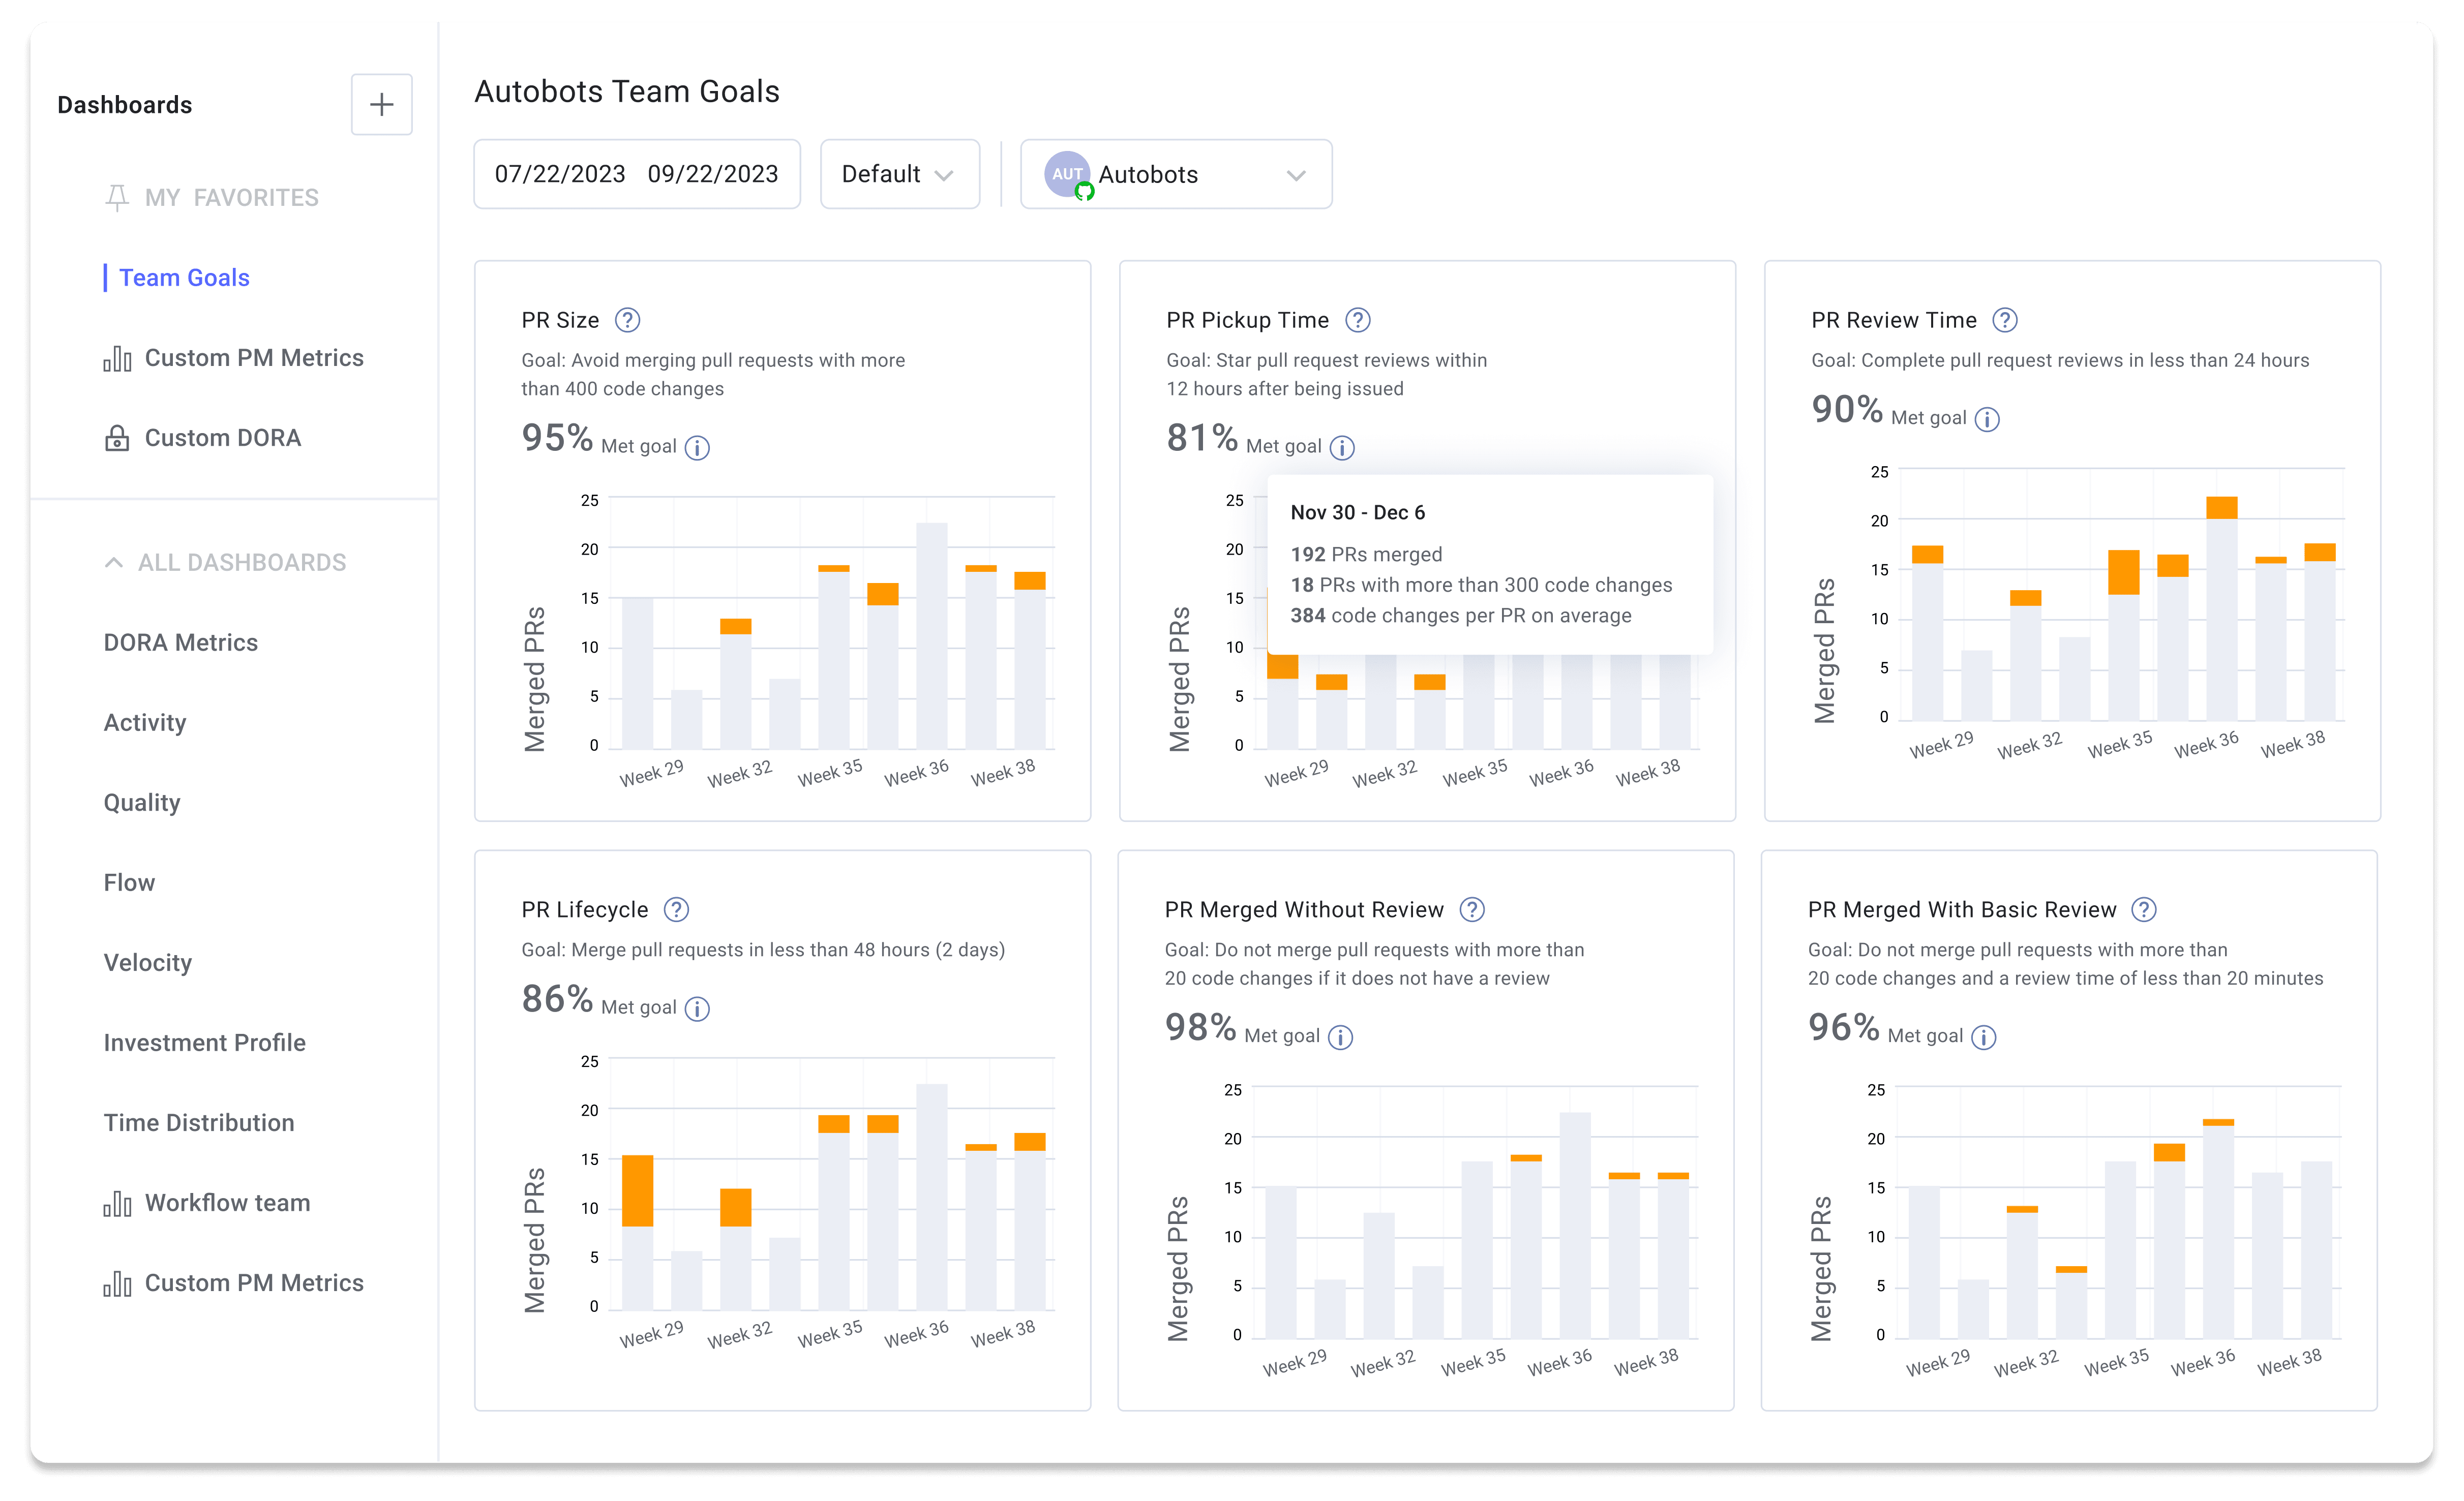
Ultimately, you know your team better than we do. Come up with your definition of improvement based on your current performance, priorities, objectives, and what’s realistic. Then use Team Goals to decide how your team wants to work and where they want to improve every sprint.
3. Automate Continuous Improvement with WorkerB
WorkerB, our developer workflow bot, decreases cycle time by using Slack and MS Teams to help devs navigate a growing PR queue.
Now instead of basic Git alerts, “You’ve been assigned this PR to review,” your team can view:
- Estimated review time*
- Associated project issue
- The PR owner
* based on a proprietary learning algorithm
These pieces of information empower the developer to make better decisions. They answer questions like: Do I have enough time for this review during my next small break or should I queue it? Is this a priority project? Do I owe this person a favor?
Additionally, our newest WorkerB feature routes PRs with <5 lines of changes for immediate review and approval. It takes a snapshot of your PR changes and sends them via DM to the assigned reviewer so they can approve almost instantly. Your devs don’t have to switch between Slack and MS Teams and their Git provider.
Get Started Improving Your Cycle Time
The most successful teams are those who have mastered the coding-to-deployment process start to finish and can consistently deliver new value to customers.
Measuring your development workflow with LinearB's Engineering Benchmarks and automating improvement with Team Goals and our WorkerB bot will help your team build and ship features faster while increasing developer experience and quality.
We'd be happy to showcase how LinearB can benefit your developer productivity. Book a demo today or get started with a free trial.
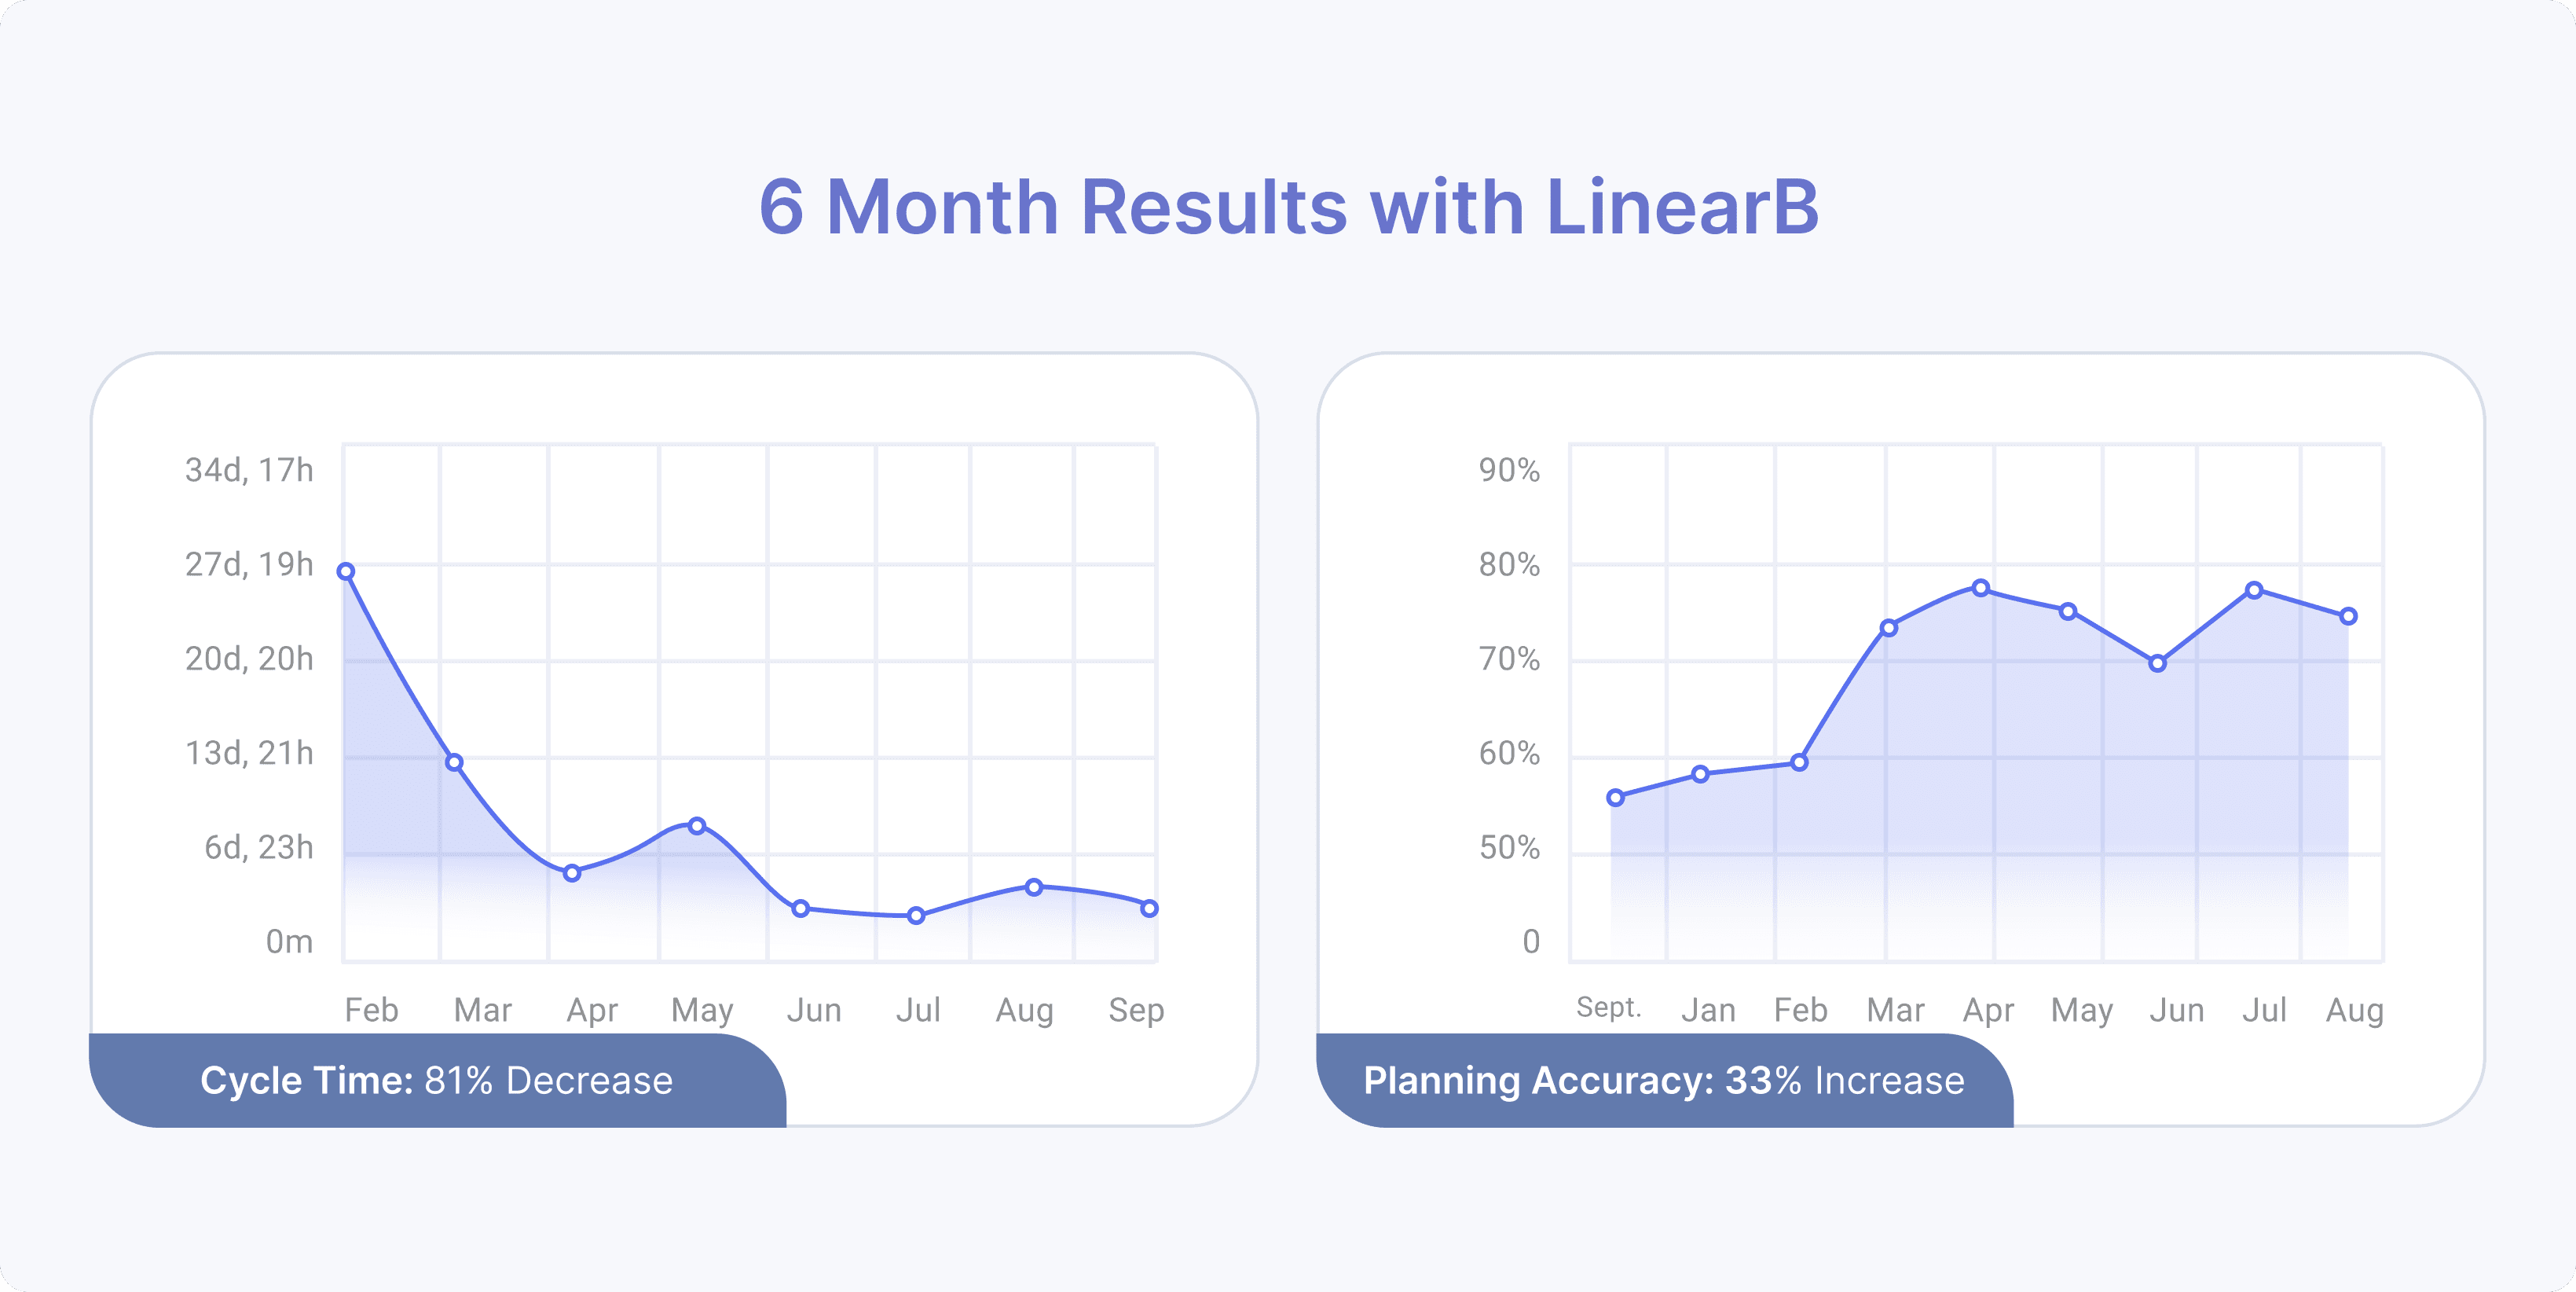
But don’t just take our word for it - learn more about improving your cycle time by checking out how our customer Syngenta reduced their cycle time by 81%.
