This is the first installment of our Cycle Time Breakdown series on the most effective tactics to speed up your development cycle time. The other posts are:
- Tactics For Reducing Coding Time ← You are here
- Tactics For Reducing Pull Request Pickup Time
- Tactics For Reducing PR Review Time
- Tactics For Reducing Deploy Time
In this piece, we’ll look at the first part of a development cycle: Coding Time.
It’s an issue we’ve all encountered, whether as an individual contributor or an engineering manager: It’s taking too long to write code. Until the code is written, it can’t be reviewed, iterated upon, and merged into production.
In this post, we’re going to look at actionable tactics you can use to reduce coding time and speed up your overall Cycle Time. In future posts, we’ll look at how to reduce Pull Request Pickup Time and Pull Request Review Time.
Table of Contents
- What is Coding Time?
- What’s the Cause of High Coding Time?
- Investigating high Coding Time With LinearB
- Preventing high Coding Time
- Conclusion
What is Coding Time?
Cycle time is the dev manager’s super metric. So naturally, the conscientious dev manager will want to pay close attention to coding time, the very first segment of a project’s journey along the cycle time path.
Coding time is defined as the time between the first commit made to a branch to when a pull request is submitted. LinearB analyzed data from almost 2,000 teams and over 847,000 branches to establish benchmarks for key engineering metrics, including coding time.
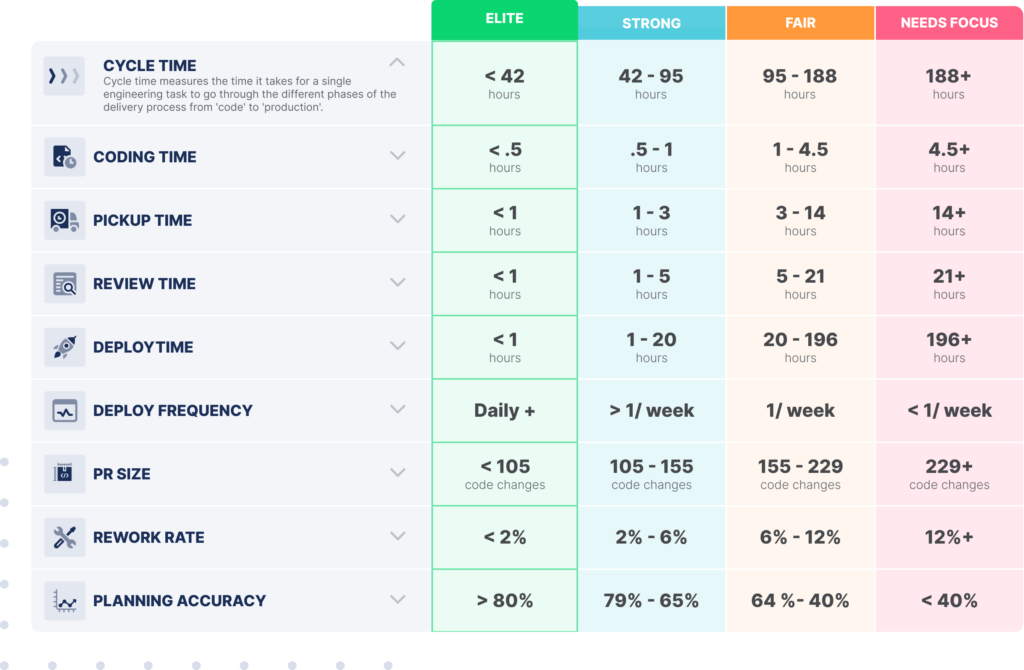
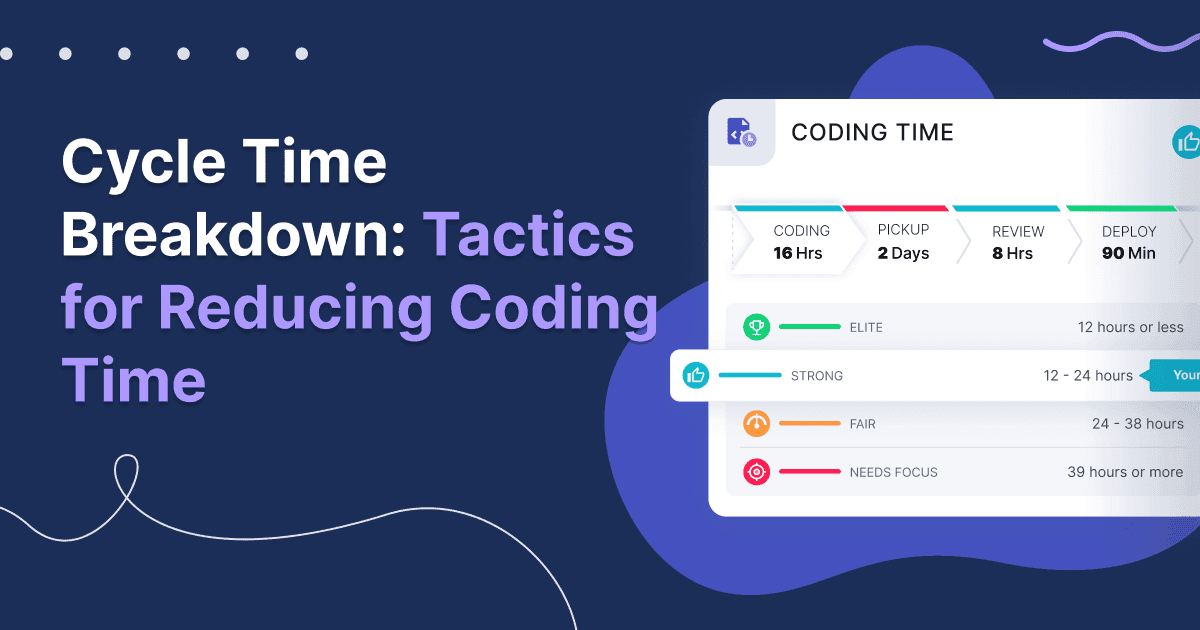
For the purposes of this post, we’re most interested in the coding time row. Elite teams spend less than 12 hours coding. In practice, this means that whatever they start, they finish by end of day. To be honest, this a remarkable feat.
Most teams take between 12 and 38, which accords with my experiences. Anything over 39 (so anything over about 2 full days) is cause for concern.
In the past, we could measure the notion of coding time only anecdotally. Perhaps you could keep track of how the coding on a project was going by the reports in a daily standup.
However, these days, engineering leads are increasingly data-driven. LinearB is making it possible to track Coding Time. By integrating with Git and project management tools, like GitHub, GitLab, and Jira, we can create specific and easy-to-read cycle time breakdowns for all your projects.
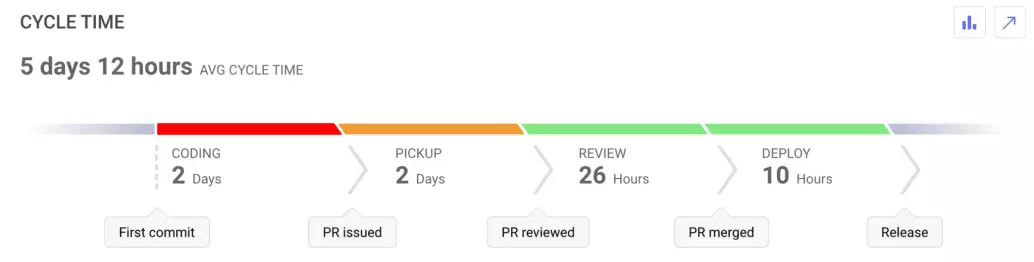
In this example, you can see that coding time is turning red. This means it needs focus. Pickup time is orange, so it could be improved as well. Review time and Deploy time are green and healthy.
In a glance, you can see where there is room for improvement and start taking action to remove bottlenecks and improve cycle time. LinearB automatically tracks any changes, updating the chart in real-time, so you can see instantly whether your efforts are paying off. With our free plan, getting started is not only easy, but it’s free!
What’s the Cause of High Coding Time?
Now that we understand the importance of coding time, and the importance of measuring it precisely, let’s look at why high coding time arises in the first place.
There are three main causes:
- The task is too large
- The task is too difficult
- The task is languishing
1. The task is too large
This is probably the most common reason that devs spend too much time coding up one particular task: The task is simply too big to complete in one delta. In other words, the developer bit off more than they can chew.
Commit small, commit often. This is the mantra of modern software engineering teams, especially those working on web apps in a CI/CD paradigm. It is better to have many smaller deltas that are precisely scoped than one large delta that contains many changes.
Another benefit of smaller deltas is that they get reviewed faster. This may sound like a small point, but based on our analysis of all those dev teams and their projects, long review times slow down cycle times to a shocking degree.
That’s why one of Slack’s core metrics is PR review time, which Slack’s VP of Engineering, Rukmini Reddy, revealed on the Dev Interrupted podcast:
2. The task is too difficult
Sometimes, a task can turn out to be harder than anticipated. Maybe the problem wasn’t completely understood. Or perhaps there were a number of “unknown unknowns” that were discovered, making the project bigger than anticipated. Unexpected difficulty will increase the total time it takes code up a task.
A second order effect of unforeseen challenges is that time management becomes a nightmare. How can you plan ahead if you don’t know how long the work is going to take?
The problem is compounded in a team setting, where you need to allocate work among team members. Managing projects and tasks is already difficult enough before you’re forced to reallocate resources on the fly while still keeping an equitable distribution of work hours.
3. The task is languishing
This one is pretty simple: coding time is taking longer than expected because the task was started but then dropped for a length of time. Most likely the developer was required to turn to other tasks based on new priorities.
Investigating High Coding Time with LinearB
The first thing to do about high coding time is to find out which projects or branches are the ones causing the problem. In order to do that, you can drill down into the LinearB dashboard and take a look.
To look more deeply, you can click on the little arrow in the upper right corner of the cycle time Box.
Doing that will take you to the Branch View of your repository. From there, you can see all the branches that are affecting your coding time.
For instance, the top branch below had a coding time of almost eight days – a really long time!

Note, too, that you can see the exact contribution that any branch is making to the overall cycle time by simply hovering your mouse over the cycle time column of the given branch.
This granular level of detail allows you to see which projects and branches have high Coding Times so that you can start taking targeted action and making improvements.
Once a branch has been determined to have a coding time problem, you drill down on that branch to diagnosis the root cause and then work with your team to remedy the situation.
Preventing High Coding Time
Naturally, what you really want as a manager is to prevent coding time from being a problem in the first place.
The first thing you can do towards that goal is to educate your team on the need for dividing your work into small, manageable chunks. This will improve coding time and have positive cascading effects downstream on pull request times, as mentioned above.
The rule of thumb is to have fewer than 150 changes in a delta.
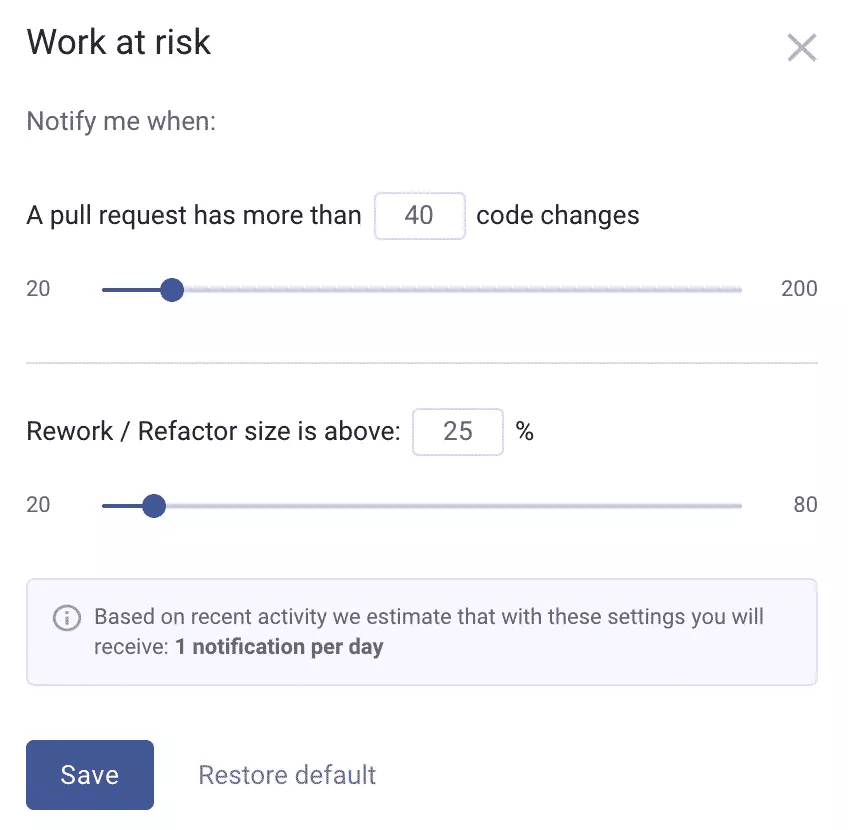
LinearB can help your team accomplish this goal with our configurable Team Goals and WorkerB notifications. They alert you when a pull request exceeds a certain number of code changes, a number that you can set. This not only informs you of a delta that potentially had a high coding time, but it also enables you to intervene right away and start to drive improvement in this dimension.
Another way to keep an eye on coding time is to create a custom dashboard with PR size and coding time.
Start Reducing Cycle Time Today
Keeping coding time, and thus cycle time, under control is a critical means to continuously improving your software development process. By keeping an eye on individual branches where coding time is pressing up against your limits, and by warning your team about branches not meeting your team goals, you can ensure that your coding time stays under control.
These are just some of the many benefits of LinearB. To learn about all our advanced features and all the ways you can improve your development processes with LinearB, get in touch with us to book a demo.
But don’t just take our word for it.