Update (12/17/2024): Project Forecasting just got two significant enhancements:
- Integration of the Monte Carlo predictive model
- Dynamic, granular project scoping filters
The all-new Project Forecasting helps you overcome significant challenges that every engineering team has likely experienced: providing accurate timelines for project completion and ensuring predictable software delivery.
Project Forecasting enables you to meet this challenge head-on with the following capabilities:
- Granular project filters that show progress on priority initiatives and illustrate key patterns (like a habit of added work)
- Auto-generated insights–like stalled issues, overloaded developers, and missing project data
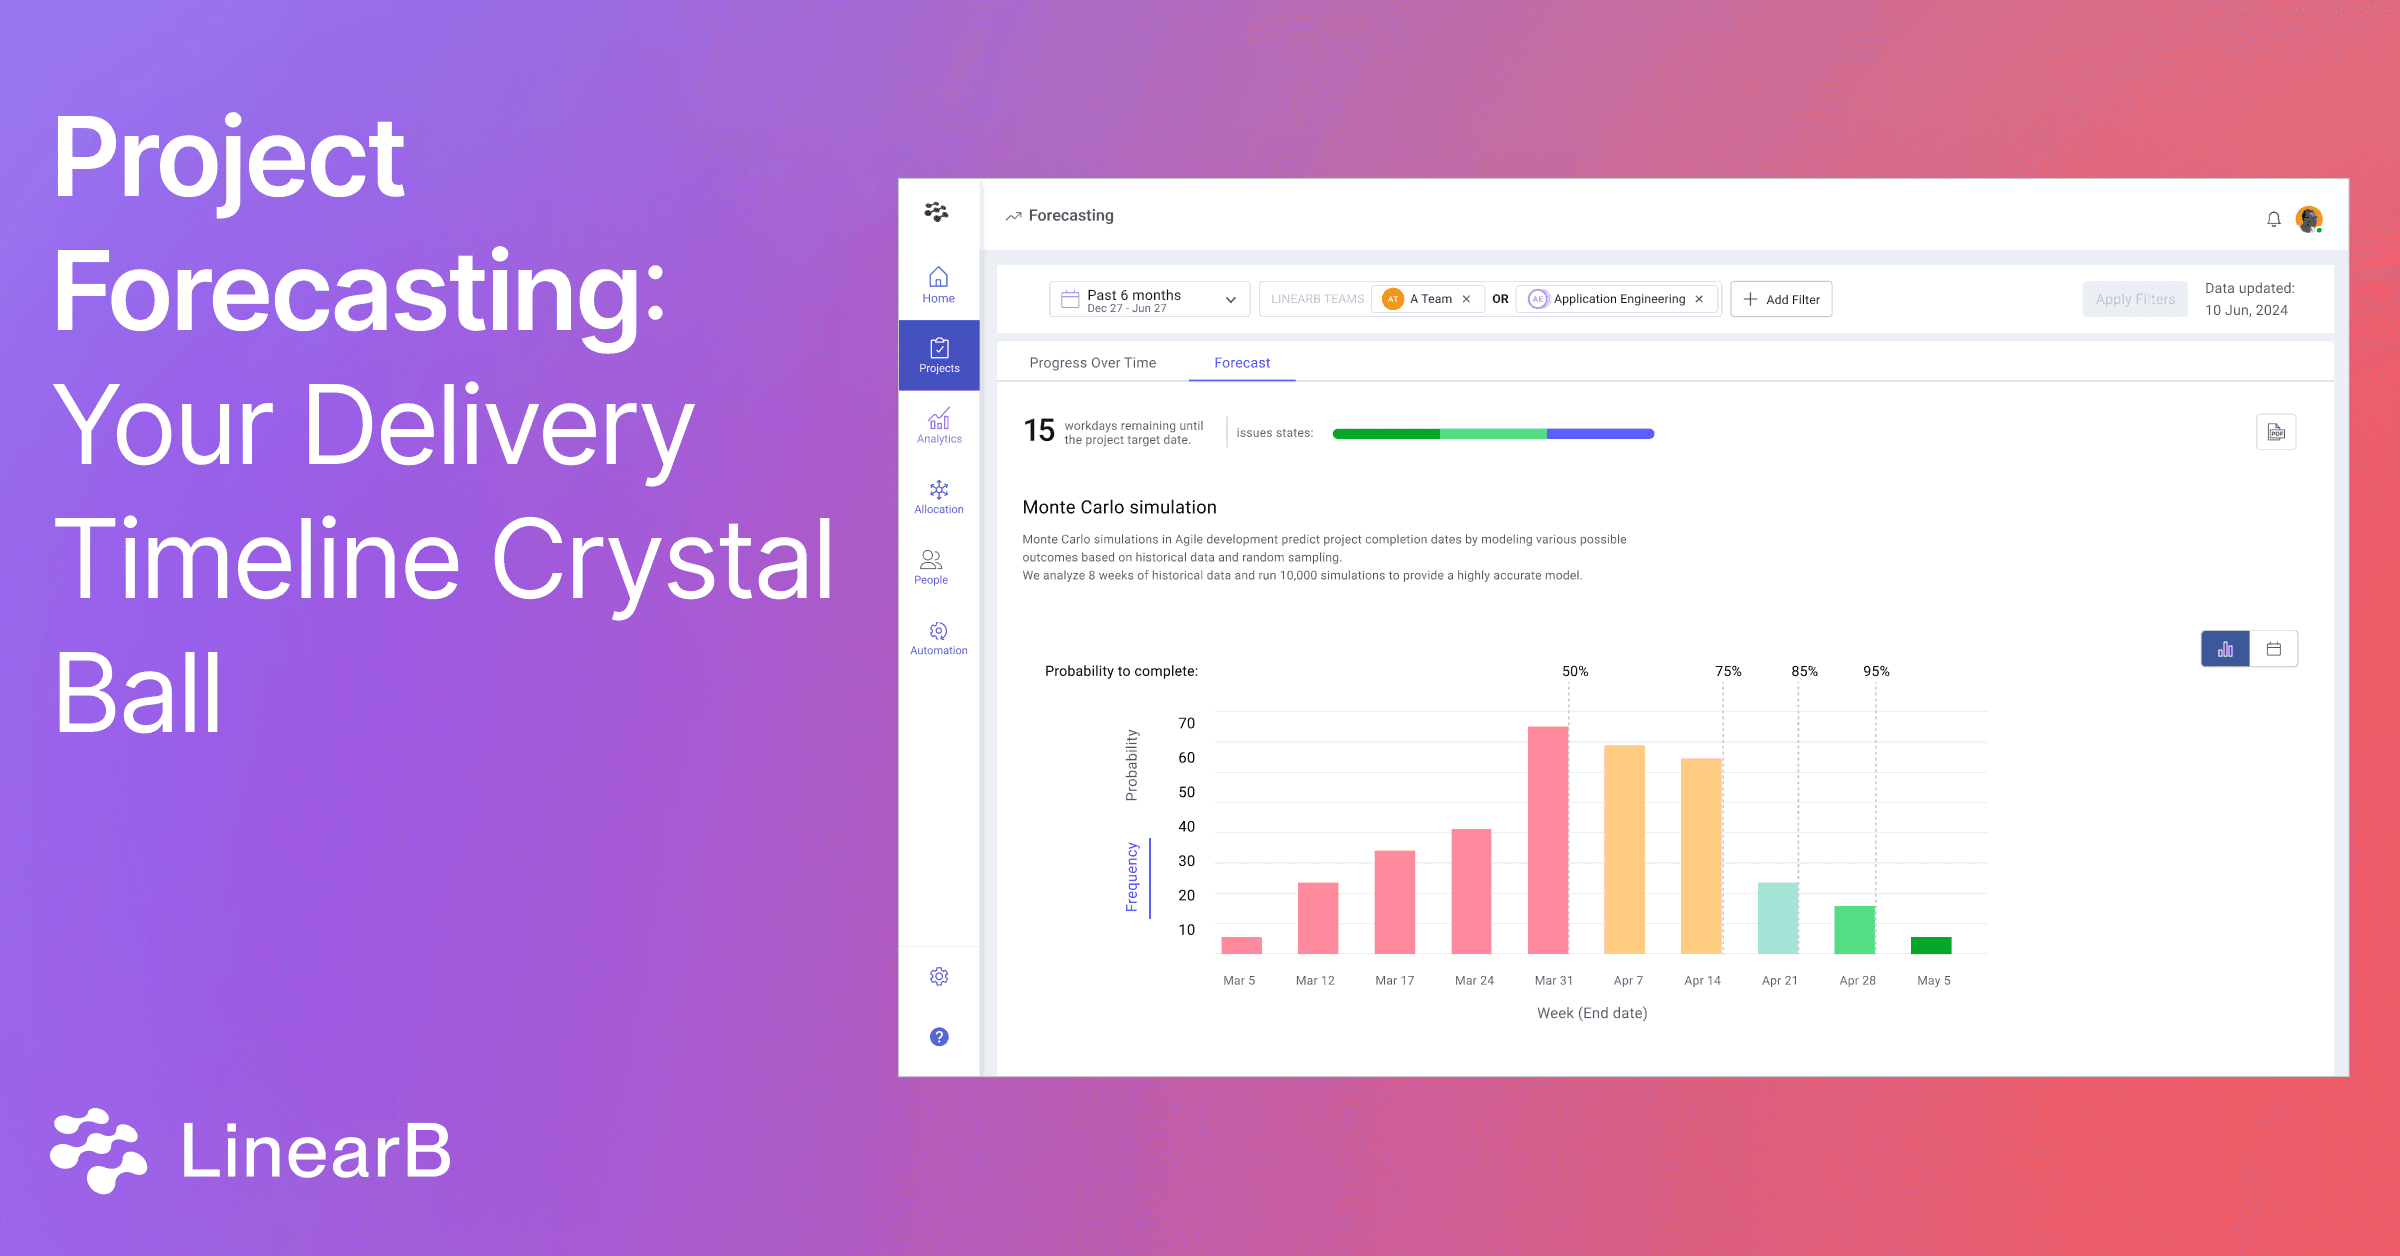
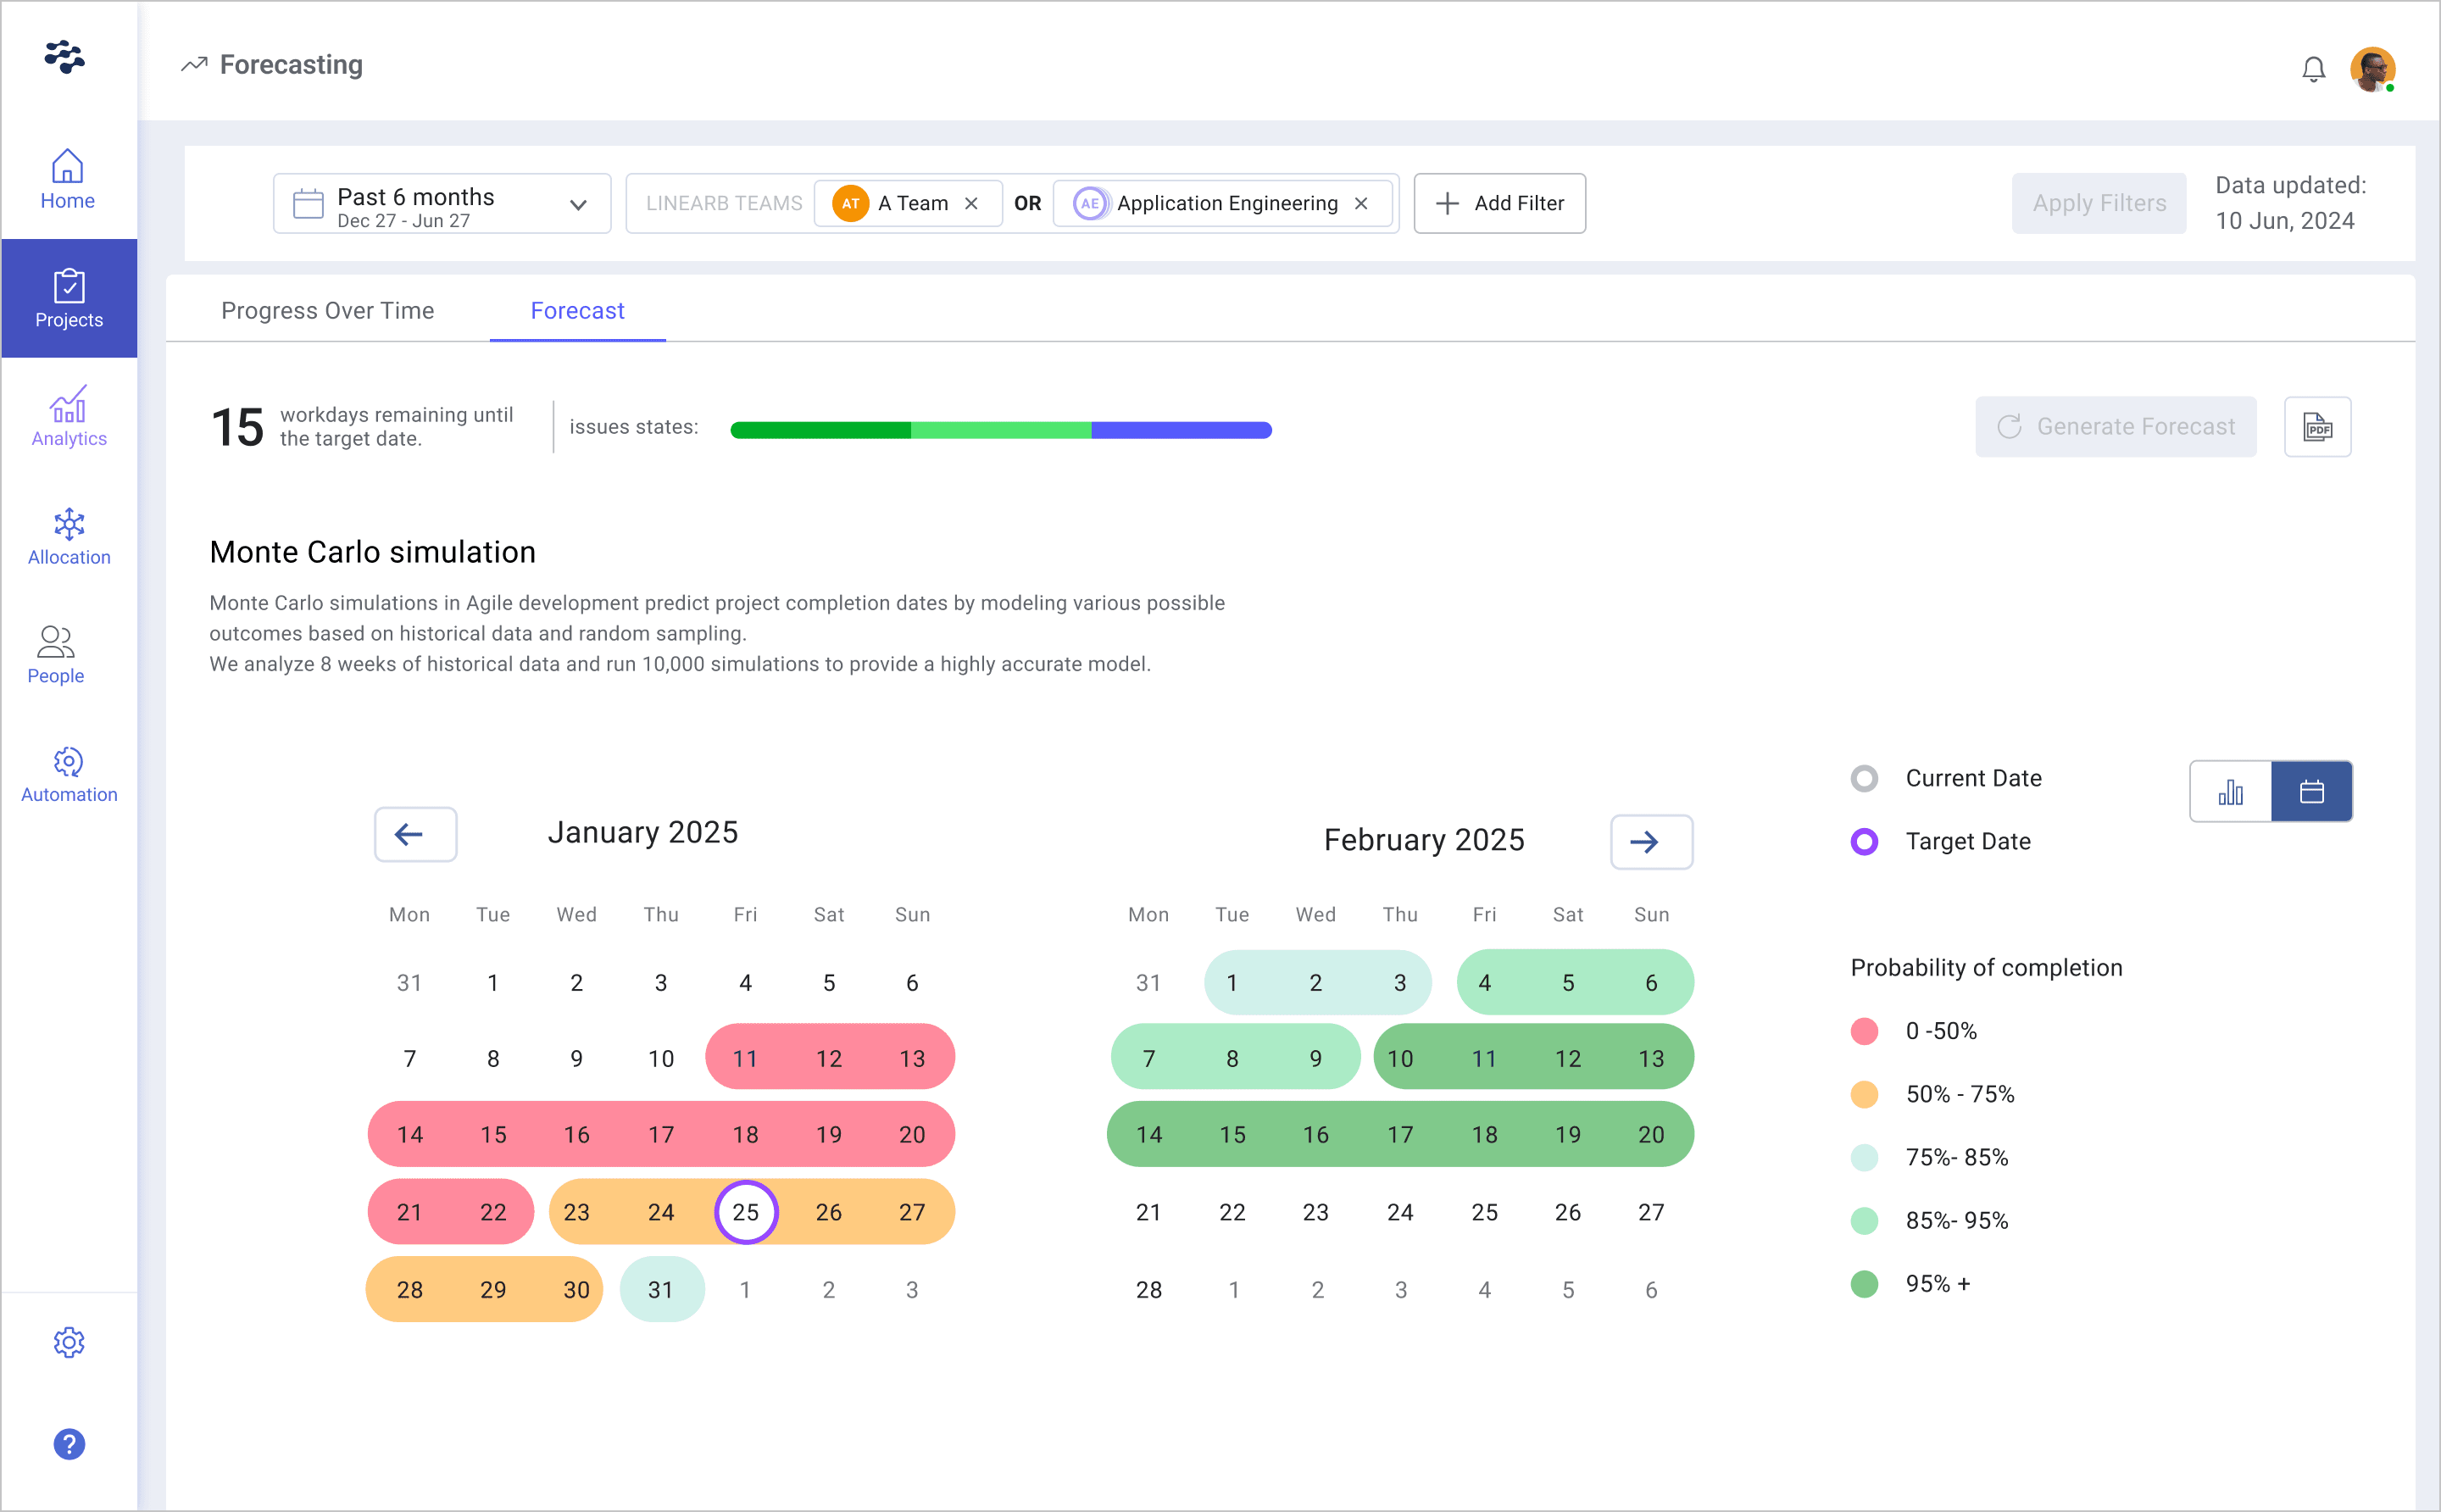
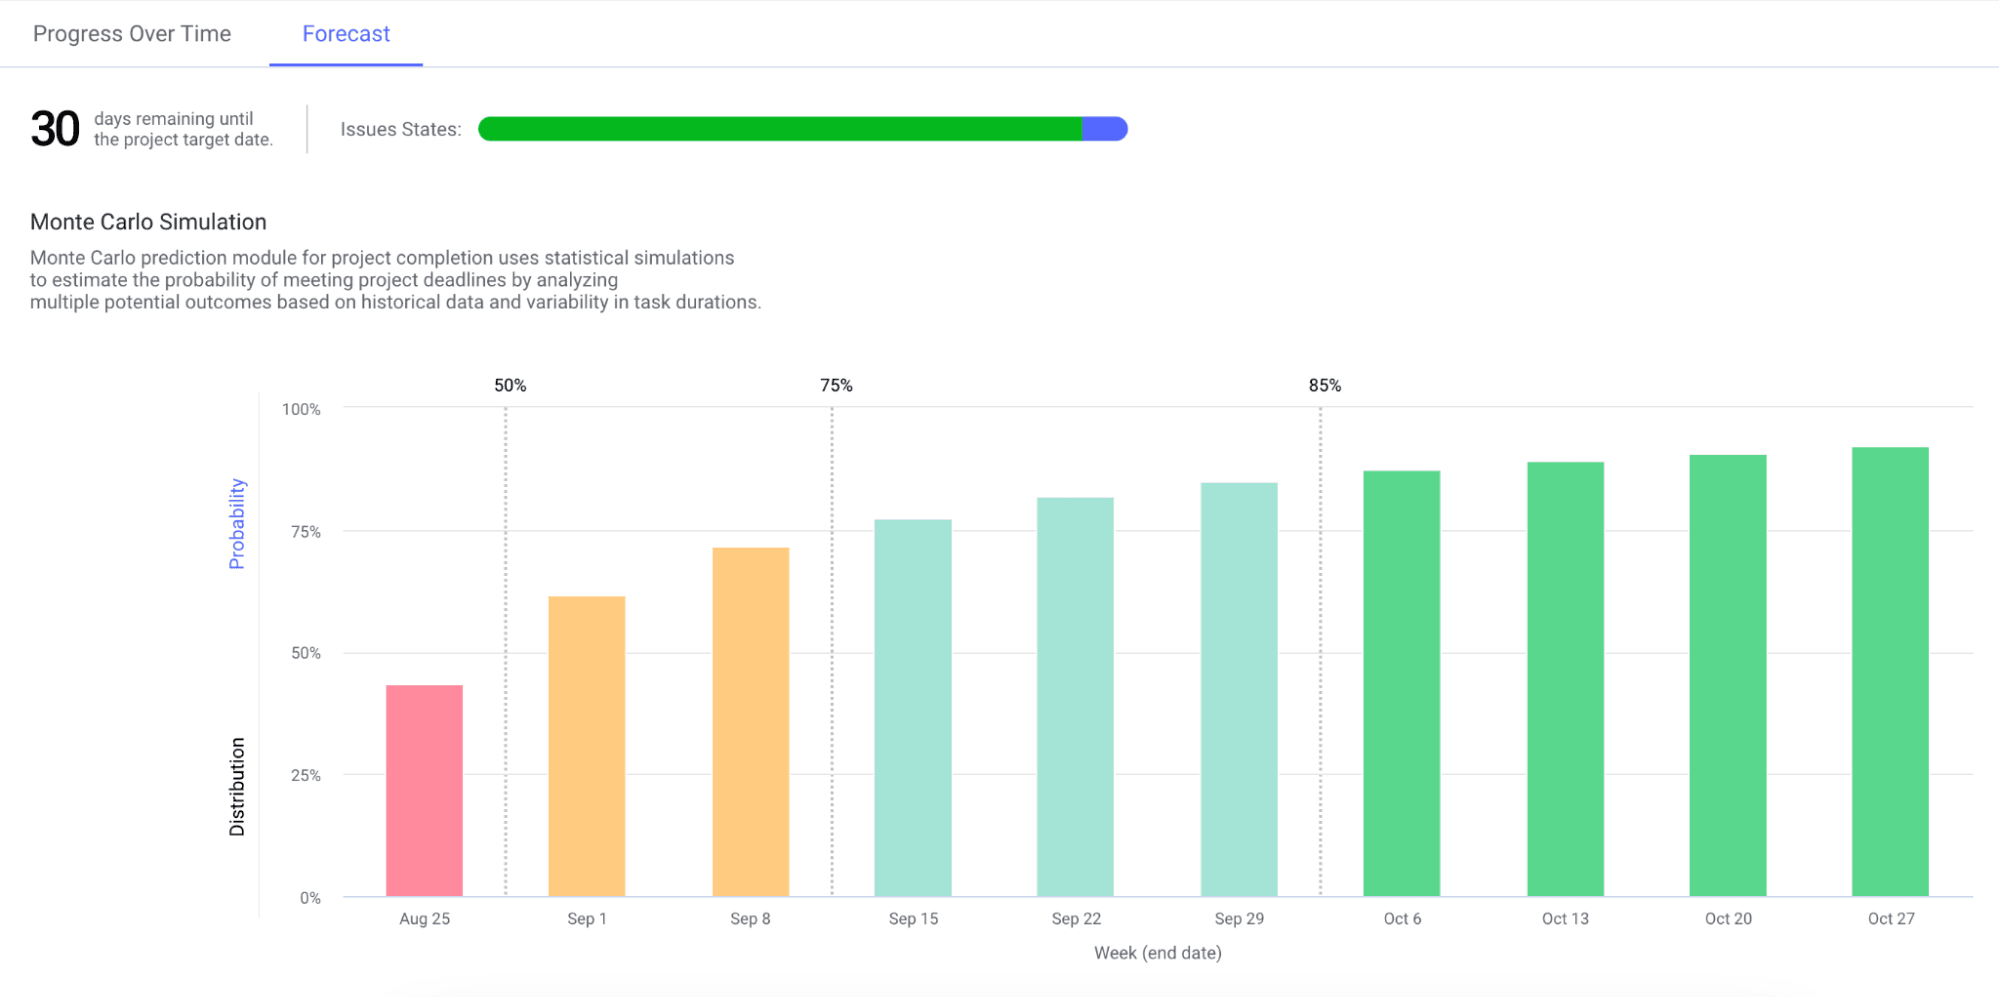
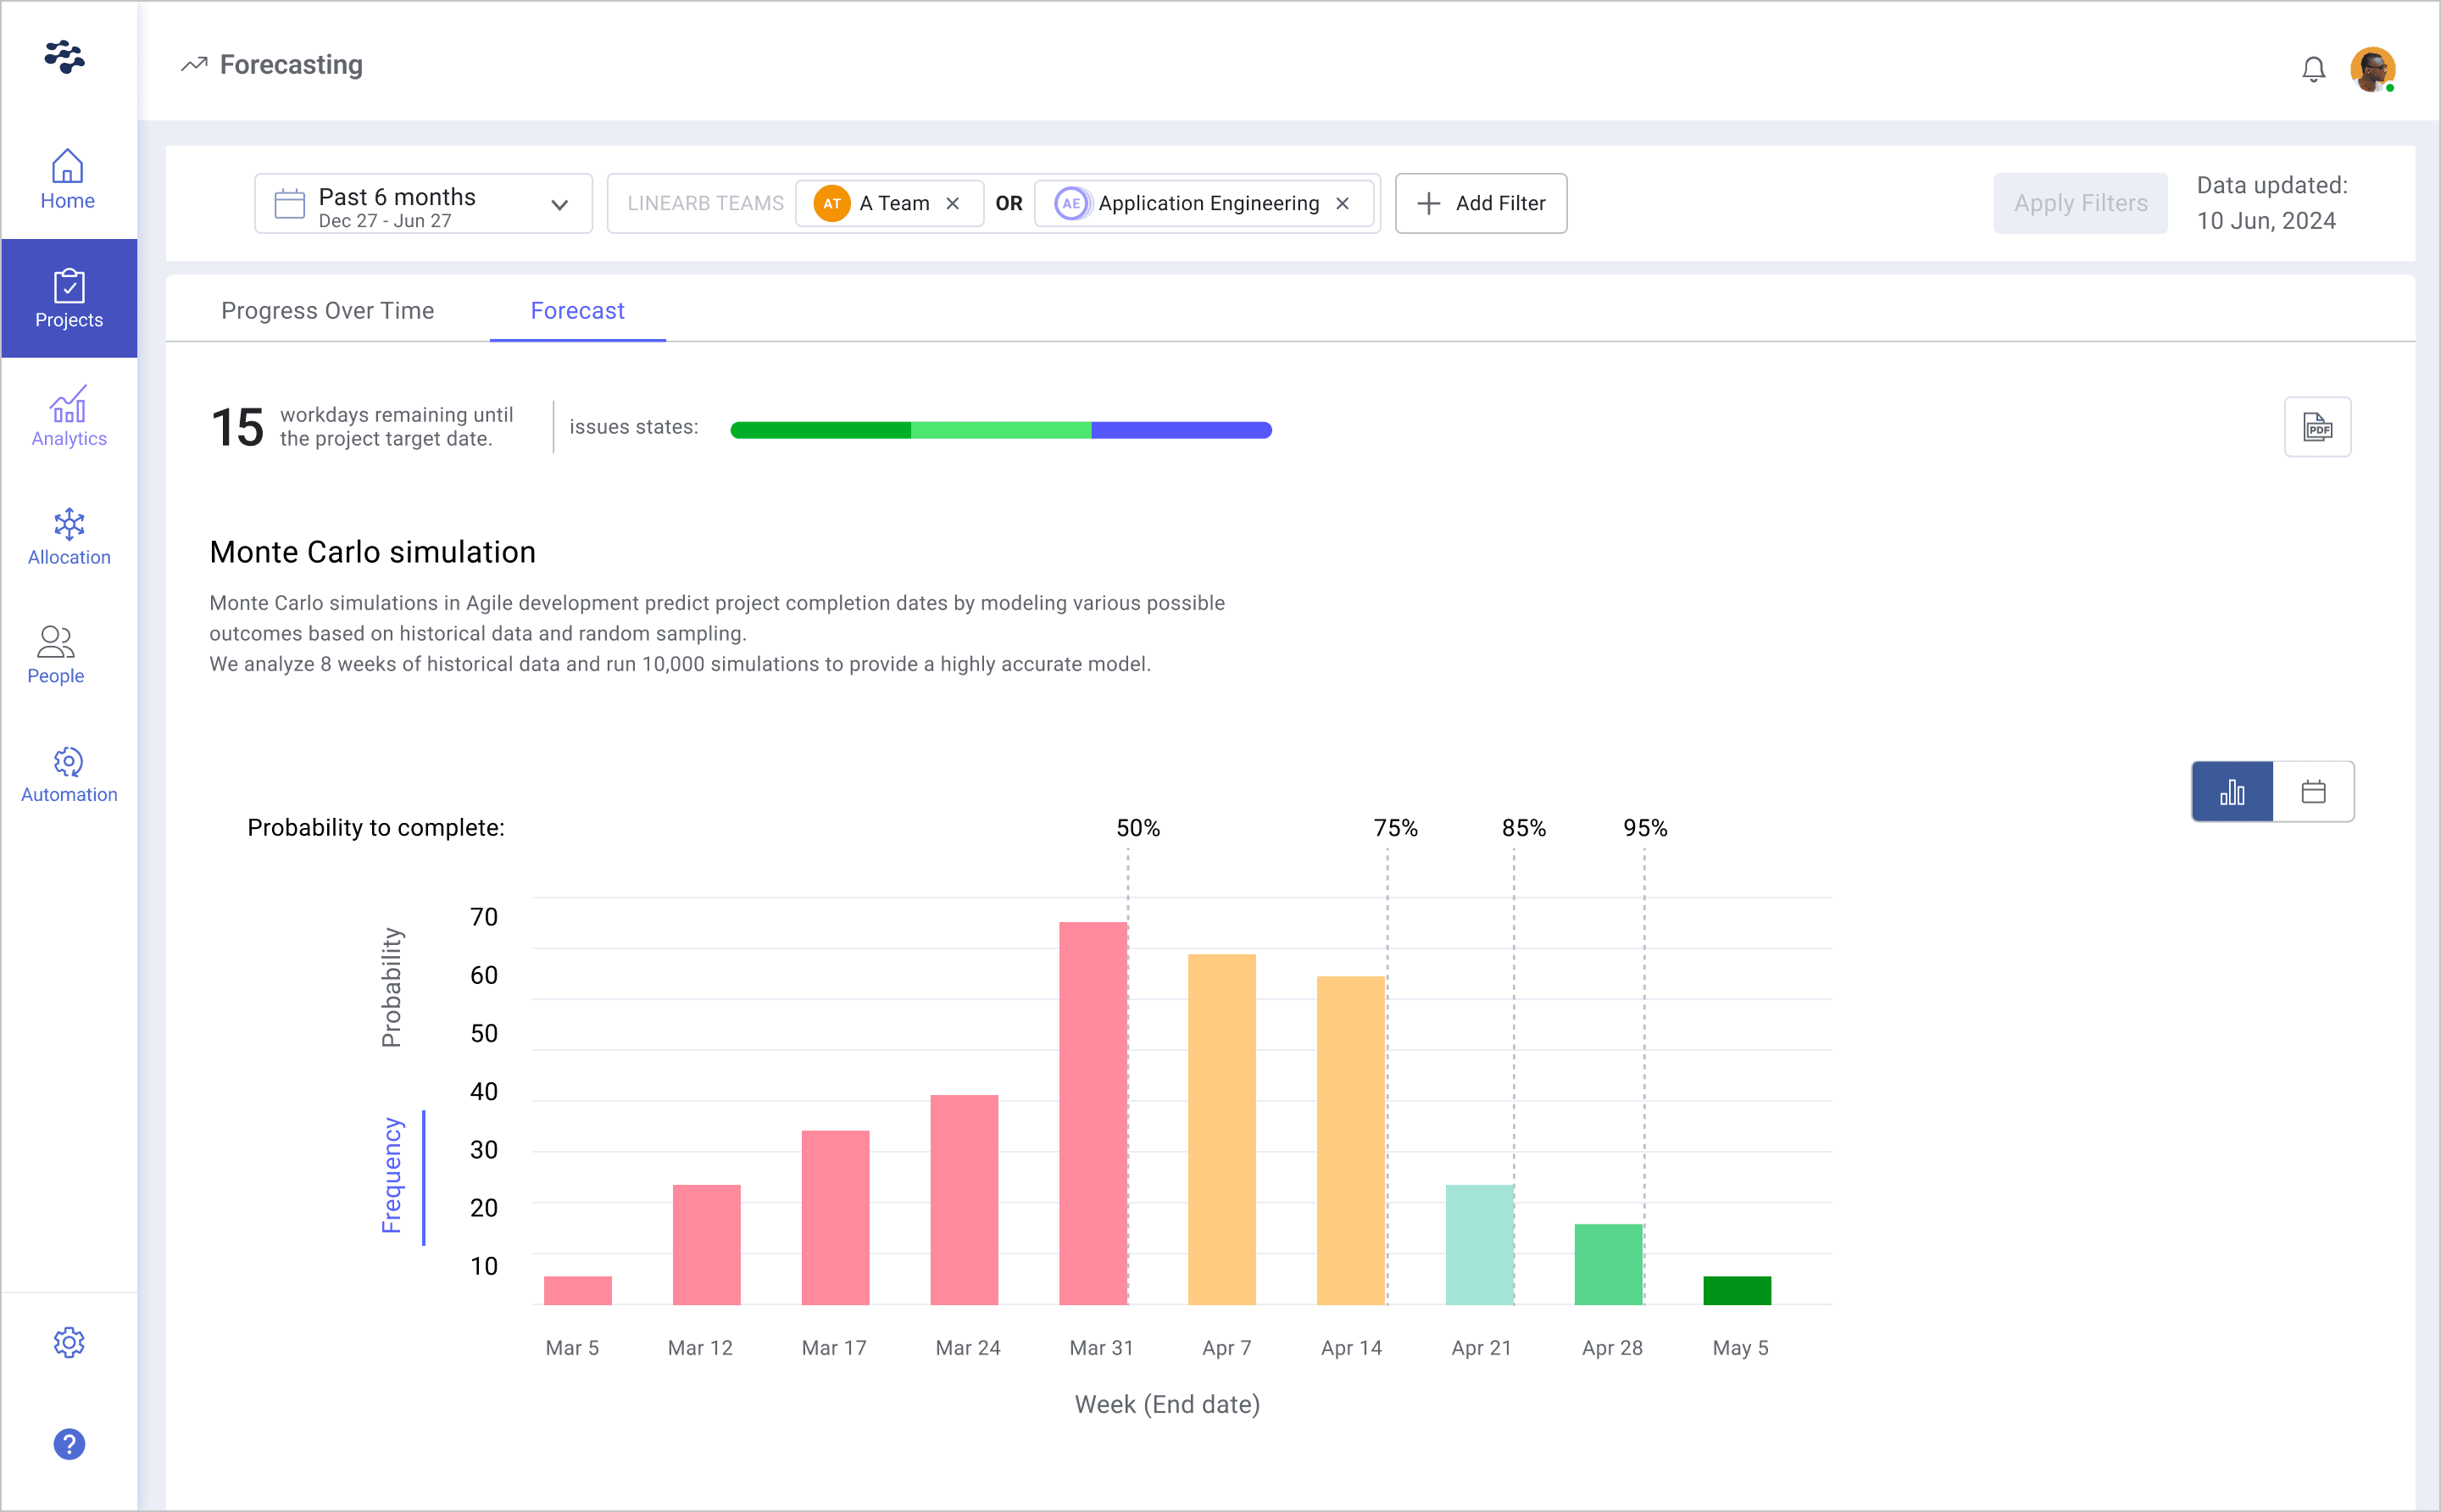
- Monte Carlo predictive model that visualizes delivery probability against calendar dates as a distribution curve, standard bar graph, or calendar view
The Monte Carlo simulation is a mathematical concept that uses probability distributions to predict the possible outcomes of uncertain events. This all-new capability enables you to provide accurate, up-to-date delivery estimates that account for the variability always present in engineering.
In addition to Monte Carlo simulations, the new Project Forecasting enables more focused visibility into project delivery with flexible project definitions and filters. Now you can see forecasting data in any helpful way–by issue, PM project, epic, team, group, LinearB-defined project, and much more.
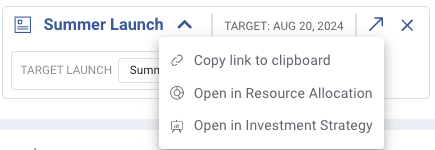
These filters–which extend to Project Forecasting, Resource Allocation, and Investment Strategy–can be used to:
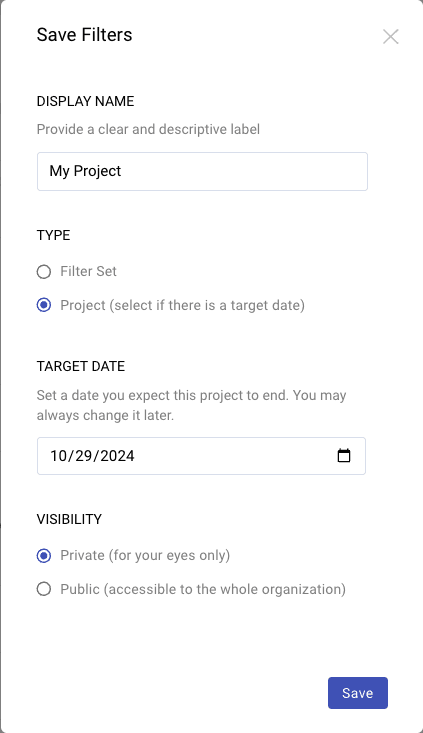
- Build a shareable, quick reference view to a filter set to align the entire team (for an ongoing project, initiative, or scope of work)
- Define your project scope and assign a target date to be used for Monte Carlo forecasts

 These enhancements not only enable you to accurately forecast delivery dates and keep priority projects on track, but they also help you:
- Enhance project status meetings and discussions with data
- Provide objective risk visibility (vs. anecdotal communications)
- Encourage and incentivize good PM data hygiene
- Provide visibility to stakeholders across the organization and align the business
These fantastic enhancements to Project Forecasting are now generally available for LinearB Paid accounts.
LinearB Users: Click here to get started with Project Forecasting.
Have you ever felt that you’re just guessing at when a new feature or enhancement is going to ship? Don’t worry, you’re not alone. One Quora user summed it up nicely: “The fundamental thing to remember about schedule estimation is that it means predicting the future. If anyone was actually any good at predicting the future, they’d use their skills on something more lucrative, like picking stocks.”
While you can’t predict the future, you can proactively update the business if/when a project looks to be going off the rails using an all-new tool in LinearB: Project Forecasting.
This significant enhancement provides a highly flexible view into projects and execution trends. It also offers a similar look and feel to PM tools you’re familiar with. But Project Forecasting takes it a step further with (1) simple filtering that enables you to slice the data in the most helpful way (2) automatically-generated insights that you can action NOW (3) Monte Carlo predictive modeling algorithm that tames uncertainty.
In a nutshell, Project Forecasting helps you answer two three crucial questions:
- Is my high-priority project behind schedule? Identify project delivery (anti) patterns
- How do I get my project back on track? Mitigate delay risks now using key insights not available in PM tools
- Do I need to rescope my target delivery date? See the probability of completion against a calendar view and use project insights to optimize timelines.
Is my high-priority project behind schedule?
At the highest levels, Project Forecasting will provide visibility into two key considerations for overall project health and on-time delivery: general progress trends and potential scope creep.
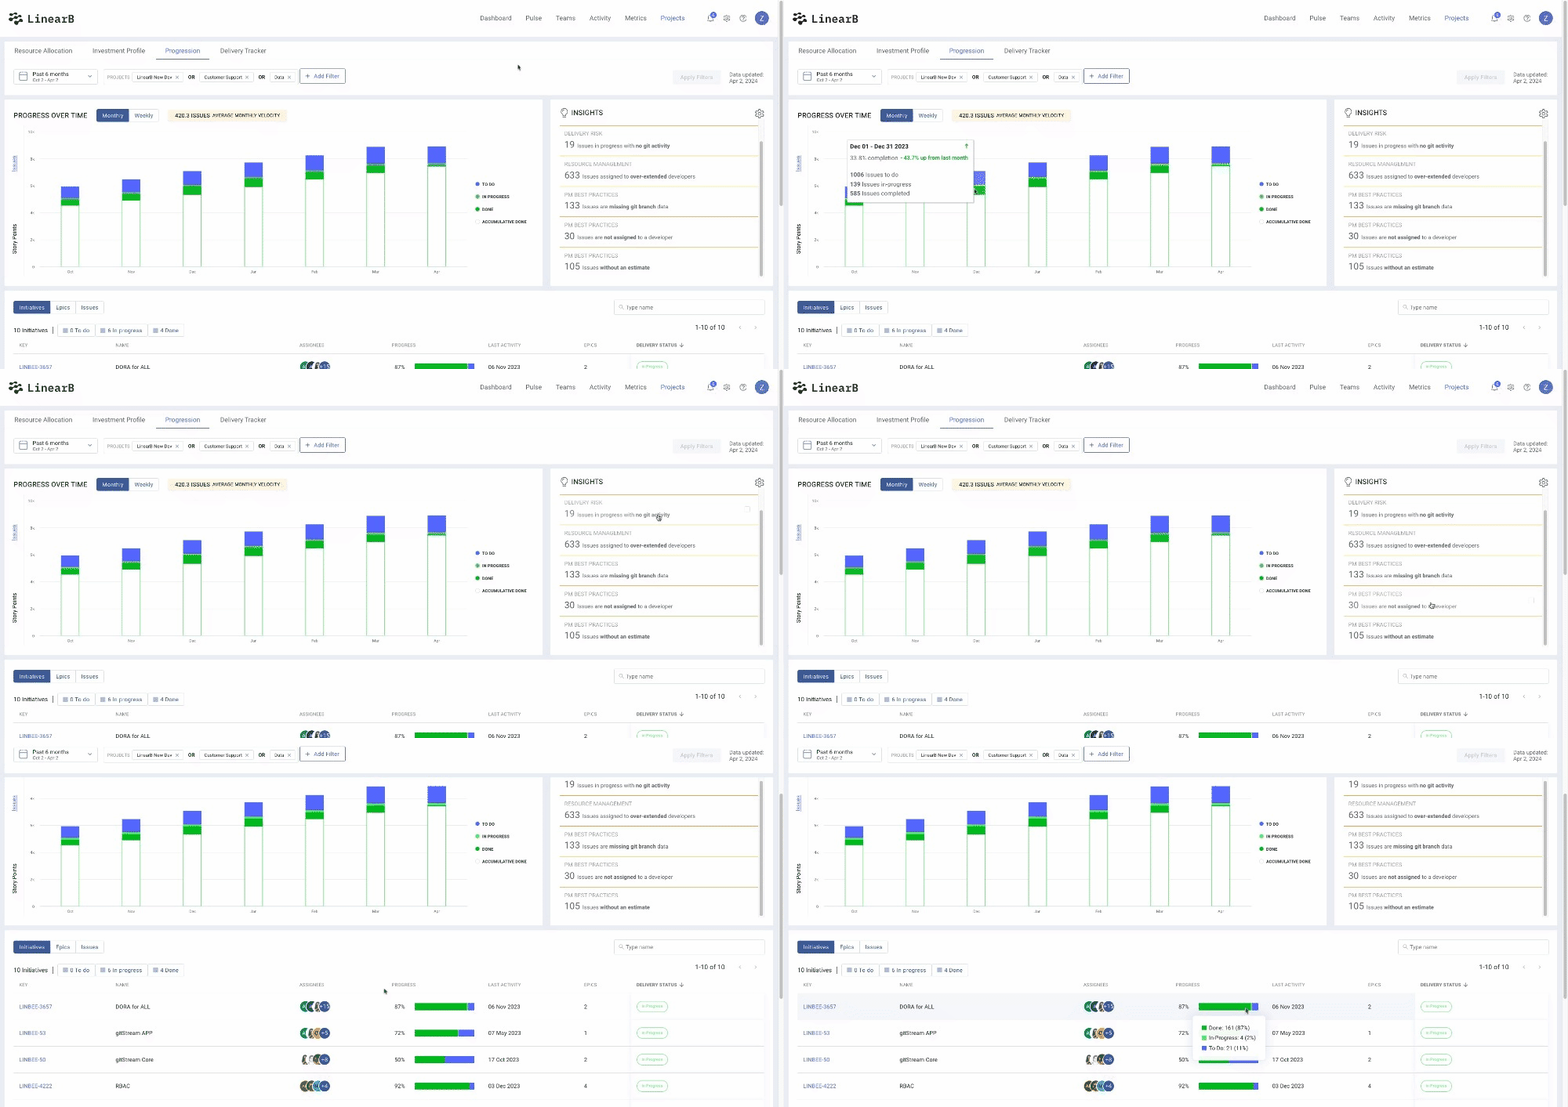
The progress over time view is customizable and can be presented in monthly or weekly intervals, broken out by issues or story points, over several date ranges. Best of all, you can bubble up exactly what you want to see using intelligent filtering by project, epic, team, and much more.
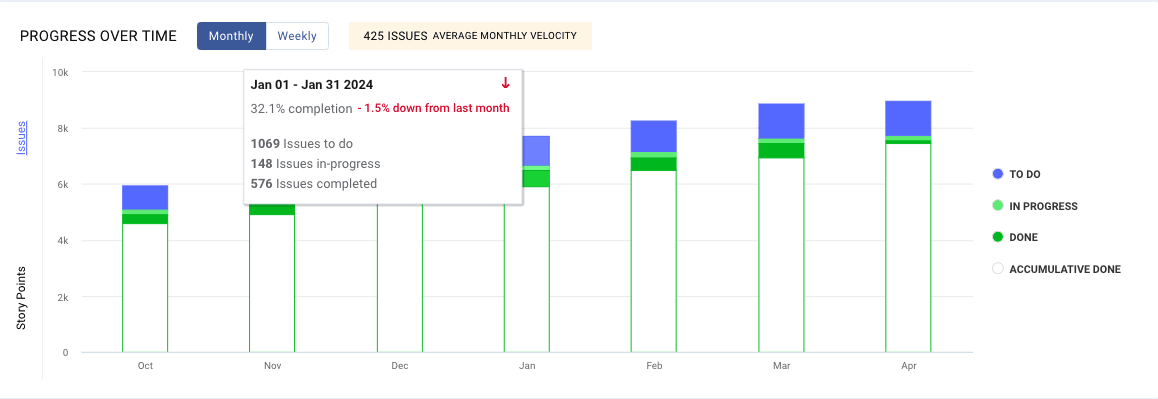
The project in this example is unlikely to be delivered on time (at least without intervention) because of two identified anti-pattern insights: The negative trend in completed work (down 1.5%) and the bars growing over time.
The first anti-pattern lets you know that teams are having trouble executing (more on this later). The second anti-pattern denotes scope creep–a big hurdle for on-time project delivery. Ideally the bars measuring issues or story points would remain consistent with the white “Accumulative Done” growing over time. In this case, the bars are steadily growing, meaning more issues are being added.
Pro tip: Focusing your team’s Accuracy Scores is a great way to combat scope creep. Check out our blog that dives deep into this topic.
How do I get my project back on track?
While the Progress Over Time breakdown provides clear signals into whether a project is at risk, the Insights tab shows you why and, more importantly, what you can do right now to get the project back on track.
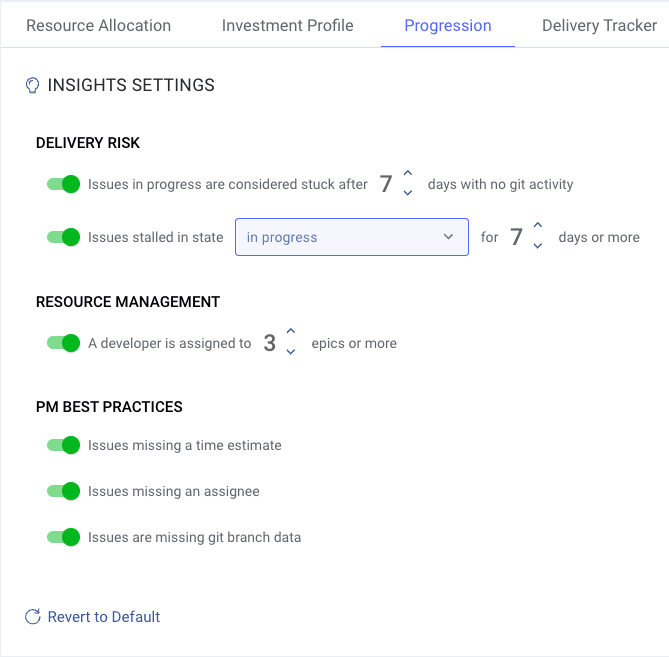
Note: These insights are highly customizable, so they accurately reflect reality for your engineering teams.
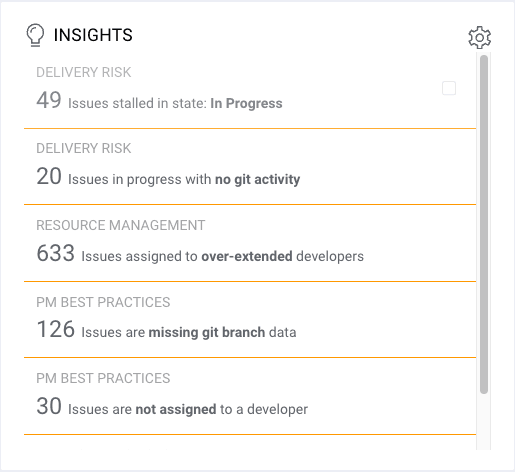 |  |
Let’s explore three of these insights and how to action them:
- Issues stalled with no git activity: Shows how many issues have elapsed X number of days (you decide what’s right for you) with no git activity on associated branches, over the defined period of the Progress Over Time graph. The team(s) on the project with these issues would benefit from implementing WorkerB automated alerts about stale PRs to keep them on track.
- Issues missing git branch data: Shows how many of the in-progress issues do not have a branch associated with them. If this is high, try implementing this gitStream automation on your repo.
- Issues assigned to over-extended developers: Burnout is a big project delay risk. This insight shows how many developers are assigned to more than a defined number of in-progress epics (configurable to do what makes sense for you). This risk indicator can be mitigated by moving resources from another team to this project.
You can also easily take action on the other insights by having conversations with your team to ensure things like PM board hygiene are prioritized.
Do I need to rescope my target delivery date?
The latest enhancements to Project Forecasting provide the answer to this question. The all-new filtering and data segmentation capabilities help you define the scope of visibility you want, enabling you to focus on what matters most for you and your team(s).

The Monte Carlo forecasting model–using your past operational and delivery data–then provides clear-cut delivery probability ranges or a standard distribution curve against a timeline that includes the current date and a customizable target date. This enables you to:
- Provide clear, accurate delivery probability to stakeholders in your project status meetings.
- Bring probability data to your next sprint retrospective so you can discuss blockers, process bottlenecks, and ways to improve against project timelines
- Use this probability–as well as Project Forecasting insights–to take corrective action
Take Forecasting to the Next Level
To take Project Forecasting to the next level, use it in concert with other LinearB capabilities. For example, to determine if scope creep is causing delays, look at project Accuracy Scores. To take action against risk indicators, use Bot Assistance to move stalled issues (those without git activity) along and Pull Request Orchestration to improve your developer experience and ensure needed information and context is present (like issues being associated with branches).
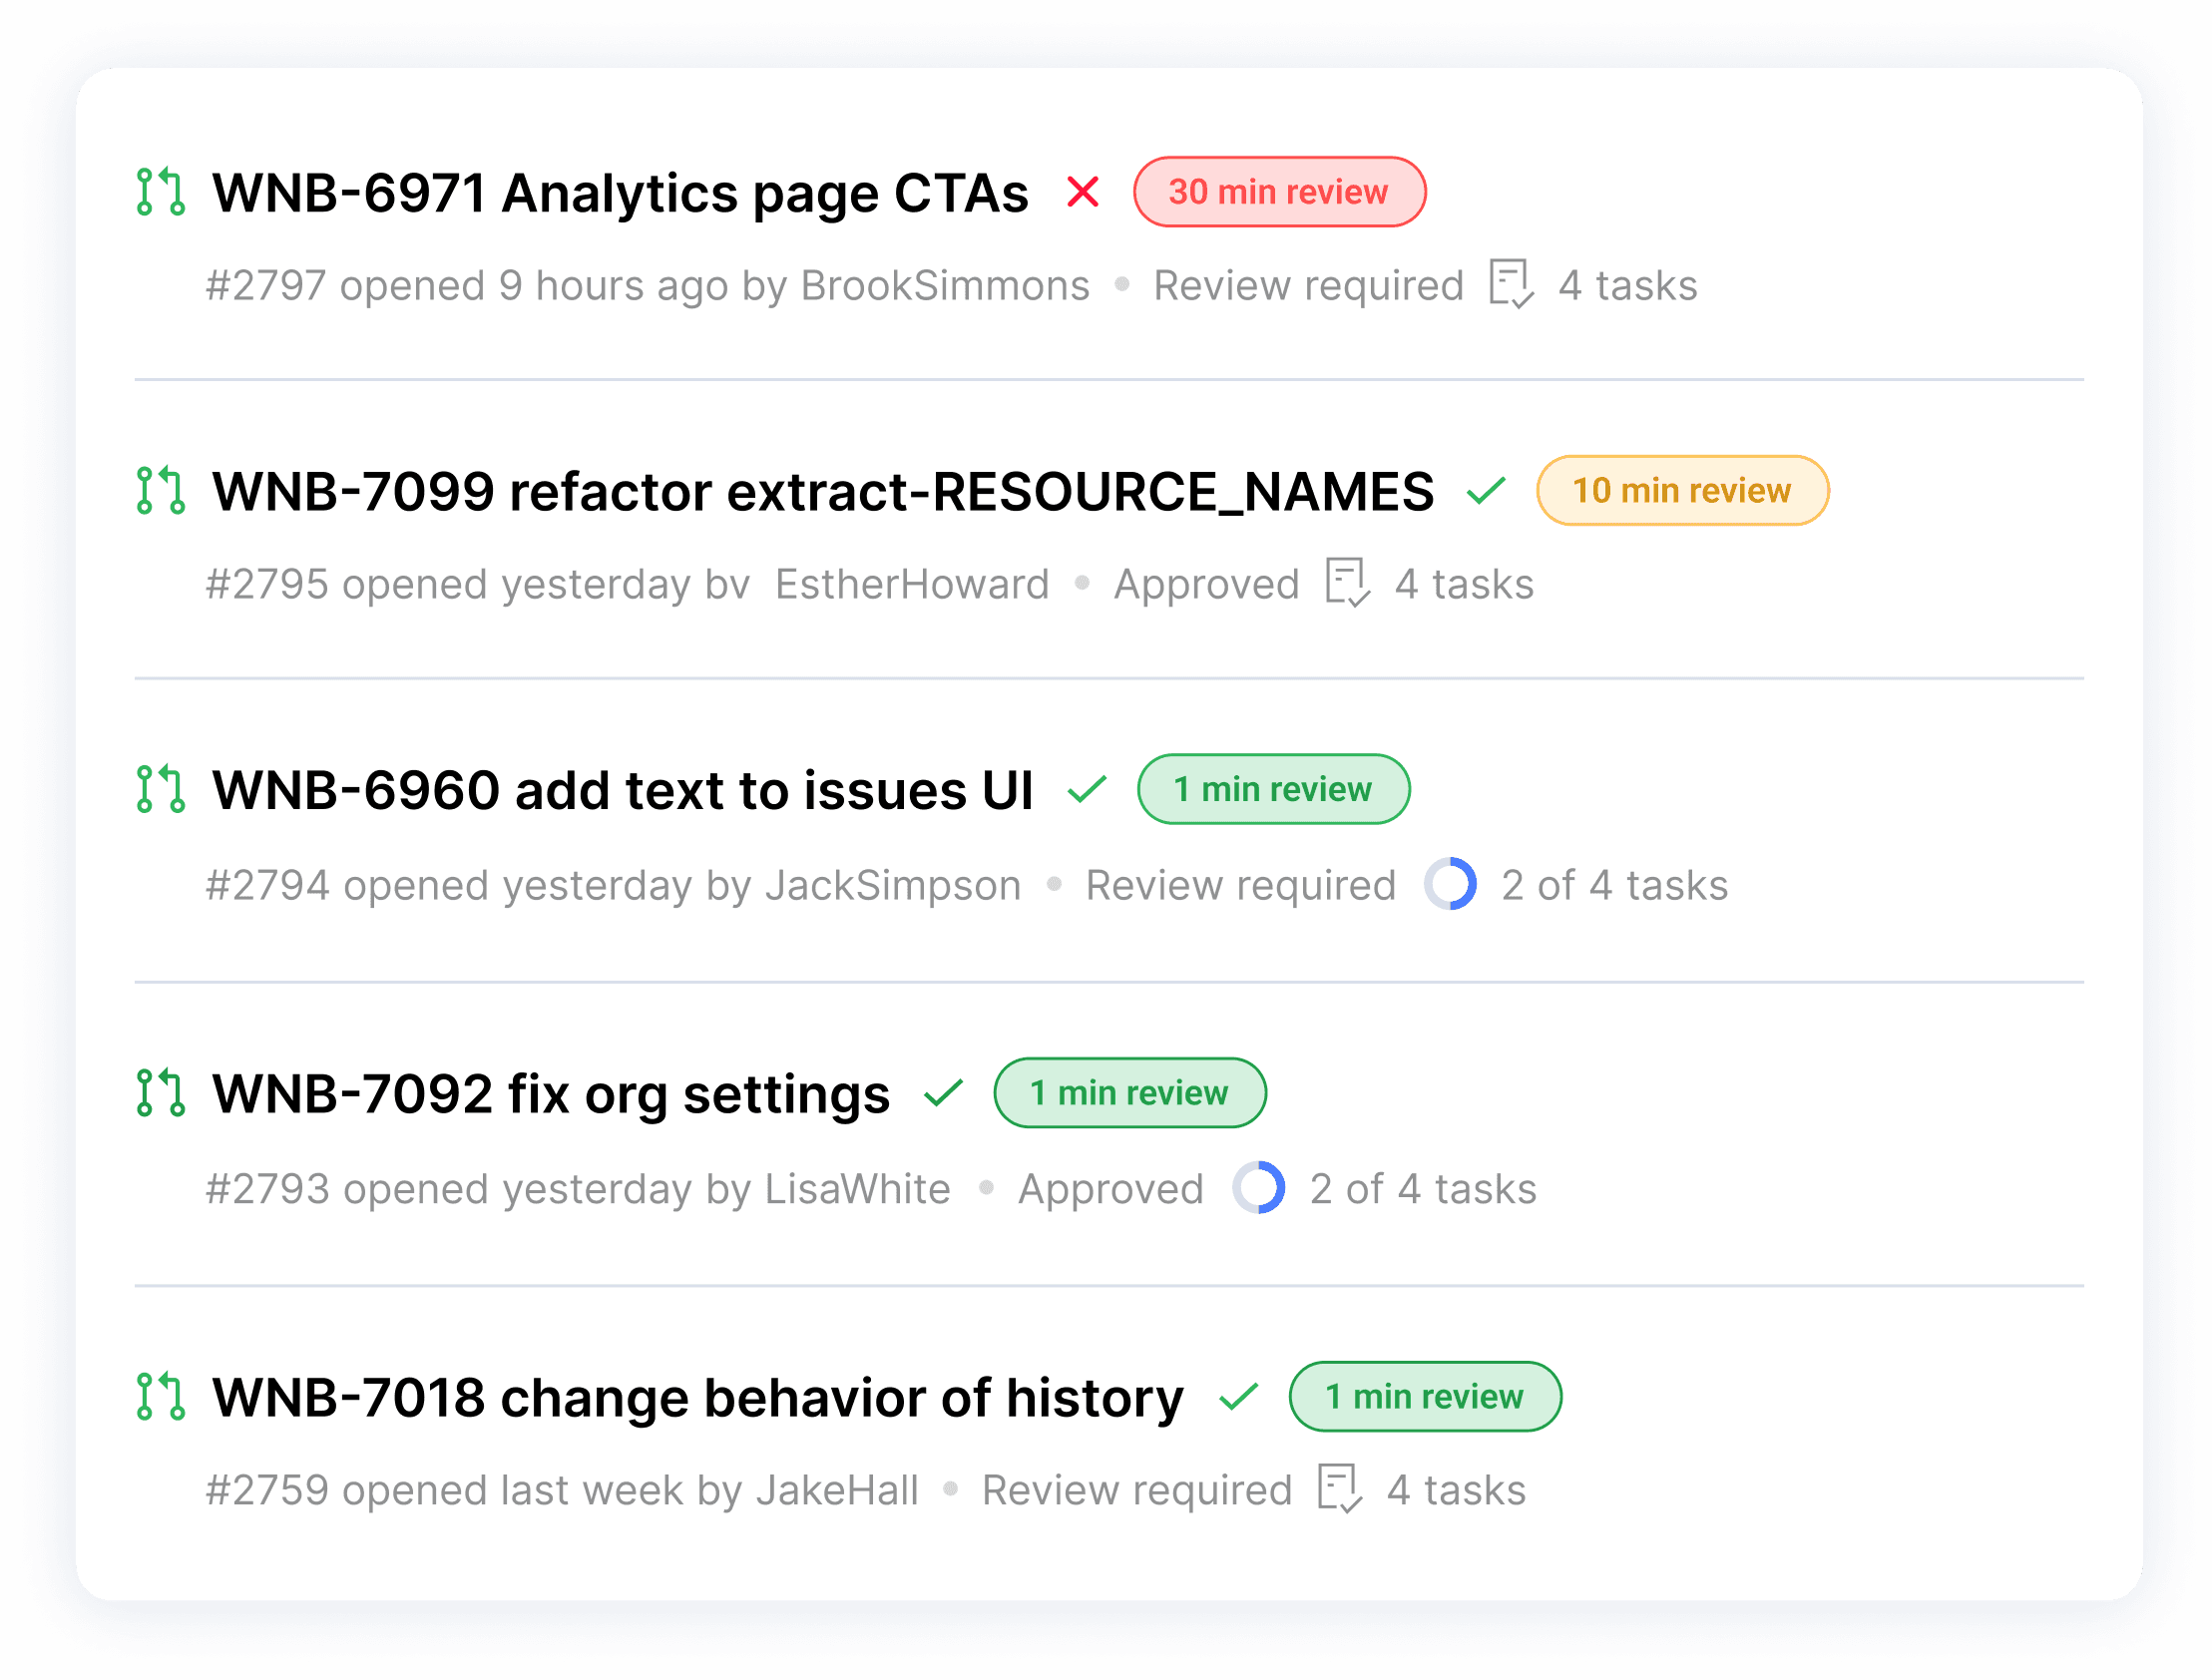
Then look back at Project Forecasting to see your risk indicators decline and your progress trending in the right direction!
Project Forecasting Next Steps
We’re confident that Project Forecasting, Monte Carlo simulations, and the saveable, extensible filter sets and project scoping tools will help you provide visibility to stakeholders, enhance discussions and recurring syncs, and keep priority projects on track.
LinearB Users: Click here to get started with Project Forecasting.
For Non-LinearB Folks: See this feature in action and learn more!
Now get to project fortune-telling and change the future!

