Identifying good software development metrics is harder than it seems at first glance. Company executives don’t have the ability to sit in on every team meeting but they still need to make accurate decisions about projects and products. So, when you design a dashboard to communicate software development metrics, you want to ensure that you’re sharing metrics that accurately communicate the health of the team. What’s more you want to avoid dangerous or hard-to-use metrics that don’t provide value. In this post, we’re going to describe five high-quality metrics that you should feature on your team’s software development metrics dashboard.
Metric #1: Cycle Time
Cycle time is a key metric for every development team. Cycle time measures how much time passes between your team starting work on a feature and delivering it to customers. Measuring cycle time differs from the more commonly measured lead time. Lead time measures how much time elapses between a customer requesting a feature and the team delivering it. While lead time might be a useful proxy for customer happiness, it’s not a good development team metric.

Instead, cycle time provides much more insight into the health of a software team. It illustrates team efficiency quite nicely. Knowing how efficient a software team is provides key insight when making a decision about where to delegate a project or whether to push for a new product feature.

However, it doesn’t just provide that insight. It also offers a peek into the ways that a team can find more efficiency. A good cycle time metric outlines specific gates where a project might slow down, then measures a feature’s time spent between each gate. Cycle time, when well measured, will tell you that features are slowing down before receiving code review or because there’s lots of back-and-forth time with QA.
Effective leadership teams will use cycle time as a way to make software teams more effective with every new project.
Metric #2: Iteration Churn
Churn is the enemy of efficiency. Iteration churn measures the number of changes to scope during a team iteration. In most agile frameworks, the idea is that the team commits to a set of deliverables in a single iteration, often called a sprint. This commitment is supposed to be fixed, but in reality, it often changes. When the team’s commitment changes, they need to reprioritize and shift what they’re working on. Switching context is particularly costly for knowledge workers, causing them to spend crucial time to get up to speed on their new context.
One reason that iteration churn is so critical as a software development metric is that it’s usually out of the hands of the software team. Every software team I’ve ever worked on hates changing the commitment during the iteration. But it’s rare that we on the team had a choice. Those decisions almost always came from an external force. So a high level of iteration churn communicates that people outside the team are negatively impacting the team’s efficiency. This is key information for executives as they have the authority to eliminate or alleviate forced context switches if a team is struggling.
Metric #3: Rework Ratio
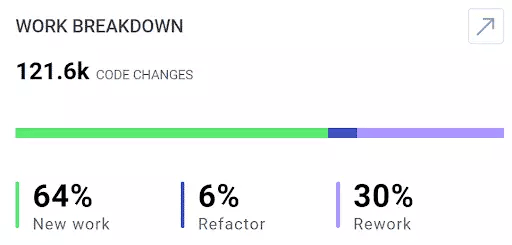
Your rework ratio measures a different kind of churn. Instead of measuring churn within a single iteration, it measures churn within a feature or product. This can be just as damaging to a team’s success as Iteration Churn. LinearB defines code rework as the percentage of code that’s rewritten within 21 days of merging. A high ratio of code rework often means that your team’s features are poorly defined, the developer is struggling, or the code you’re shipping is of low quality. None of these is beneficial to a team’s efficiency. Even worse, they can be absolutely deflating to a team’s morale. Nobody likes working on a feature that customers won’t use.

When code rework is the consequence of poorly written code, that’s sometimes more difficult to fix. Instead of ensuring that requirements are well understood before the team starts working, the team needs to work to improve their overall code quality. That’s hard! It often involves building more time into the process for peer reviewing code and more thorough testing processes.
Investing time in these things seems counterintuitive. The common response is “We’re already behind schedule, and you want to slow things down?” But the reality of the situation is that time invested in things like code quality and quality assurance is an investment. While they slow things down in the short term, they speed them up significantly in the long run.
Metric #4: Bugs Found in Production
If you have a list of software development metrics you currently track, this metric is probably already on it. In my experience, this is a metric that nearly every team tracks, but it’s important to remember why. Bugs that customers find in production is a key metric for two reasons.
One, it’s a useful proxy to measure code quality. Reducing churn in both iteration and feature forms requires time investment by the team and product owners. Executives need to know that invested time is paying dividends. One of the easiest ways to see this is by watching the number of new bugs opened against the software go down.
The number of bugs found in production is also a useful metric for measuring customer satisfaction. Seasoned software executives recognize that no product is ever going to have zero bugs. But moving the number of bugs toward zero means that the software works the way the customers expect. That’s key for keeping customers happy and ensuring they’ll recommend your product to their peers.
Metric #5: Investment Profile
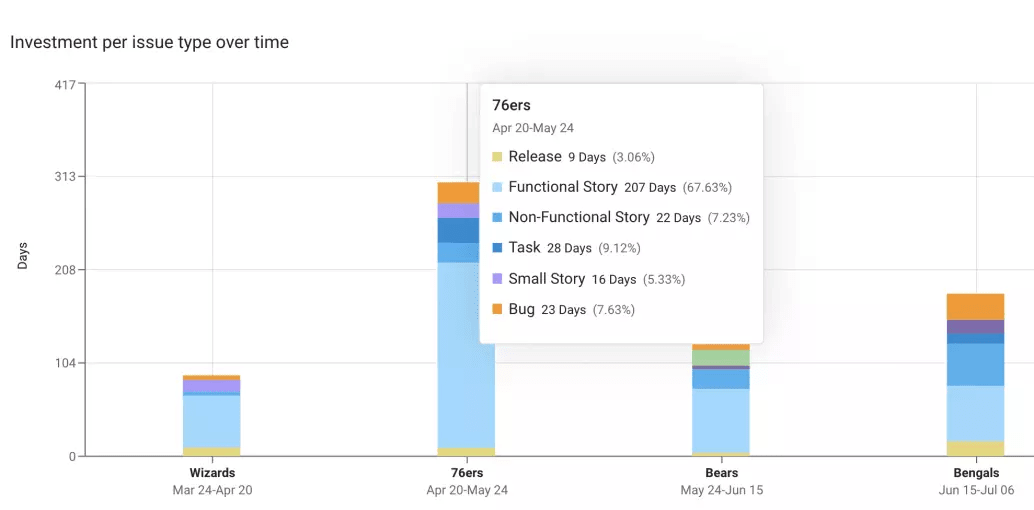
As a team leader, you want your team’s investment profile to be like a stock portfolio. You want to diversify investments across a range of targets. It’s just that in this case, instead of investing money directly, you’re investing the time of the people on the team.
The reason that you want to diversify investment is because a balanced investment leads to better software. Imagine a team that never fixed bugs. While they’d certainly ship a lot of features, eventually their development would grind to a halt because the code they ship just wouldn’t work right. The opposite is also true; if you only ever ship bug fixes, your software will wither on the vine.
Unbalanced team investment leads to software that either never grows and evolves or doesn’t work for the people who rely on it. Neither is a good situation to be in. Instead, a good software development metrics dashboard will show where the team is investing their time. That gives executives the information they need to make sure that the team is working on the right things to accomplish the company’s goals.
Finding the Right Software Development Metrics Dashboard
Even when we recognize the best metrics for our team, we need to find the right tool to display all of them. The best information in the world doesn’t do any good if you can’t understand it. For many teams, the best dashboard isn’t just the one that shows the right data; it’s the one that’s the easiest to integrate with their existing tools. That’s where LinearB comes in. It measures all of the metrics in this post and more, and integrates directly with the tools you already use. You can sign up and start plugging your tools in today, for free. There’s no risk, and you can get a look at the health of your software teams in just a few minutes – or take a full tour with a demo. What are you waiting for?
