Software Development Metrics with LinearB
From DORA metrics to project forecasting, engineering leaders use LinearB to:
Identify workflow bottlenecks
Set and track quantitative team goals
Standardize business reporting on engineering health
Engineering leaders trust LinearB to improve their software development metrics


“Visibility into our engineering metrics has given our business critical telemetry and attribution for our engineering teams. In the past 6 months, we were able to reduce our cycle time from an average of 6 days to 2 days.”

Matt C.
Engineering Chief of Staff
|
Super.com
The Engineering Leader’s Guide to Building a Metrics Program
Inside this comprehensive guide, you’ll find:
The philosophy and ingredients of an effective engineering
metrics program
An overview of why metrics programs have been difficult to
implement in the past
Practical, step-by-step guidance on building an improvement
strategy from the ground up
Get My Free Copy
Why Engineering Leaders ♥ LinearB

Software Development Metrics
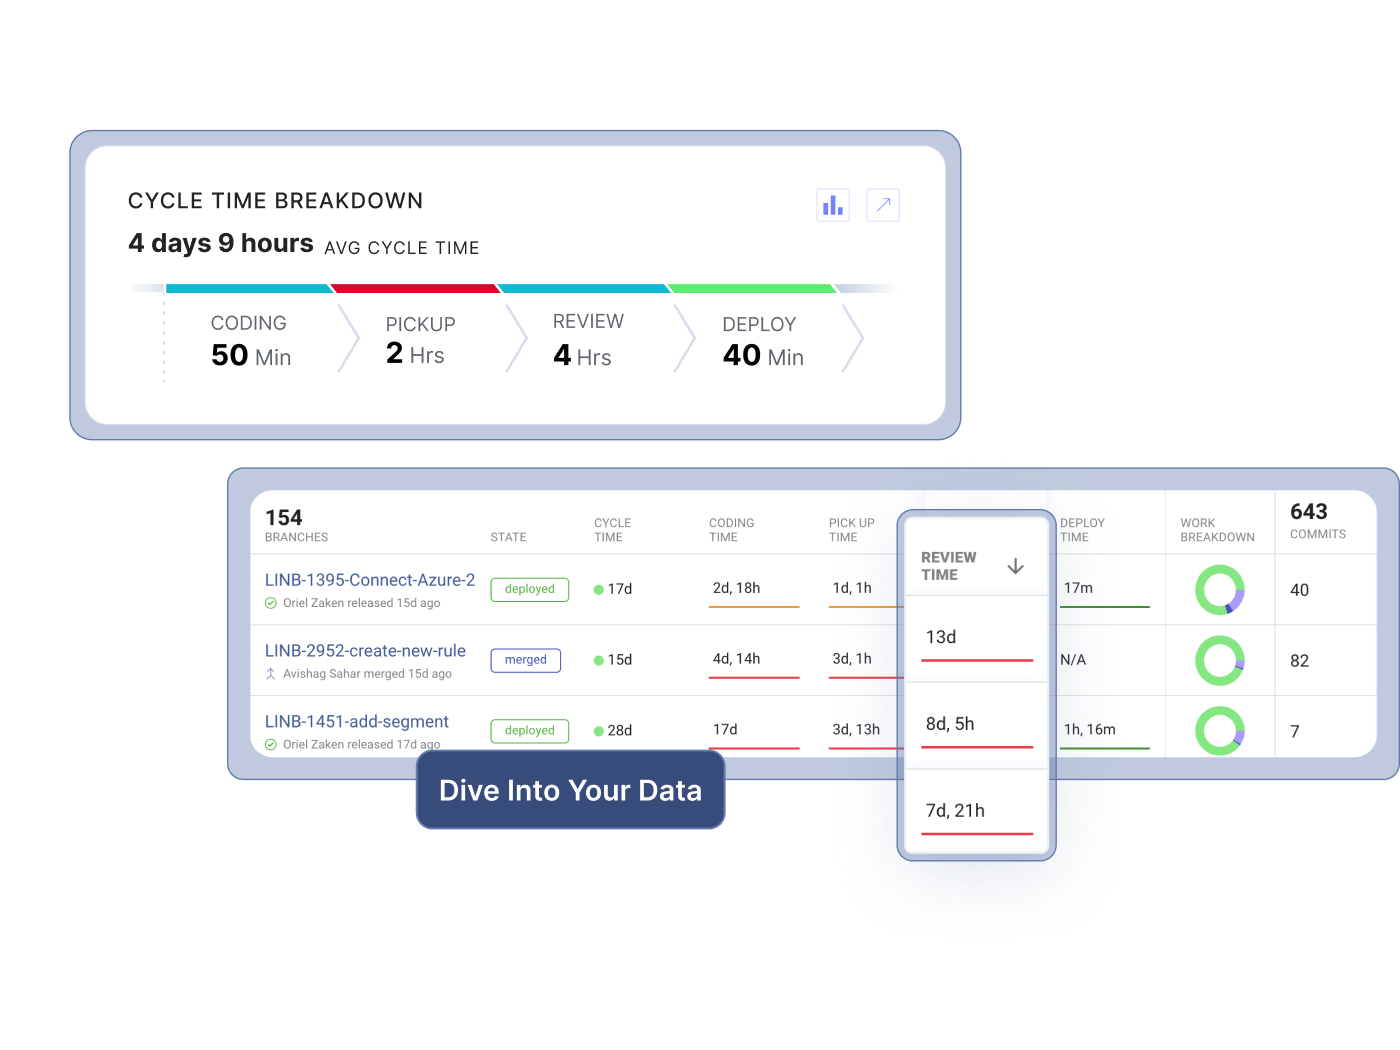
Every engineering metrics program begins with visibility across your tools. You’ll use these metrics to identify workflow bottlenecks, set data-driven team goals, and create improvement strategies for your organization.
Your metrics are aggregated from project management to post-delivery incident response, using standard integrations or API for a detailed and customizable view of DevOps workflows.
Explore impact metrics

Resource Allocation
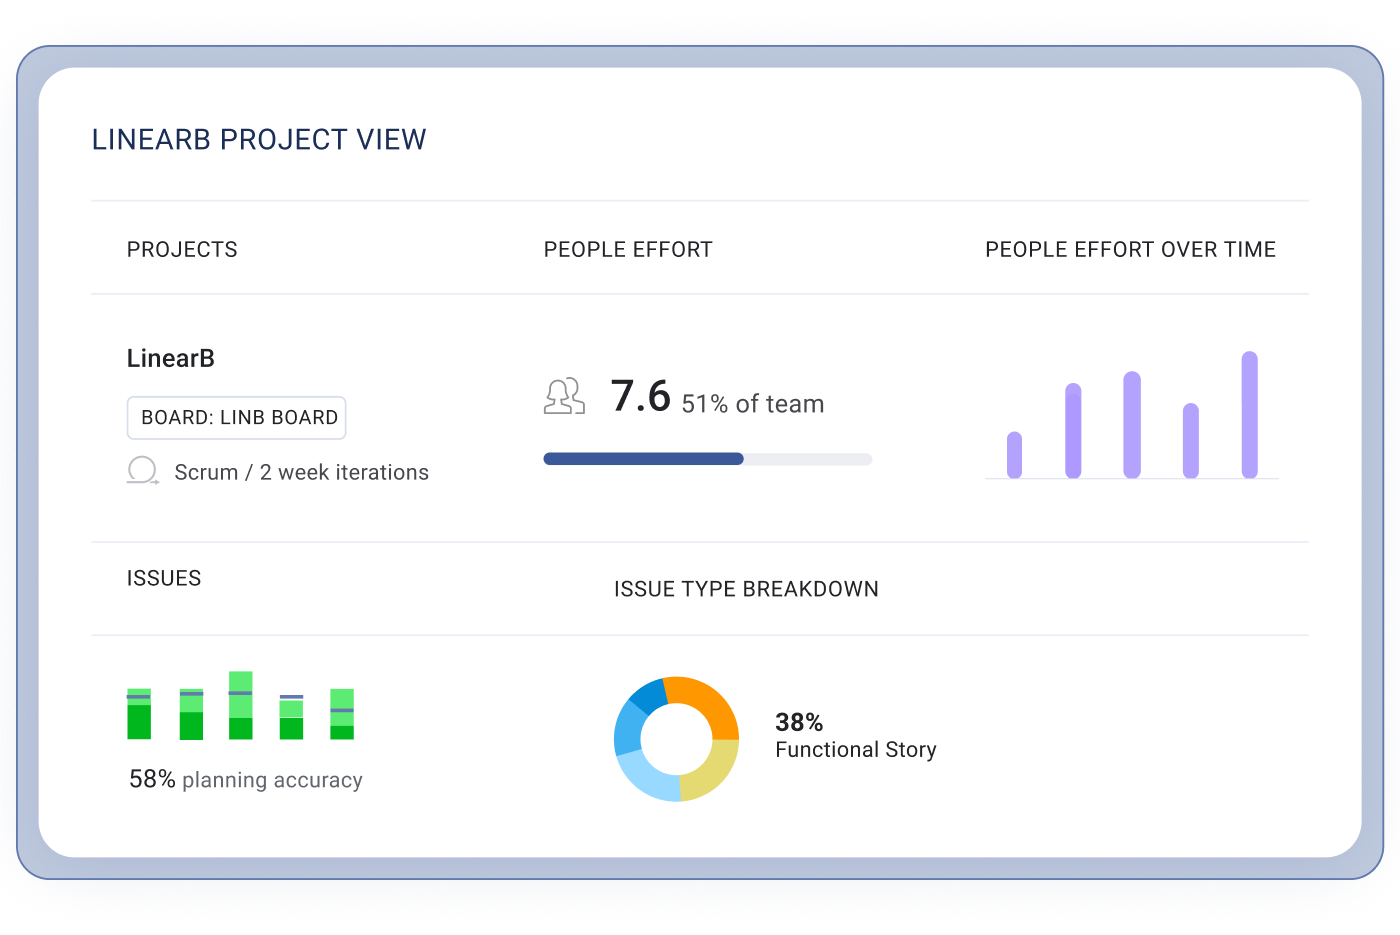
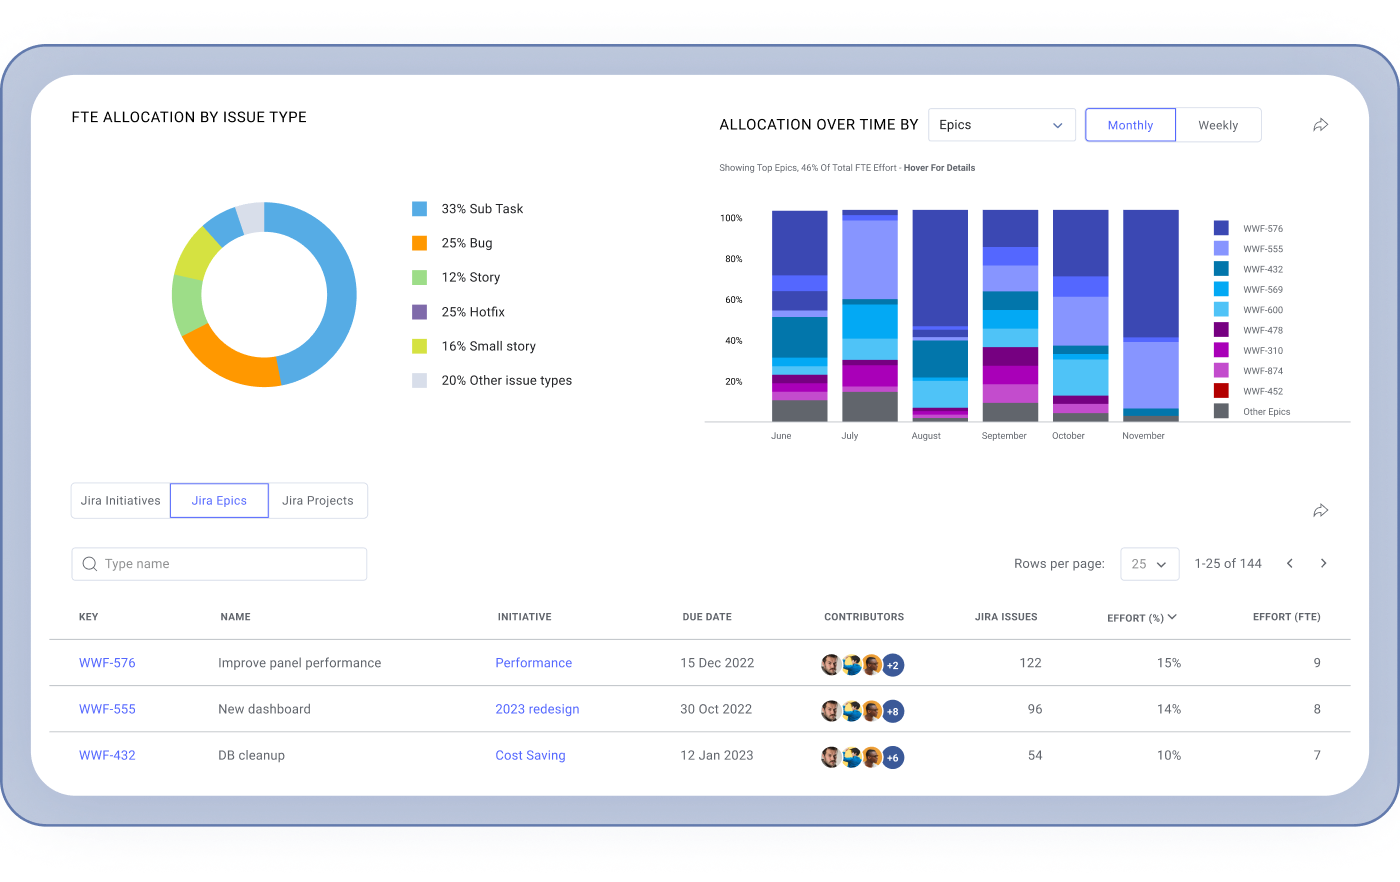
Align to business goals and visualize cost and effort with the resource allocation dashboard. This dashboard automatically configures your projects based on PM data, making visible the full-time employee effort (cost), and delivery status (business impact) into a single view.
This out-of-the-box view also has a flexible, self-service configuration so teams can adapt their unique workflows.
Explore Resource Allocation
Start your software development metrics program today with your Free DORA Dashboard
See more than GitHub control chart alone with LinearB

Business Goals & Reporting
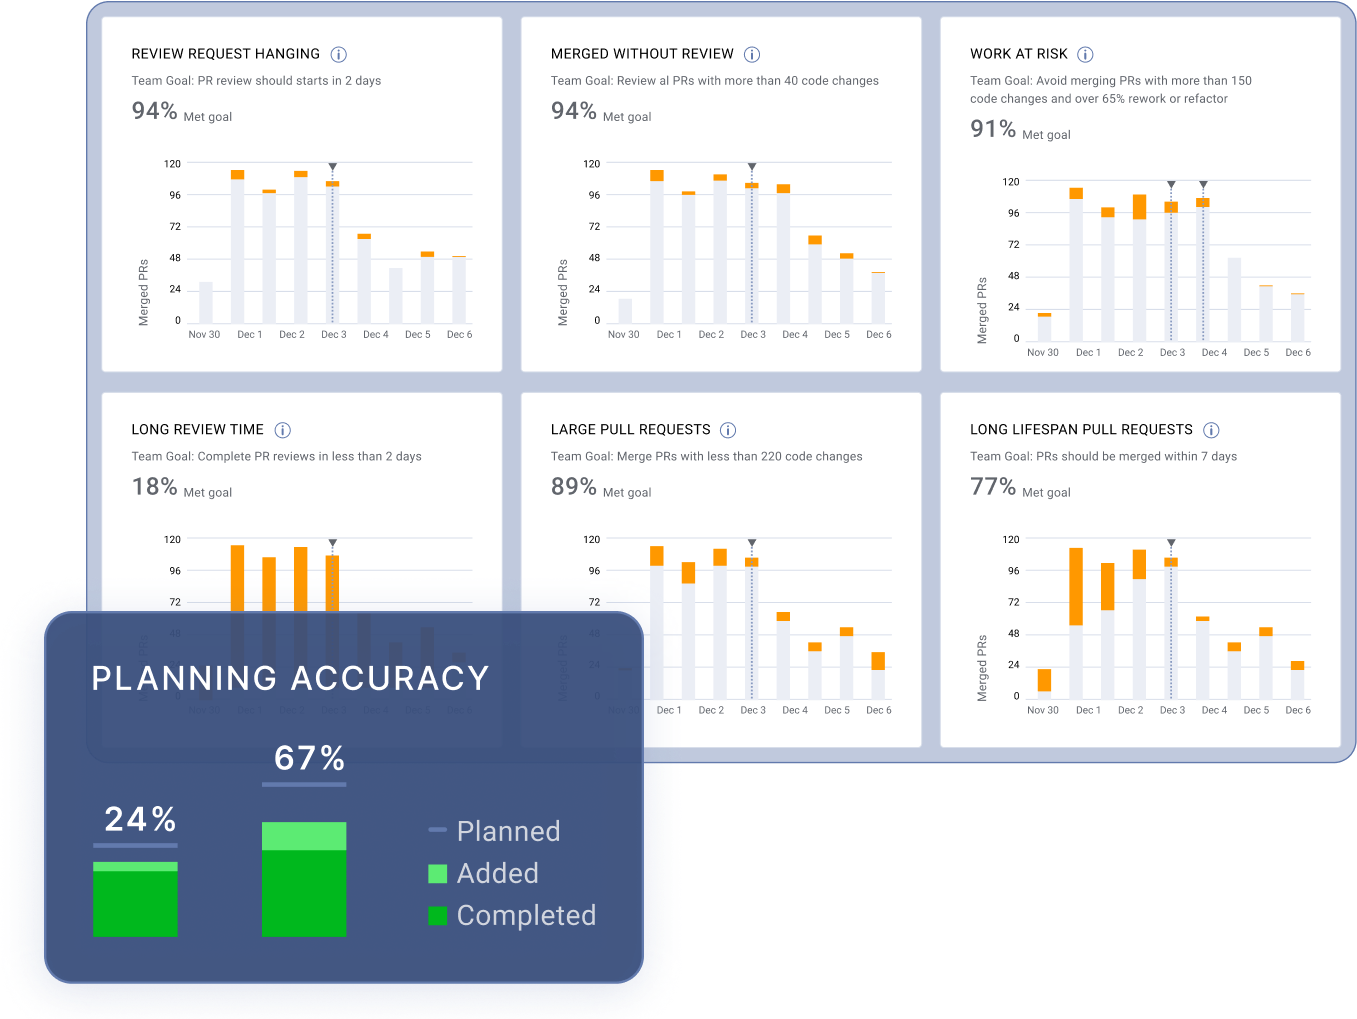
Improving engineering efficiency begins with the ability to set and manage teams goals. The team goals dashboard provides a custom view into how each team is performing against key software development metrics.
When teams set goals for pull request size, merges without review, review time and more, they receive notifications in their chat tool when a rule is breached - driving best practice behaviors everyday.
Explore Business Goals & Reporting
Don’t Just Take Our Word for It
"Great tool for data driven engineering leadership! LinearB helps us have objective performance metrics for engineering teams. Since we've started using it we've seen an increase in team performance."

Ezequiel R.
CTO
|
Lemontech
“LinearB provides quality and reliable metrics that allow us to proactively identify issues and provide feedback to the team with tangible data. LinearB centralizes data that usually lives in different tools (VCS, project management, etc.), thus making it easier to oversee several projects simultaneously."

Olivier R.
CTO
|
Nimble
“LinearB solves the challenge of deciphering complex development metrics. Its guidance and insights help us focus on key priorities, streamlining our workflow and enhancing decision-making."

Leif M.
VP of Engineering
|
Seven Peaks Software
"Great tool for data driven engineering leadership! LinearB helps us have objective performance metrics for engineering teams. Since we've started using it we've seen an increase in team performance."

Ezequiel R.
CTO
|
Lemontech
“LinearB provides quality and reliable metrics that allow us to proactively identify issues and provide feedback to the team with tangible data. LinearB centralizes data that usually lives in different tools (VCS, project management, etc.), thus making it easier to oversee several projects simultaneously."

Olivier R.
CTO
|
Nimble
“LinearB solves the challenge of deciphering complex development metrics. Its guidance and insights help us focus on key priorities, streamlining our workflow and enhancing decision-making."

Leif M.
VP of Engineering
|
Seven Peaks Software
"Great tool for data driven engineering leadership! LinearB helps us have objective performance metrics for engineering teams. Since we've started using it we've seen an increase in team performance."

Ezequiel R.
CTO
|
Lemontech
“LinearB provides quality and reliable metrics that allow us to proactively identify issues and provide feedback to the team with tangible data. LinearB centralizes data that usually lives in different tools (VCS, project management, etc.), thus making it easier to oversee several projects simultaneously."

Olivier R.
CTO
|
Nimble
“LinearB solves the challenge of deciphering complex development metrics. Its guidance and insights help us focus on key priorities, streamlining our workflow and enhancing decision-making."

Leif M.
VP of Engineering
|
Seven Peaks Software
Lead Confidently with a Software Development Metrics Program

Keep Using Your Favorite Tools
LinearB integrates with (and enhances) tools across your entire SDLC, from software development, CI/CD, chat, and issue tracking tools. We’re always adding new tools to our list, contact us for more information.
Explore Our Ecosystem

2023 Software Engineering Benchmarks Report
The 2023 Software Engineering Benchmarks Report was created from a study of 3,600,000 PRs from 2,800 dev teams across 64 countries.
Inside you’ll find:
Tactical advice on how to improve your team’s performance
How elite teams are performing against the four DORA metrics
Data insights broken down by organization, team, size, geography,
and industry
Grab your free copy
