For engineering leaders, you’re always trying to find ways to help your team ship more features. One of the most effective ways to make your team more productive and effective is to leverage key performance indicators (KPIs).
In this post, we’re going to look at the 5 KPIs every development team should be tracking as well as how you can track them in practice and leverage them to drive sustained improvement in your team.
But first, let’s establish why KPIs are valuable.
Table of Contents
- Why You Should Measure Software Development KPIs
- Limitations of Software Development KPIs
- Cycle Time
- Development Velocity
- Change Failure Rate
- Deployment Frequency
- PR Size
- Using KPIs to Drive Sustained Improvement
Why You Should Measure Software Development KPIs
KPIs are so useful because, when used correctly, they capture precisely and objectively how your team is performing. Sets of KPIs offer a “scorecard” on performance that you as an engineering lead can use to take targeted action that will make tangible improvements.
But in order for a KPI to be useful, it needs to be:
- Measurable: You can deduce and associate a numerical value from recording the amount/intensity of the metric.
- Clear: Every software development team member understands what the KPI is measuring.
- “Key”: Your team should agree that a metric significantly determines project success to classify it as a KPI.
Limitations of Software Development KPIs
Although KPIs give you specific, key measurements, they’re still limited: How do you know whether a number is good or bad?
For that, you need benchmarks. Using benchmarks with KPIs enables you to determine your performance and identify areas for improvement.
Historically, benchmarks were hard to come by in engineering teams. Many teams simply don’t collect this data. And even the teams that do don’t publish them for the whole world to see!
Engineering leads were forced to use previous experiences and bits and pieces they heard from colleagues at other companies to establish some imprecise and unreliable benchmarks – but what other choice did they have?
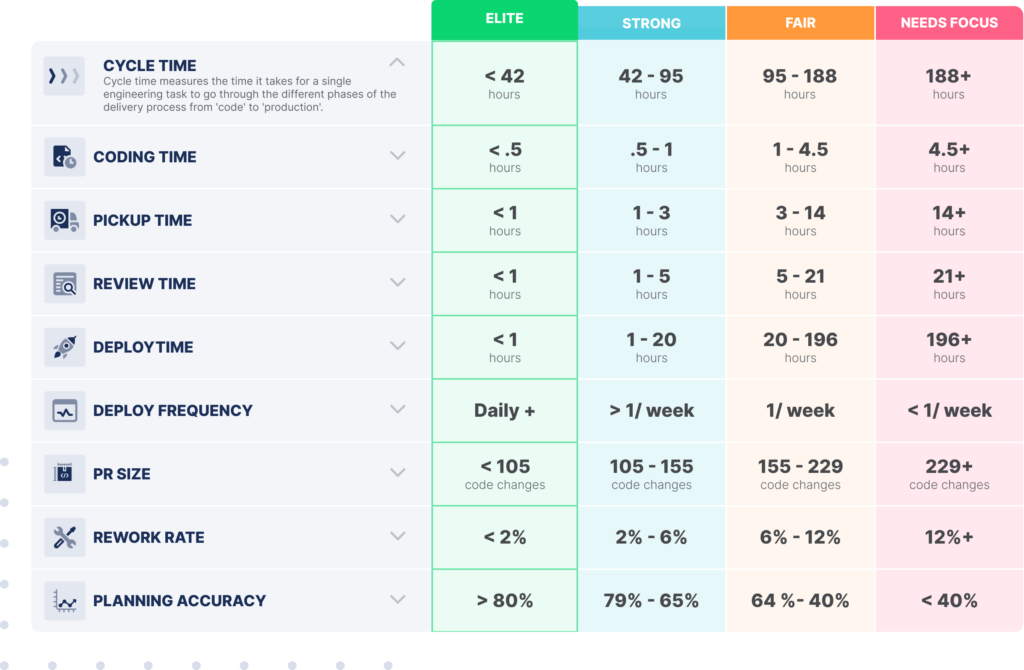
Now there is another choice. LinearB analyzed almost 2,000 development teams to establish benchmarks for 9 key engineering metrics. And we made these benchmarks available for free, because we believe that information this valuable ought to be accessible to everyone.
Now that we understand KPIs and the importance of benchmarks, let’s look at the 5 key metrics elite engineering leaders depend upon day in and day out.
1. Cycle Time
Cycle time measures the amount of time from work started to work delivered.
Cycle time matters because the lower it is, the more code your team is shipping. It is one of the four DORA metrics, which has become a widely-used set of metrics in devops.
Conceptually, measuring cycle time is straightforward: You can simply calculate the amount of time that passes between the first commit and production release. To do this, you can do some subtraction with timestamps.
Once you know your team’s cycle time, you can compare it to the benchmarks and determine how you’re performing. But that’s about all you can do. Without a more detailed breakdown, you can’t find the bottlenecks slowing your team down.
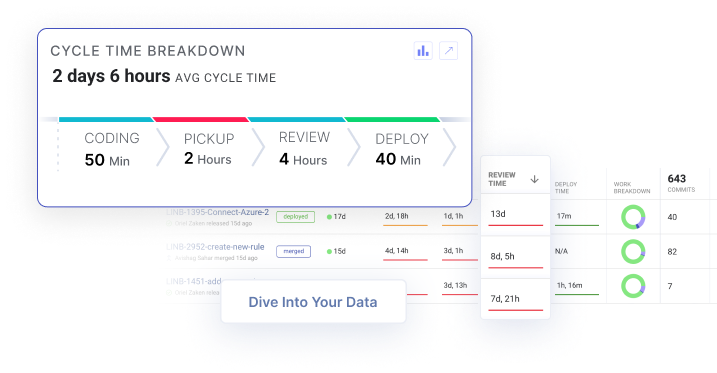
With LinearB it takes just minutes to measure not just your team’s cycle time, but also the lead time of the 4 phases of the software development lifecycle (SDLC). Using intuitive color codes, you can see at a glance how your team is performing at each stage, enabling you to spot bottlenecks instantly.
With just one click, you can go even deeper. For example, if you see that your average deploy time is high, you can click to see the issues with long deploy times that are driving that number. Once you’ve identified those problem issues, you can take targeted, effective action immediately.
2. Development Velocity
Development velocity tells you how much work your team accomplishes over a set period of time. In scrum, this length of time is a sprint, so this is also called the “sprint velocity” or the “agile velocity.”
The higher the development velocity, the more work your team will ship each sprint.
To measure development velocity, you have to add up all the work the team does. But how do you measure work?
Most teams rely upon story points. This is an estimation of the amount of effort it will take to complete a task, issue, or user story. The most common tool to keep track of the story points completed is a sprint burndown chart.
However, development velocity is the most dangerous metric, as explained in this post by LinearB’s Co-Founder, Dan Lines. This is because “work” is a subjective term and measures of it easily run into problems.
For example, an easy way to go faster is simply ship lower quality code. This may work for a little while, but eventually you are going to be confronted by all the technical debt you’ve accumulated and your development velocity will take a massive hit.
On the Dev Interrupted podcast, Ben Matthews told the story of how we learned the hard way the perils of focusing exclusively on boosting development velocity. It worked for a bit, then engineers started leaving the team:
You should never use development velocity by itself. Always pair it with a metric that will ensure that the quality of your code is not deteriorating.
Next, we’ll look at arguably the best code quality metric.
3. Change Failure Rate
Code quality is another dimension that is hard to measure because it is subjective. One feature of low-quality code is that it breaks often. That fact has been leveraged to generate an extremely useful metric for quality:
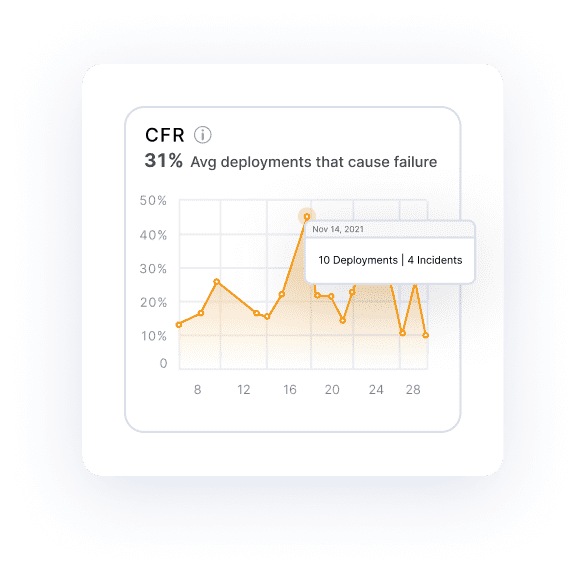
The Change Failure Rate (CFR) is the percentage of deployments that cause a failure in production.
A lower CFR means that your code has fewer bugs and, therefore, is higher quality.
Shipping high-quality code has so many benefits:
- Your application is more reliable.
- Fewer fires means less job stress for your developers.
- Your team can ship more features that create value for users.
- As a team lead, you can plan more accurately, which helps to foster alignment across the company and create a high-performing organization.
- You minimize the accumulation of technical debt, which promotes velocity over the long term.
Just like cycle time and the other DORA metrics, LinearB makes it super easy to establish and track your team’s CFR.
4. Deployment Frequency
Deployment frequency is how often a software team pushes code into production.
Here’s a quiz: If a team needs to ship 1,000 lines of code, is it better to deploy it all in go or to deploy it in 5 chunks of 200 lines each?
The answer is that it is better to deploy that code in 5 200-line chunks. By releasing more often in smaller increments, you reduce cycle time, and enable production-ready code to spend less time waiting and more time adding value for the user.
Smaller increments are also easier to fix. If the app breaks after a small deployment, you know exactly which code you need to look at. But if you release multiple increments simultaneously, there’s a lot more code you have to inspect to root out the cause.
Fast deployment team also fosters a culture of speed in your team. If your engineers know that their code is going to have to wait a long time to be deployed, they’re going to be less motivated to move efficiently through the other stages of the SDLC.
Often, long deploy times are caused because only senior members of the team are allowed to merge code into production. While this is well-intentioned, it can really slow you down.
Maria Gutierrez, VP of Engineering at Twitter, learned this lesson firsthand. On the Dev Interrupted podcast, she shared the story of the time she realized she needed to stop being a bottleneck and start entrusting her developers with more responsibility:
With LinearB, you get deployment frequency measurement right out of the box. You can use it alongside other metrics in a custom dashboard to have a balanced, comprehensive understanding of your team’s development processes.
5. PR Size
You may be asking yourself, “Really? PR review size is a key metric?”
LinearB’s answer is: It absolutely is.
Here’s why: Our extensive analysis of engineering organizations revealed that PR review times slow down cycle times to a shocking degree. We found that on average, PR reviews take 4 days!
We also found that:
- 50% of pull requests were idle for 50.4% of their lifespan
- 33% of pull requests were idle for 77.8% of their lifespan
Take a moment to think about how much time you spend optimizing pipelines or algorithms to shave off some seconds or minutes. All the while, code is just sitting there, waiting to be reviewed, for days at a time.
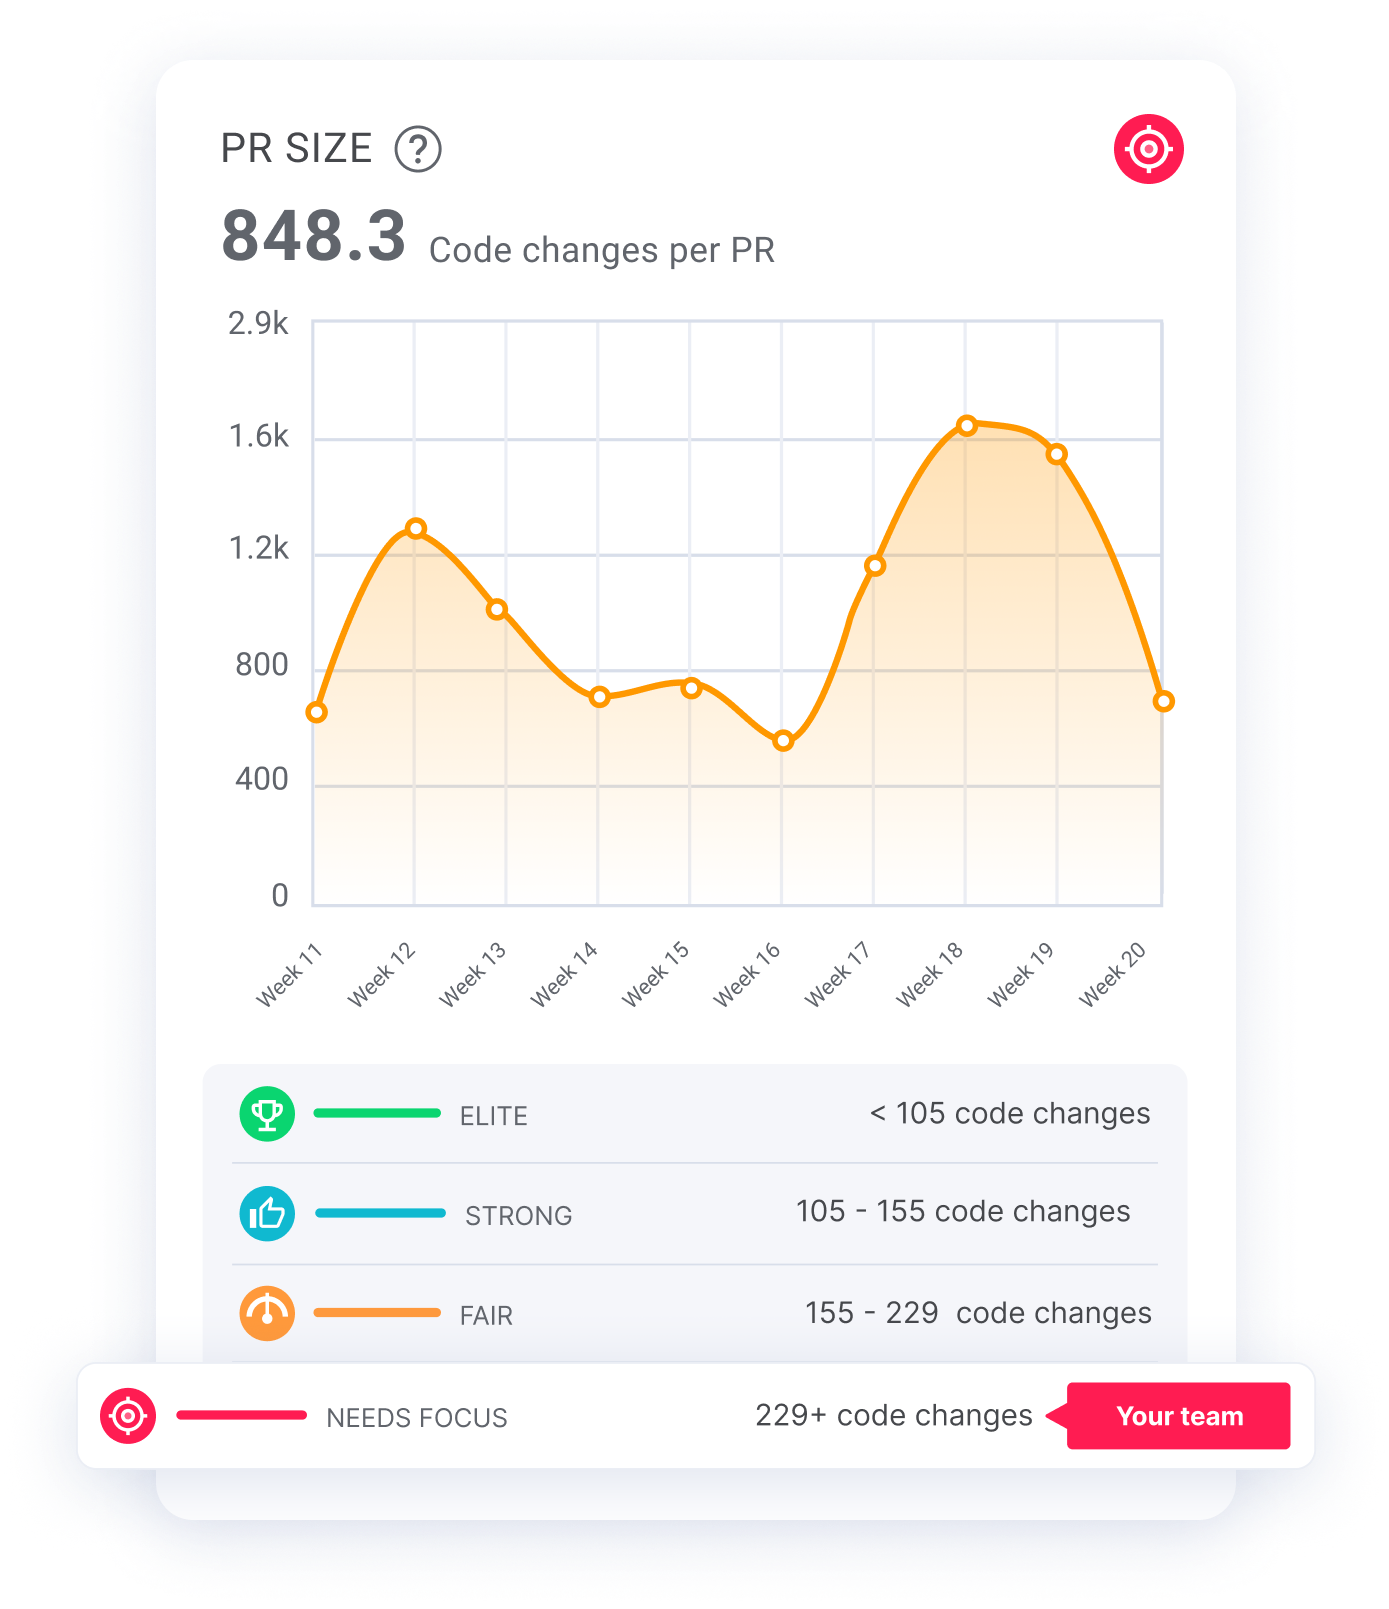
Our research also revealed the main determinant of PR review time: PR size. Big PRs take more time to review. That, in turn, causes the reviewer to put off conducting the review until they have a big chunk of time.
If you take just one thing away from this post, let it be this:
To speed up your cycle times, reduce your PR size!
LinearB can help you accomplish this in a number of ways. First, we’ll track the size of PRs on your team. Using our benchmarks, you can determine how you’re performing. (Ideally, your PRs are less than 225 lines of code). But this is just the start for what you can do with LinearB.
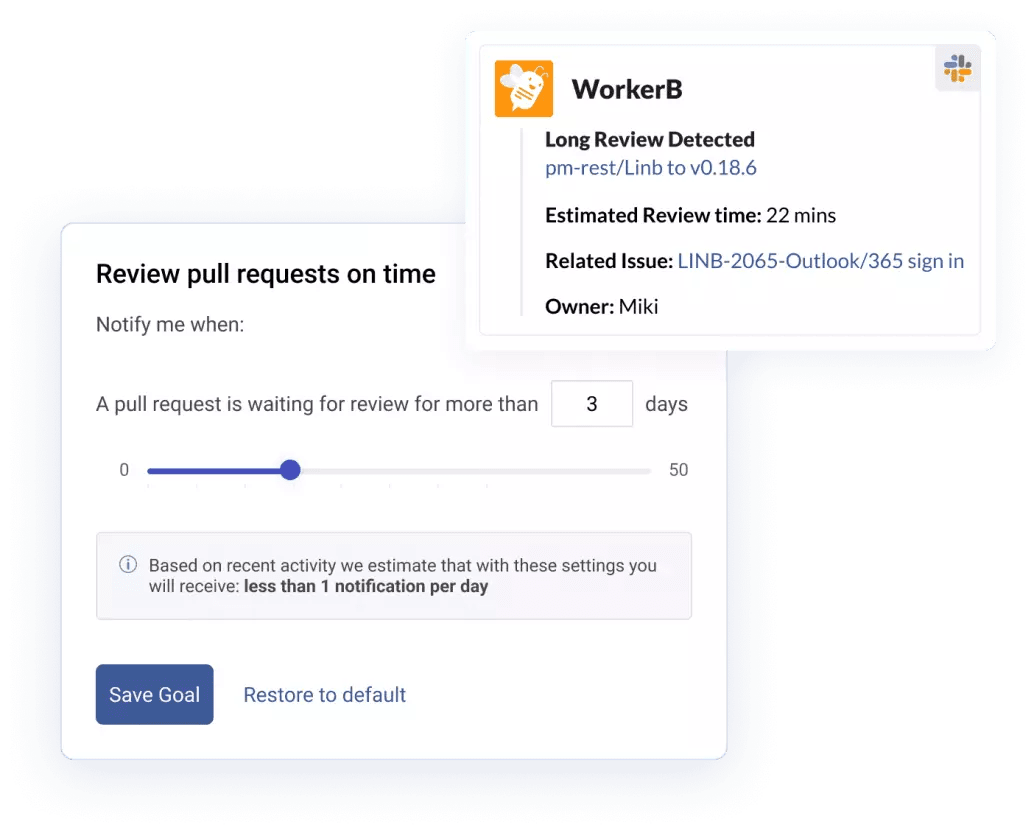
With our Team Goals system, you and your team can set specific goals for improvement. We recommend moving from one tier (for example “Fair” to “Strong”) over 1 quarter. LinearB will show your progress towards that goal in easy-to-read charts.
LinearB also has the tools that empower your developers to improve. Our WorkerB automation bot will send out notifications if a PR has been created that is larger than your goal. WorkerB can also send out reminders if a review has sat idle for too long.
Using KPIs to Drive Sustained Improvement
KPIs and metrics are so valuable because they’re precise measurements that you can understand quickly and track over time.
But historically there have been a number of challenges to leveraging KPIs to optimize engineering teams:
- Which KPIs should you be using?
- How do you measure those KPIs in practice?
- How do you leverage those KPIs to improve?
I hope that this post has given you answers to those questions.
LinearB is the ultimate tool for using KPIs to refine the processes on your development team. To learn about all the ways LinearB can empower you to start shipping more features faster and delivering on your promises, schedule a demo with us today.