What does high-quality code look like? Developers like to say that you know it when you see it. High-quality is free of code smells. Words like “elegant” and “concise” are often used. It’s what separates a beginner engineer from an experienced one, a good engineer from a great one.
But what is the “it” that you’re seeing? How do you define high-quality code? Harder yet, how do you measure it?
These are the questions we’re going to answer.
Table of Contents
- Why does code quality matter?
- Dimensions of (internal) code quality
- Measuring code quality
- Improving code quality
Why does code quality matter?
Code quality matters because code is expected to do something, often something that people pay for and depend upon. Like the rest of us, production code has a job to do in the world. High-quality code does a good job, and low-quality code does a bad job.
But this is just one dimension of software quality. Software development thought leader Martin Fowler makes a distinction between external and internal code quality.
External quality is how code performs out there in the world. That is, how well does it do its job? Code with high external quality is reliable and performant. Users can expect it to work all the time and perform its function accurately and quickly.
Internal quality refers to the quality of the code from the inside, when developing software. Once you peer under the hood, how good is the code? Is it logical and clear? Is it – and here are those words again – “elegant” and “concise”?
It’s easy to measure external code quality. Measuring downtime is a straightforward way. But determining internal code quality is more subjective. How do you quantify elegance and concision?
Dimensions of (internal) code quality
To measure internal code quality, you need to break it down. With a more granular rubric, you can start to measure rigorously.
6 key dimensions of code quality
- Readability – How easy is it for someone else to read and understand your code?
- Flexibility – How easy is it for your code to be adapted?
- Reusability – How easy is it for your code to be reused?
- Scalability – How easy can your code be scaled up to more users?
- Extendability – How easily can your code be built upon?
- Maintainability – How easy is it to fix bugs in your code and keep it up to date as other parts of the codebase change?
You may notice a theme in the description of each dimension: Easy. Internal code quality really comes down to this: How easy is it to work with your code?
There is generally a trade-off between quality and quantity: More food or fancier food? A bigger house or one in a better location?
But with code, this trade-off doesn’t exist, at least not in the longer term. You can have both high throughput and high-quality code.
How? As high-quality code is shipped, the quality of the codebase as a whole rises. This means that it becomes easier to maintain the existing source code as well as add to it. LinearB’s co-founder and CEO, Ori Keren, calls this counterintuitive relationship between quality and speed the “bicycle syndrome” – the faster you go, the more stable you are.
Measuring code quality
There are two types of indicators: lagging and leading.
Lagging indicators update after the thing they are measuring changes. That is, lagging indicators capture what has already happened.
Lagging indicators
- Story points completed – In Agile, a key lagging indicator is story points completed. It is a way of measuring how much was accomplished during a sprint.
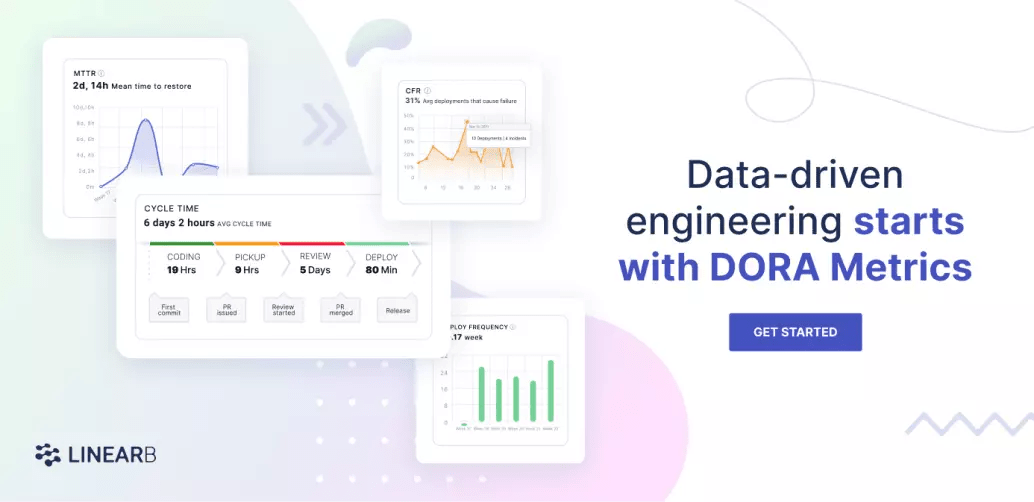
- Mean Time to Restore (MTTR) – How long it takes an organization to recover from a failure in production
- Change Failure Rate (CFR) – The percentage of deployments causing a failure in production
MTTR and CFR come from the DORA system, and they are measures of external code quality. They tell you how well your code is performing for the end-user, making them crucial metrics. With LinearB, you can easily start tracking both.
But it is risky to rely solely on lagging indicators because they don’t prevent issues from occurring in the first place. This is why you need leading indicators.
Leading indicators
Leading indicators change before the thing that they are measuring goes into effect. In a software context, leading indicators will change before code goes into production. They allow you to be proactive in preventing bugs, as opposed to reactive, fixing bugs once they’ve already caused problems in your application.
Static analysis tools evaluate code before it’s pushed live. Two in particular help you improve code quality:
- Linting: Linters will spot style errors or inconsistencies and automatically fix as many as they can. They’re a great tool for maintaining particular style conventions and spotting those tiny typos that can bring down an entire app.
- Cyclomatic complexity – If this, then that. But if that, then this. If-then after if-then, forks on forks on forks. We’ve all spent time parsing complex logic trees. Cyclomatic complexity measures the number of execution paths through a piece of code. In other words, how many cases are there?
This is useful in helping you make sure you have complete coverage with functional tests. But high cyclomatic complexity also tells you that your code is going to be hard to work with.
If a bug originates in a piece of highly complex code, you will have to carefully work through the logic to find the root cause. And what if you need to add a new case? You may have to weave into already-complex code a whole new branch of logic.
But static analysis only gets us so far. Linting just improves style, and cyclomatic complexity only addresses complex logic trees.
What about everything else? This is where LinearB comes in. Our tool analyzes diffs to break down their content into three categories.
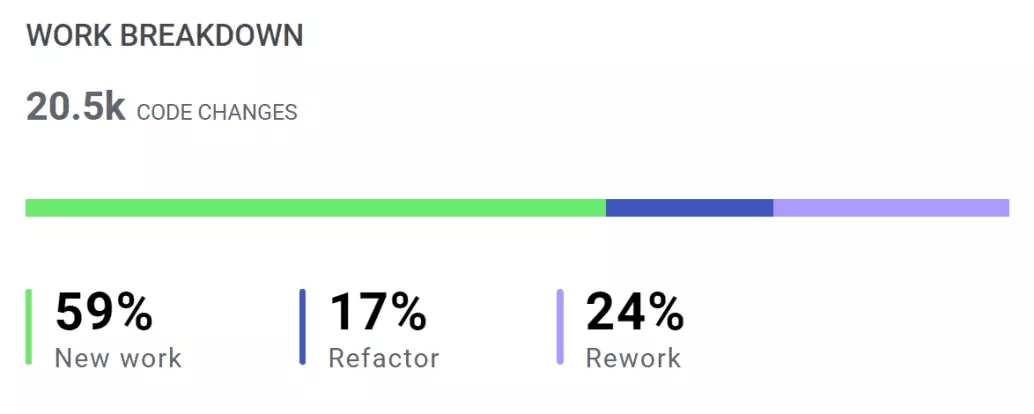
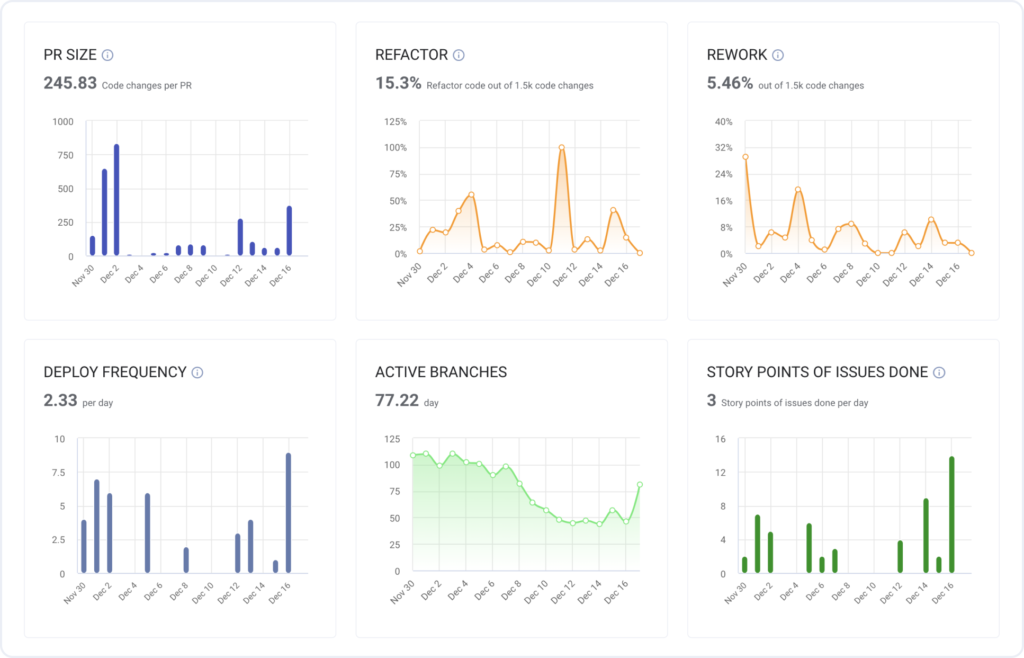
LinearB’s Work Breakdown
1. New work – New code to be added to the codebase
2. Refactor – Existing code that was modified
3. Rework – Code newer than 21 days that was modified
These metrics enable you to finally answer that eternal question: Where are we spending our time?
Let’s say that you find that the majority of your diffs consists of Refactor and Rework code. Then this may reveal that your development lifecycle could be improved. But it could also reveal that you’re paying off technical debt.
Whatever the case, this knowledge helps you to know where your resources are going so that you can decide whether that is the right allocation. And you can clearly communicate this allocation to the rest of the business – just show them the Work Breakdown for your project as a whole!
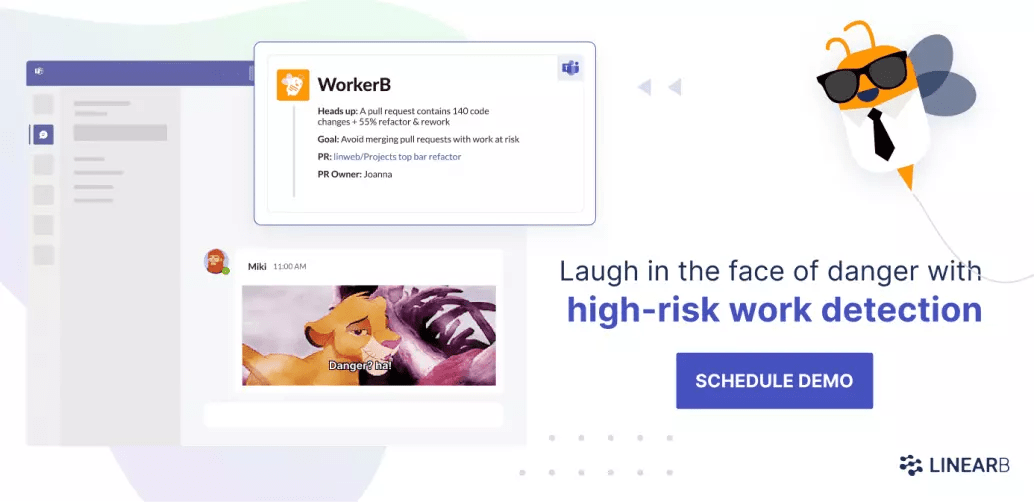
LinearB has a whole suite of other built-in features that leverage this data. One is the High-Risk Work Alert.
LinearB will flag a diff as “high risk” when it has more than 100 changes and 50% of those changes are either Refactor or Rework code. (But these are just the defaults. You can customize the thresholds.)
The High-Risk Work Alert tells you, “Code is about to be merged that could break things. You may want to take a final look.”
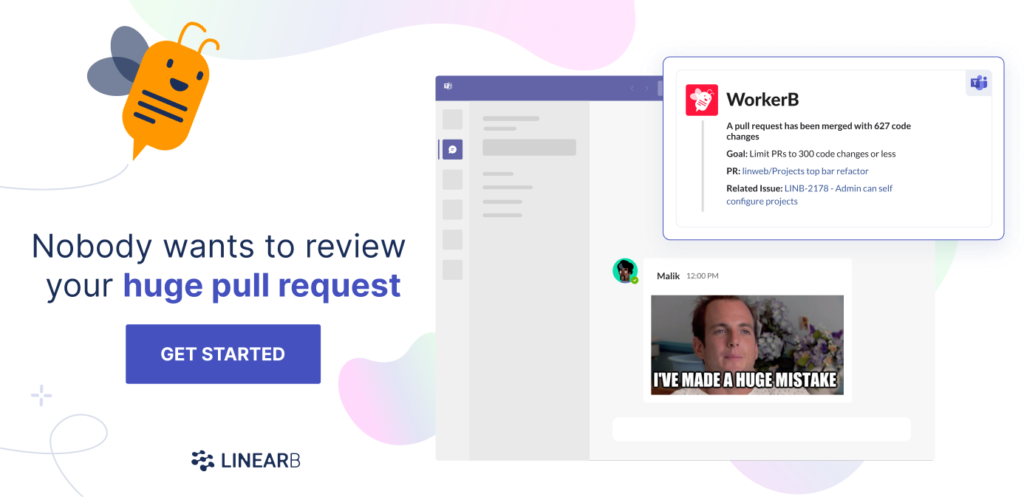
PR Size is another leading indicator that helps you to promote high code quality. Everyone knows that big PRs are annoying. But actually, that annoyance causes big problems because, understandably, we tend to put off reviewing big PRs. This slows down the development pipeline.
Check out this presentation from our CEO, Ori Keren, at The DevOps Conference on why we believe PR Size is the most important indicator of development pipeline health.
LinearB analyzed 773,000 pull requests and 3.9 million comments from 26,000 developers. We found some alarming numbers about just how time-consuming PRs are:
50% of pull requests were idle for 50.4% of their lifespan
33% of pull requests were idle for 77.8% of their lifespan
It gets worse.
The average cycle time was 6 days and 5 hours. The average pull request review time was 4 days and 7 hours.
This means that on average, PR review time accounted for almost 70% of cycle time. And of that 70%, the PR spent the majority of it sitting idle!
These are literal days that are being wasted, each and every cycle. This is especially problematic in a continuous integration and development paradigm where changes are meant to be pushed constantly.
Smaller PRs get reviewed faster – much faster. I’m talking 20X faster.
It’s really that simple: Keeping your PRs small makes the reviews happen faster which will significantly speed up your cycle time.
Although it’s simple, actually developing the habit – especially in a whole team – is hard. But with LinearB, it becomes easy. LinearB’s WorkerB bot will alert you when a large PR has been created. We will also track the size of PRs over time, and compare these to the goals you’ve set in our platform so that you can bring about cultural change among your development team members.
Our research shows that big PRs also tend to not be thoroughly reviewed. Just like PR Size, LinearB also tracks Review Depth so that you can know when a diff only got a cursory review – or no review at all! This metric is also useful in measuring the benefits of reducing PR size. As you drive down PR size, you can watch code review speed and quality rise.
Improving code quality
Measuring code quality is an important first step. But it’s still a first step. What really matters is what you do with that data.
LinearB’s engineering intelligence tool not only gives you the data but helps you turn that data into results.
You start by measuring your baseline, and then you set goals for improvement – like reducing PR size or improving review quality. LinearB tracks your performance against those goals and presents the data in an easy-to-understand dashboard. We also provide you tools that help you achieve your goals, like our WorkerB bot that automatically alerts you of things like when you need to conduct a review or when a diff is high risk.
Metrics + Goals + WorkerB = Improvement
This is the value that LinearB provides.
Better development processes not only improve speed and quality. They also make your throughput more predictable. With LinearB you can perform and plan better, enabling you to always keep alignment across your company.
To see how LinearB can transform the way you work, get in touch to set up a demo.