There are countless resources on software quality. If you’re reading this, you probably have an idea of what high- or low-quality software is. But defining it seems a lot harder. And if you identify low-quality software but others disagree, how can you avoid endless discussions? Let’s look at how we should understand software quality and how to measure it more objectively.
Different Kinds of Software Quality
The term software quality can cover many things. I like Martin Fowler’s idea of external and internal quality.
External software quality is about the user experience, from the user interface to bugs. An ugly user interface isn’t pleasant to work with, and an application riddled with bugs won’t be regarded as a high-quality application.
End users have no way of knowing if the code and architecture are pleasant to work with for the developers—or if the architecture allows for easy modification and addition of features. And that is the internal quality of software.
Why Internal Software Quality Matters
In the same post, Martin Fowler goes on to explain why (internal) software quality does matter. High-quality software (remember, internal) is easier and faster to modify or extend. And so it’s cheaper as well.
Low-quality software can be written faster, but only at the beginning of the project. After several weeks (not months or years), a good architecture and clean code will be easier for developers to work with. Which means they’ll be able to implement new features faster.
Code with low internal quality slows down teams and frustrates all stakeholders.
Why External Software Quality Matters
A beautiful UI may be fairly subjective, but bugs are bugs. Users want a responsive application that performs the tasks they need to be done. That is why we’ll also have a look at metrics that can measure our external quality, at least regarding the stability of our application.
Identifying Software Quality
Experienced developers will recognize low- or high-quality code. They’ll also be able to keep up the quality easier. But there remains a high level of subjectivity to what quality is exactly: How do you know, for example, when a class is a “god class” or that it actually needs to contain all that functionality?
How can we track the quality of our code? Code that is “good enough” for me might not be for you.
It’s Not About Style
We can rule out what software quality is not. It’s not coding style: indenting, where to put the curly braces, etc.
These pieces of code have exactly the same internal quality:
function add(x, y) {
  return x+y;
}
function add (x, y)
{
    return x + y;
}
I recommend agreeing on a style in your project, though one isn’t necessarily better than the other.
Measuring Software Quality
But then how can we capture the idea of high or low quality in our software? There are many options available. Let’s have a look.
Cyclomatic Complexity
Cyclomatic complexity measures how complex a piece of code is by calculating how many different paths there are through the code. The higher the number, the more complex your code will be.
Take this piece of code:
function calculate(x, y) {
    if (x >= 20) {
        if (y >= 20) {
            return y;
        }

        return x;
    }

    return x + y;
}
If we map this out in a flow graph, it looks like this:
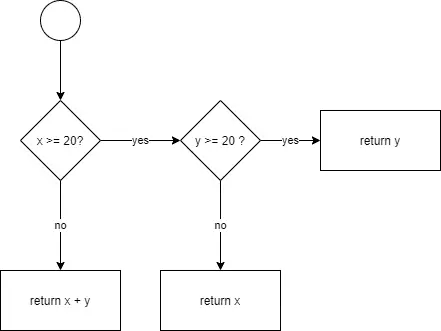
The formula for cyclomatic complexity is as follows:
E - N + 2
E is the number of edges (shapes in the above diagram), and N is the number of nodes (arrows in the above diagram). So in our case, 6 – 5 + 2 = 3. And indeed, there are three possible paths through this code.
So what’s the limit? Technically, there is no limit, but for humans, things can quickly get out of hand. The original document recommends keeping cyclomatic complexity under 10, though there are teams that work well with a slightly higher limit.
Maintainability Index
The Maintainability Index is a metric that uses cyclomatic complexity but factors in the number of lines of code as well as a metric called the Halstead volume. It’s not important to get into the details here, but in this case, a higher number is good.
Originally, this metric could not be higher than 171. In Visual Studio, Microsoft rebased the number to be between 0 and 100 so that the score is more clear to developers.
Dependencies
It’s practically impossible to develop a piece of software without dependencies. Your code probably depends on multiple libraries and frameworks that are regularly updated. The maintainers add and remove features, fix bugs, improve performance, and patch security vulnerabilities.
Older libraries and frameworks often have a negative effect on quality. Security vulnerabilities are an obvious risk. But your application might also miss out on opportunities to become more stable and responsive or add new features.
As usual, there are plenty of tools out there that can help you in identifying the state of your dependencies:
- libyear for a variety of languages
- the dotnet CLI for .NET
- npm audit and npm outdated for JavaScript
- the Versions Maven Plugin for Java (and a more or less equivalent solution for Gradle)
- Sonatype for several solutions to track your dependencies
And I’m sure there are equivalents for whatever language you code in.

The SQALE Method
SQALE is short for “Software Quality Assessment based on Lifecycle Expectations.” It’s a language-independent method to assess the quality of the code. It looks into things like the following:
- changeability
- maintainability
- portability
- reusability
- technical debt
The exact details are quite complex, but you can use tools like SonarQube or NDepend. The most interesting thing about the SQALE method is that it doesn’t just focus on a single aspect. It will give you a complete picture of the code quality and an estimate of how much effort is required to remediate any issues. These issues are put in different categories like maintainability, testability, or reliability.
Code Coverage
The previous metrics measured internal quality. Now let’s move on to the external quality of our code.
Code coverage is a well-known metric. It’s calculated by running your tests and keeping track of the code that was executed. It can be split up into statement, function, branch, and line coverage.
Consider this piece of code:
var x = 10; var y = 12;
These are two statements, but only one line. Statement coverage is better than line coverage, although you should probably not write two statements on one line because of readability.
Next, take this code:
if (input === x) {
    return y;
} else if (input === y) {
    return x;
}
It contains five lines of code, five statements, and two branches.
Finally, function coverage is about how many functions are covered.
An application with high code coverage will be a more stable application with fewer bugs. It doesn’t mean there won’t be any, but developers will be more confident making changes to the code.
Load Testing
Another metric to check the external quality of your code is load testing. This is especially useful for web applications or web APIs. There are many tools out there, but in essence, they all send multiple requests to your application in a short time. It allows you to see how many users could simultaneously use your application before it slows down—or even crashes.
Performance Testing
Performance testing can measure the quality of your code by running the application and reporting on the performance of each function or method. It can help you pinpoint pieces of code that take too long to execute, ones that use too much memory, or even if there are memory leaks in your code.
Code Analysis Tools
I’ve already mentioned some tools in the sections above. (You can read about all our favorite tools in this blog post). Each of the above metrics has tools available in many languages. But before we close on this post, let’s cover two more categories of tools.
Static code analysis is a technique to analyze source code without executing it. Dynamic analysis is done by running the application. We can put most of the above metrics in one of these categories. For example, code coverage and load testing are dynamic analysis tools because they require us to run the code. But cyclomatic complexity is a static analysis metric.
Static code analysis tools often include long lists of rules that will help you write better code. For example, they can find unused variables and functions, functions with too many parameters, or even security vulnerabilities. Many will also allow you to import dynamic code analysis results like code coverage.

Where Do You Begin?
You might be overwhelmed with the range of metrics and tools that are available to you. To make things worse, there are countless more metrics and tools available as computer scientists, companies, and developers continue to track the quality of their code.
Software is also more than just code. Metrics like mean time to restore and mean time between failures not only indicate code quality issues but also look at your software delivery pipeline. LinearB also offers metrics that provide insights into code quality like High Risk Work and High Rework (which you can see at work in a demo).
So where should you begin? Start by acknowledging that software quality is a subjective matter. It’s better to use objective metrics. Pick those you find relevant, set up the tools, and incorporate this into your daily routine. Establish a minimum level and check regularly, ideally as part of your continuous integration pipeline.
If you’re starting with low-quality code, that’s fine. Set the minimum level so that your build only breaks if you drop below that low level. Then, start improving your code. Let the static code analysis tools show you where to start in your codebase. And as you improve the metrics, raise the bar by increasing that minimum level.
If you steadily do this, you’ll reach a point of software quality that you didn’t think was possible.