

What Is Quality For Software Teams?
It’s a weird question to actually ask yourself as a software engineering leader. Quality for software teams can mean different things for different leaders and it depends from what perspective you look at it from.
Moving one step beyond traditional measures, like uptime or bugs, think of quality as a tool that drives efficiency for your engineering organization. When you strategically plan, measure, and take tactical actions to achieve “high quality”, the end result should improve operational and delivery efficiency for your teams.
Why Does Quality Actually Matter?
Simply, quality is either the ultimate efficiency advantage or disadvantage for software teams. Efficient software teams deliver more value and more consistently hit delivery deadlines.
High quality leads to more efficient performing software teams. Efficient software teams deliver more value to production, have less customer issues, are able to continuously improve, and tend to have “happy/engaged” software developers. High quality creates a virtuous reinforcement cycle.
On the flip side, low quality leads to inefficient performing software teams. Inefficient software teams tend to miss delivery deadlines, struggle to repeatedly deliver code to production, are bogged down by customer issues, do not have time for continuous improvement, and can have demoralized software developers. Low quality feels like your team is stifled and creates a negative cycle.
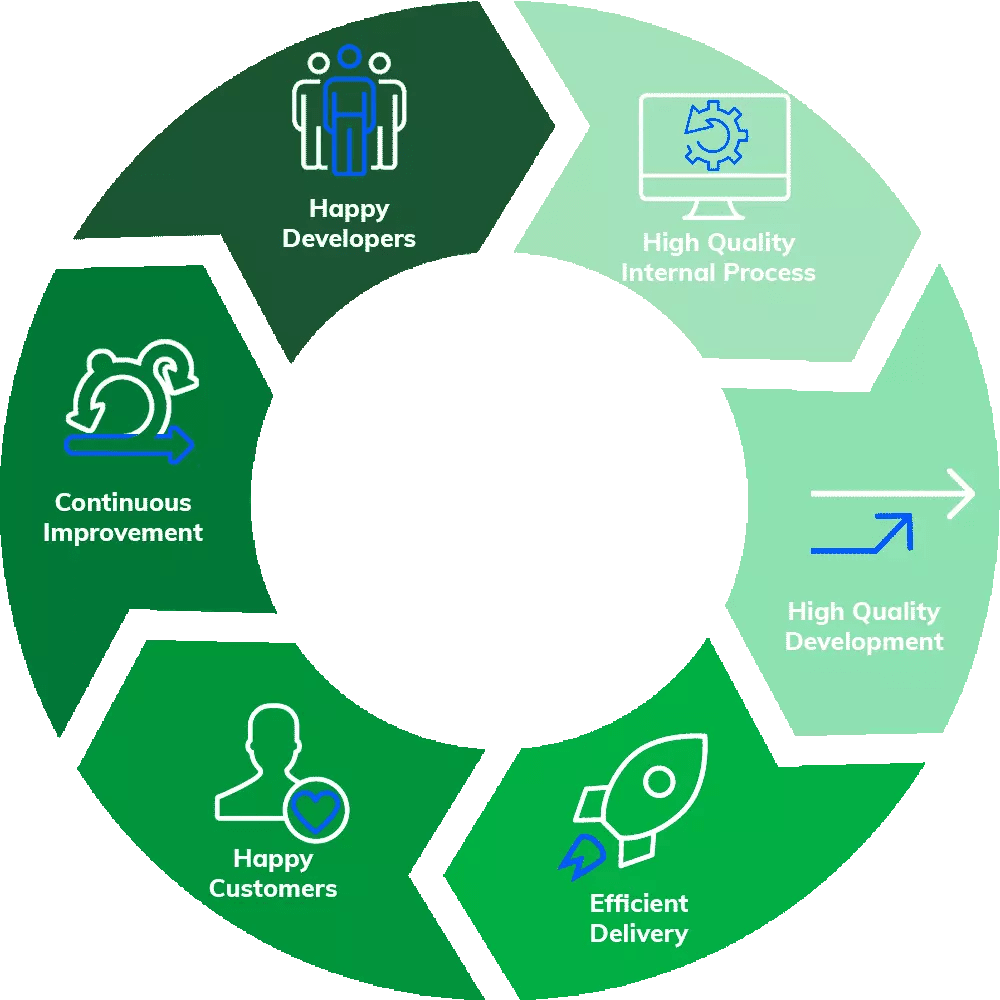 High quality creates an efficient virtuous reinforcement cycle
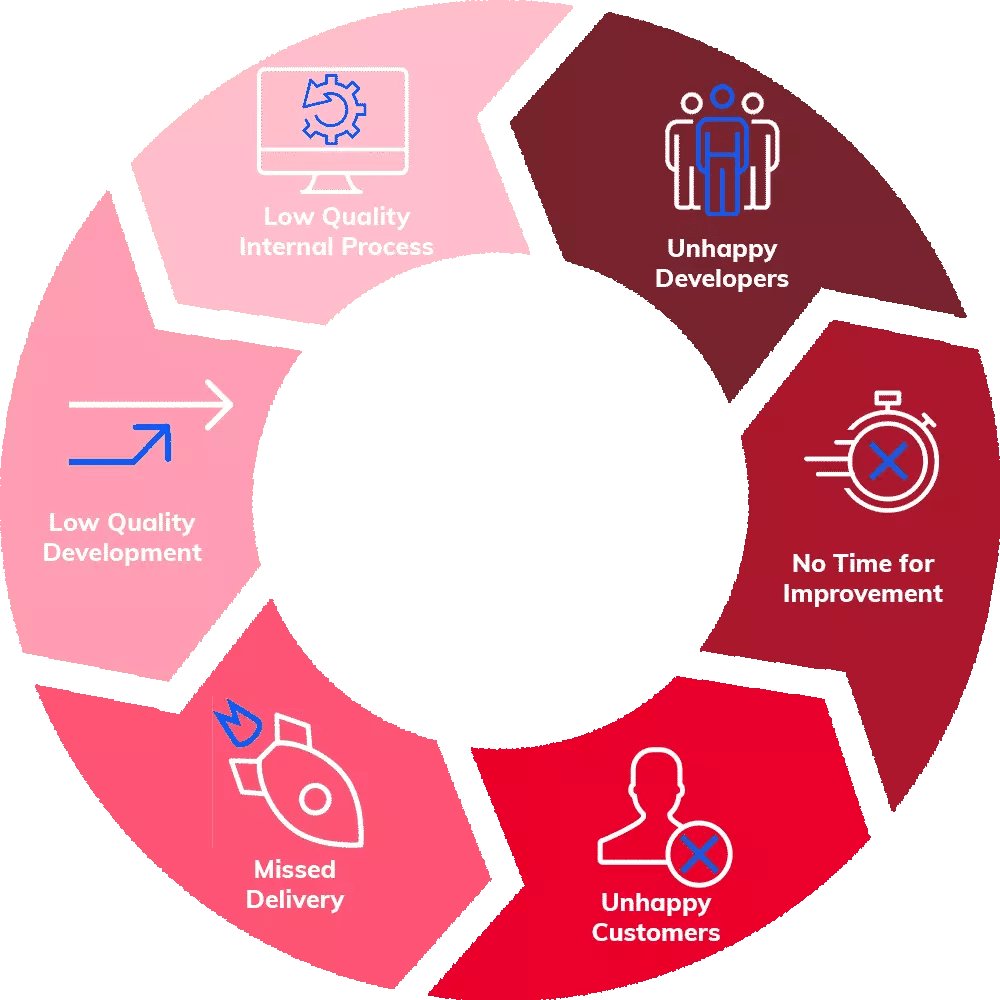 Low quality yields poor efficiency and creates a negative cycle
How To Measure Quality For Efficiency Gain?
Here is where things get interesting. There are leading and lagging indicators to measure quality when looking from an efficiency perspective. For each measurement described, engineering leaders should have visibility for both the organization and for each team. They should also be able to track progress across iterations.
Lagging Quality Indicators
The lagging indicators are more common. They are necessary to create a benchmark and measure progress, but they quickly become stale. Because of the nature of lagging indicators, they are only seen after it is too late to change them. Still, they are important to measure so let’s lay out a few.
Issues Found In Production:
Issues or defects found in production is a classic quality metric. It is sometimes known as change failure rate. It measures the amount of issues that were not caught prior to code released to prod. There are many models that extrapolate on this concept including the defect removal efficiency model. Issues found in production is a lagging indicator that can be used to understand how your proactive quality efforts are paying off. It has an inverse impact on efficiency; the more issues found in production, the less efficiency you can achieve. This is because an issue found in production is usually grounds to halt work on new value until it is resolved, which disrupts the team’s productivity and reduces the ability to hit delivery deadlines.
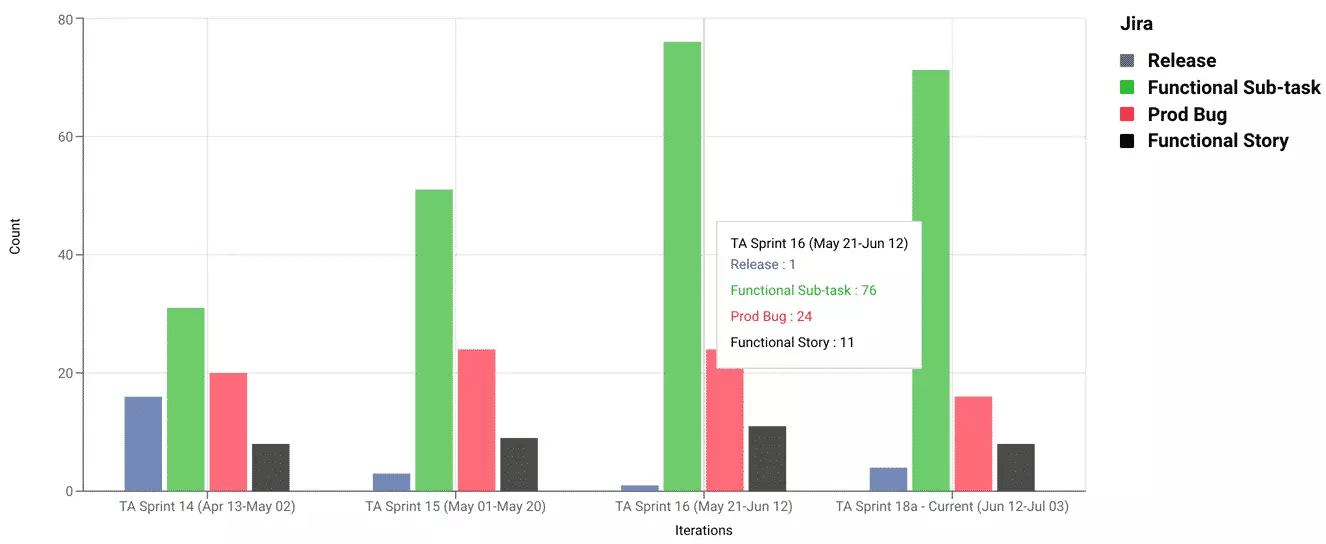 Pro Tip: No need to spend any manual effort measuring issues found in prod for your organization or for each team/iteration. All of this can and should be automated as seen above.
Mean Time to Restore:
Mean time to restore (MTTR) is a sister metric to issues found in production. It measures the amount of time it takes to resolve an issue found in production.
From a team efficiency perspective, time to restore indicates the amount of time your software developers are distracted and interrupted. It directly correlates to your team’s ability to deliver projects on time and have open time for continuous improvement, not to mention customer happiness.
 Pro tip: Measuring and improving your cycle time (your efficiency in getting code to production) will help improve your mean time to restore which can limit the negative impact of issues found in production. Start measuring your cycle time.
Improve Quality With Leading Indicators & Proactive Actions
Leading quality indicators provide a huge advantage over the classic lagging quality indicators. The reason is that leading indicators allow software teams to be proactive and take action to improve quality earlier in the development cycle resulting in greater delivery efficiency.
Work Breakdown and Coding Efficiency
Work breakdown is an essential metric that enables proactive quality improvement. It measures the percentage of code creation containing new code, refactored code (change of old code), and reworked code (change of code that was recently released to production).
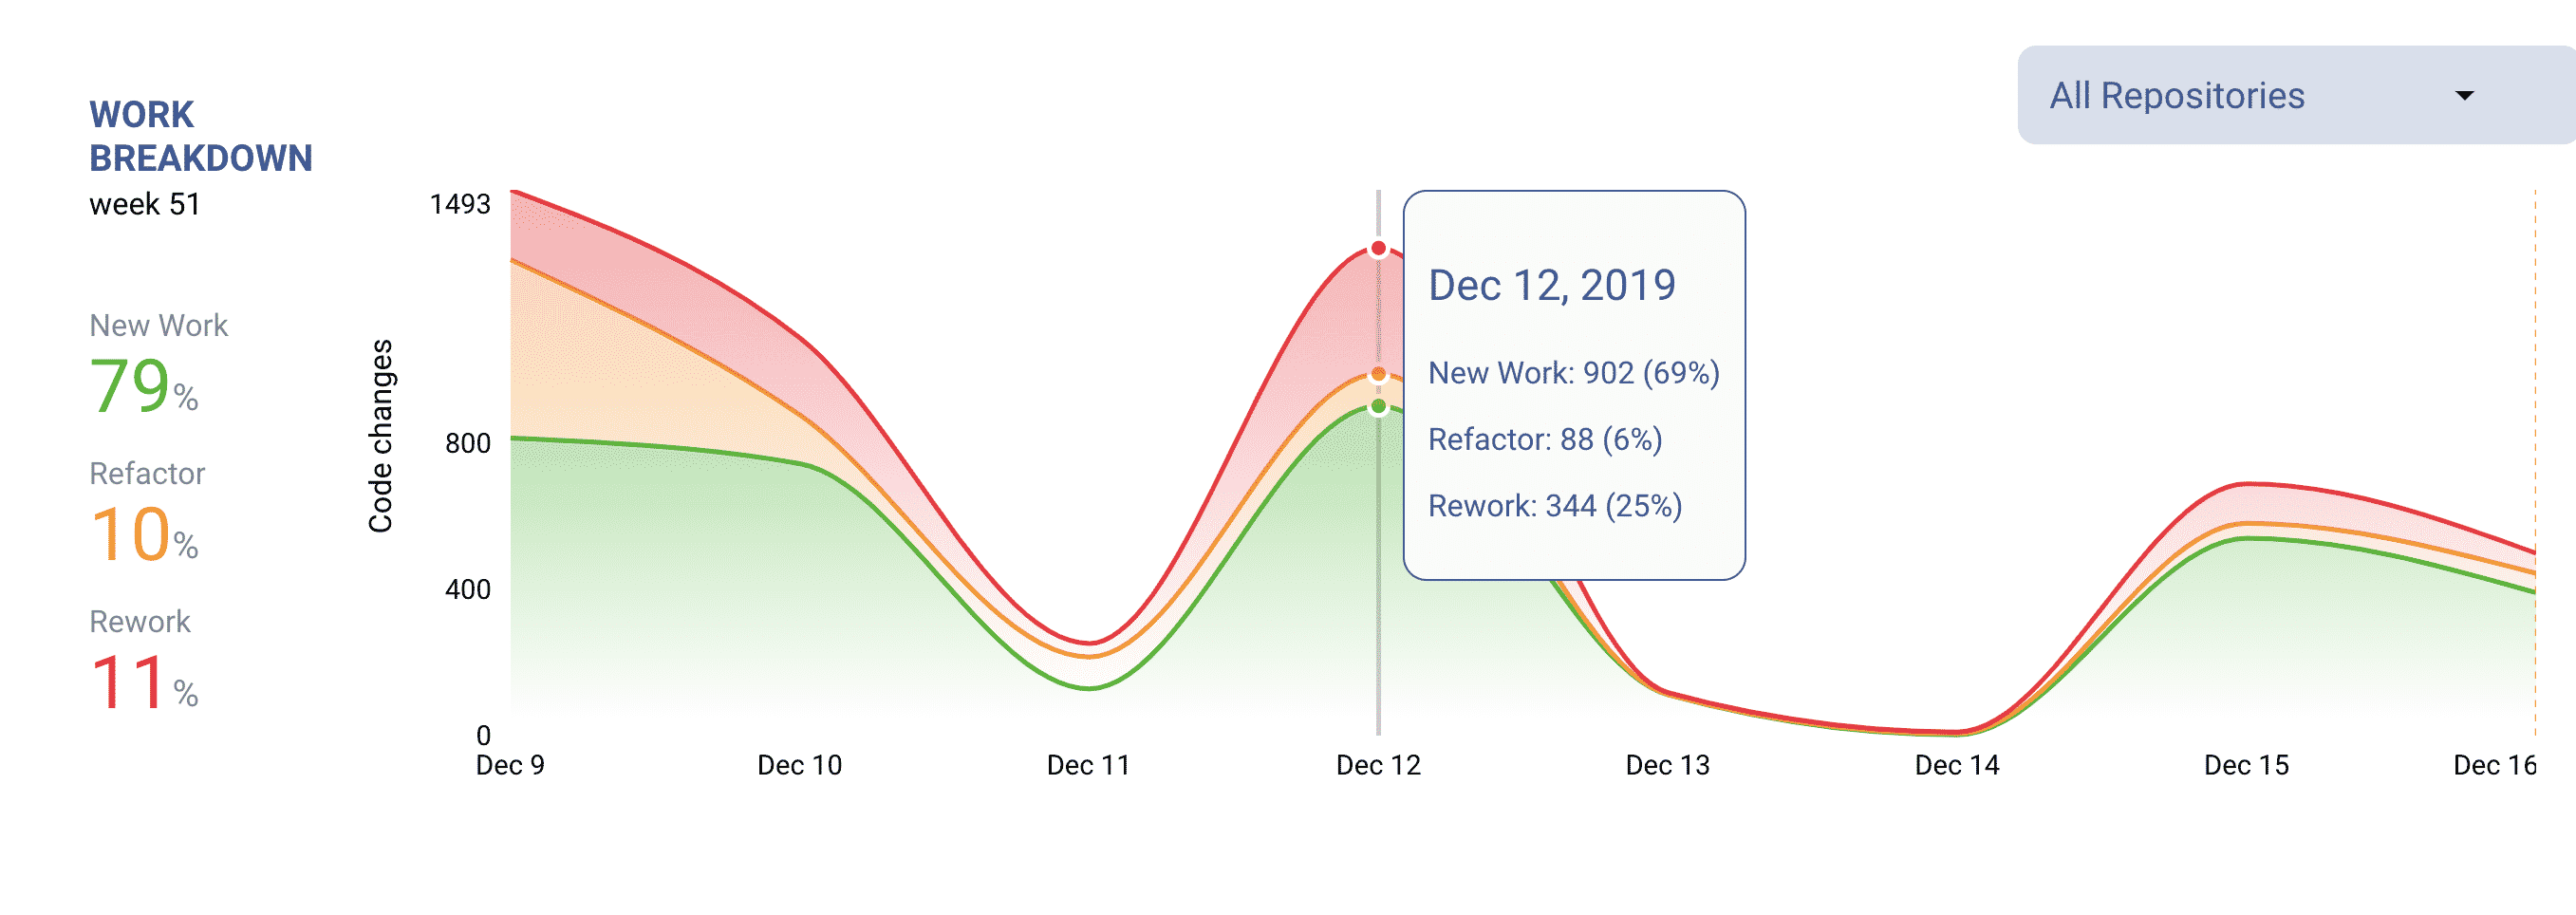 Rework displayed in LinearB.
A large amount of rework (>20%) is an indicator of a code quality hotspot in the given repository or branch. Excessive rework slows down developers and reduces the ability to efficiently create new value delivered to production.
The ability to identify and address rework hotspots allows software teams to be proactive with their quality efforts resulting in improved software delivery efficiency.
Proactive Actions to Improve Quality
- Identify repositories that contain consistent large amounts of rework.
- Inspect the repositories for insufficient technical designs.
- Inspect the quality and team understanding of Stories associated with the repos.
Branch Risk Detection
Detecting risk in branches while coding is in progress is one of the best proactive ways software teams can improve quality. Branch risk detection identifies branches that have a large amount of code rework combined with a large amount of code change.
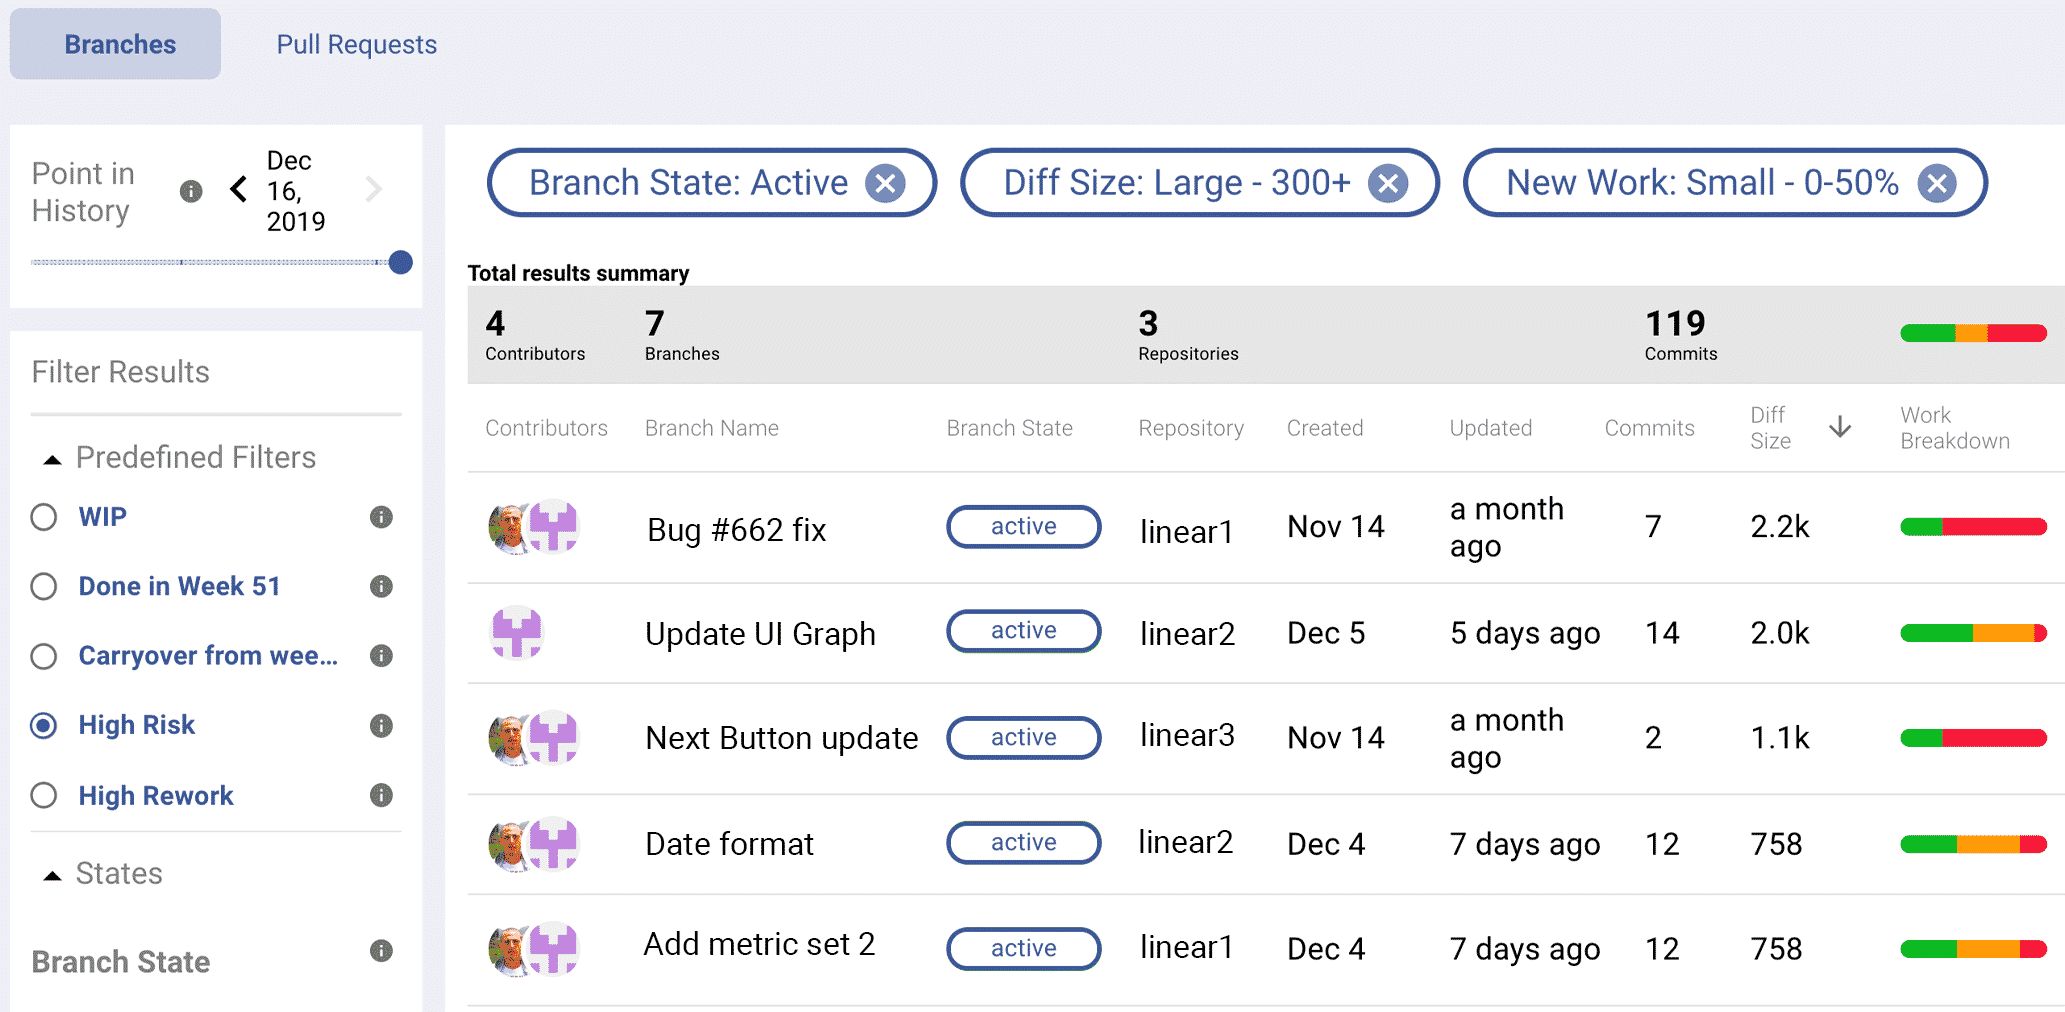 Discover risky work BEFORE its deployed LinearB.
Identifying branches that have quality risk prior to merge and release to production allows teams to catch issues before they become issues found in production. This efficiency gain will result in hitting delivery deadlines, more time for continuous improvement, and less production fire interrupts.
Proactive Actions to Improve Quality
- Check for high risk branch work on a daily basis.
- Inspect the high risk branches to see if the large charges and rework are necessary.
- Budget additional review and testing time for the associated pull request review.
Long Living Pull Requests, Lighting PRs and PR Review Depth
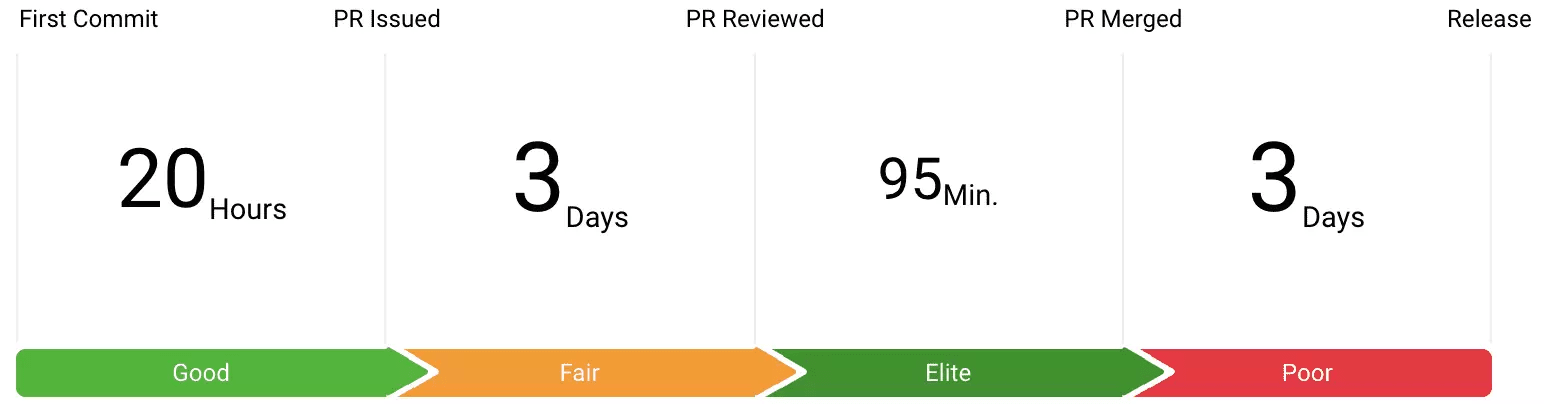
The pull request process offers an excellent set of leading indicators that can be used to proactively improve quality. A few useful metrics include the number of long living PRs, number of lighting PRs, and Pull Request review depth.
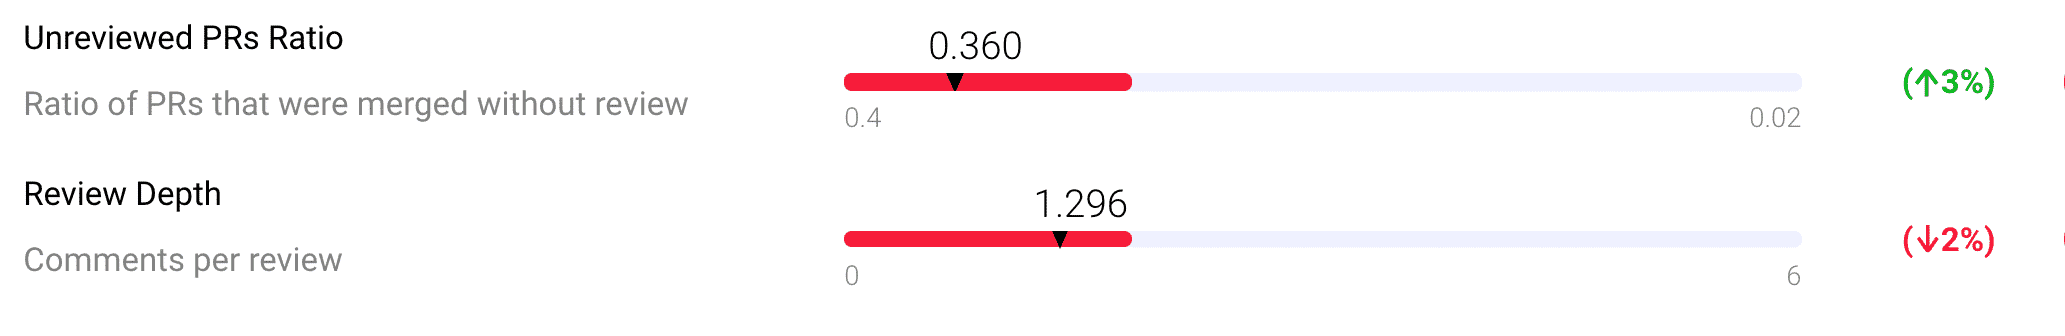
Long Living PRs measure the amount of PRs that have been open for greater than 30 days. Lightning PRs measure the amount of PRs that have been merged in less than 20 minutes with minimal code review. PR Review Depth measures the amount of review comments per pull request.
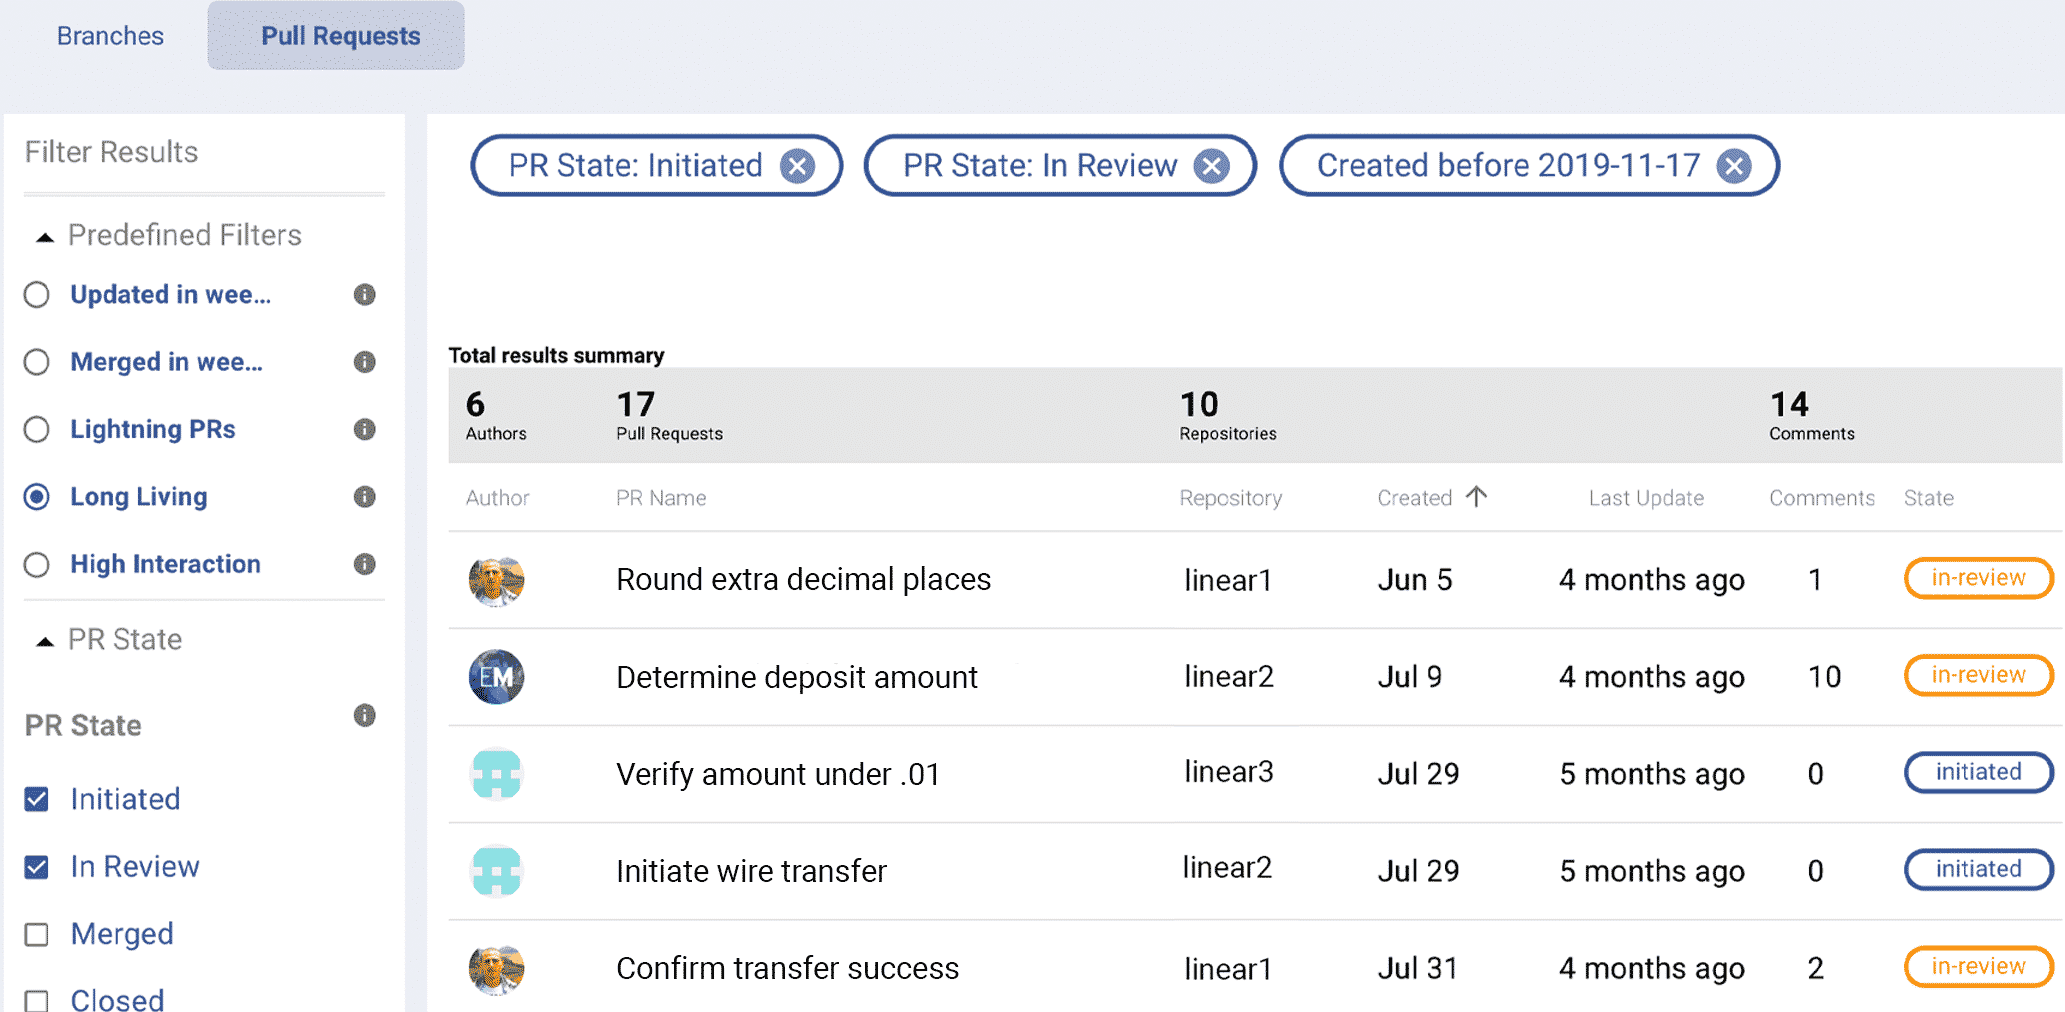
 Track long-living PRs and other key quality metrics automatically in LinearB.
Proactive Actions to Improve Quality
- Identify long living and lightning pull requests.
- For long living PRs, see what is blocking the merge. Then un-block it.
- For lightning PRs, help team members that are potentially merging without proper review
- Understand and track your team’s review depth over team
- If your review depth is low, establish a set of standard review practices.
Conclusion
Looking at quality from a team efficiency perspective can help to track the right KPIs for team performance improvement. Measuring both lagging and leading quality indicators allows software teams to be proactive with their quality efforts leading to delivering more value to production, having less customer issues, the ability to continuously improve, and happy software developers.


