 A key aspect of improving engineering operations and business impact is visibility. You have to be able to see what you want to improve, baseline current performance, and then set your improvement goals.
We’re excited to announce External Custom Metrics, which greatly enhances the flexibility and extensibility of LinearB. With our new Report Event API endpoint, you’re now able to track metrics from external systems in LinearB with a simple POST request. Once LinearB has that data, you can use it to create custom in-app Dashboards, enabling you to measure and benchmark even more dimensions of your SDLC.
Ultimately, this enhancement lays the foundation for you to optimize every aspect of your engineering practice–from Developer Focus Time to Test Coverage and everything in between.
External Custom Metrics gives you control over your SDLC with:
- Single pane of glass visibility into your entire R&D tool stack
- Bespoke dashboarding capabilities using a self-serve UI
- Trend analysis to show the ROI of your latest initiative or tool investment (Copilot, anyone?)
Let’s explore each of these use cases in more detail.
If you're ready to dive right in, click here!
Single pane of glass visibility into your entire R&D tool stack

While opinions vary, there are between six or seven stages of the software delivery lifecycle. And while some tools are used in more than one phase, teams must use multiple tools in the engineering process. And every single tool produces data that can be measured, used as a KPI, and improved on.
But as anyone who’s tried to wrangle engineering team data knows, it’s hard to see all that data in one place, in order to make data-driven decisions. And without that, it’s impossible to understand the relationship between data sets or glean actionable insights (like where operational bottlenecks are).
External Custom Metrics helps you tackle this challenge in a flexible, API-first fashion. Now–in just minutes–you can build metrics dashboards for things like code coverage, developer focus time, and application uptime from tools like SonarQube, Clockwise, and Datadog.
Bespoke dashboarding capabilities using a self-serve UI
In a perfect world, every piece of software would be 100% interoperable. Unfortunately, we haven’t gotten there as an industry–there’s a lot of software out there and choices have to be made when developing. But one thing SaaS providers can do is make their tools flexible and extensible enough to work with tools that aren’t yet fully supported.
And that’s exactly what LinearB did (though we do integrate with all your favorites).
Leveraging the External Custom Metrics feature, teams can build metrics dashboards for your favorite (not yet supported) PM, SCM/VSM, bug trackers, and other tools. We won’t list out all of the unsupported tools that you can now build metrics dashboards for, but you can use your imagination (think Monday, Status Page, and Bugherd, for example).
With this team/group based visibility that cuts across tool stacks, you can see where you need to focus improvement efforts and start having conversations.
How To Build a Dashboard
Let’s say you wanted to send data about build time for PRs to keep track of the idle time associated with CI pipelines finishing a process. This example illustrates how to send CI pipeline wait times to LinearB.
This API request specifies:
- The Data source
- The Metric name that will appear in LinearB
- A value that represents the number of seconds the pipeline took to finish
- A reference to the associated PR
curl -X POST "https://public-api.linearb.io/api/v1/report/event" \
-H "x-api-key: your_api_key" \
-H "Content-Type: application/json" \
-d '{
  "source": "CI Pipeline",
  "timestamp": "2024-03-07 08:07:12.613",
  "metric_name": "ci_run_time",
  "value": "5434.0",
  "entity": {
    "pr_url": "https://github.com/hello/world/pull/1731"
  }
}'
In this example, be sure to set this up to automatically report this data every time a CI pipeline finishes for one of your PRs. Once you have data rolling in, you can create a dashboard to track it in the metrics page on your LinearB dashboard.
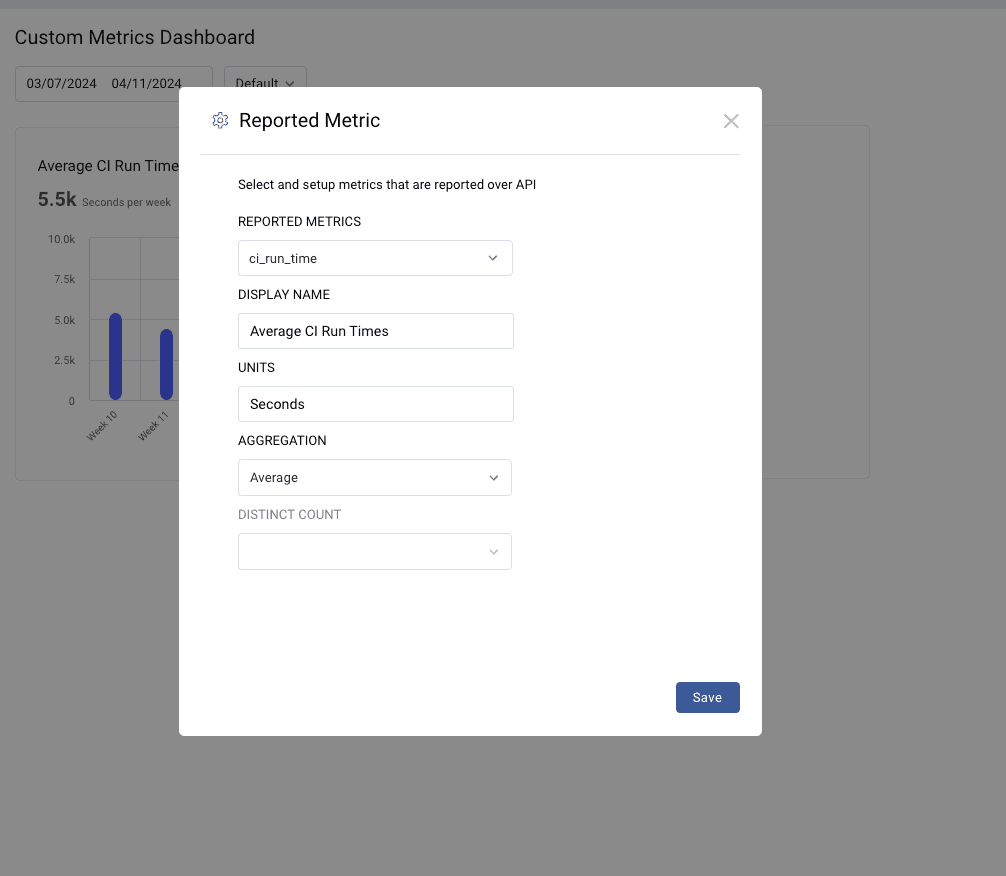
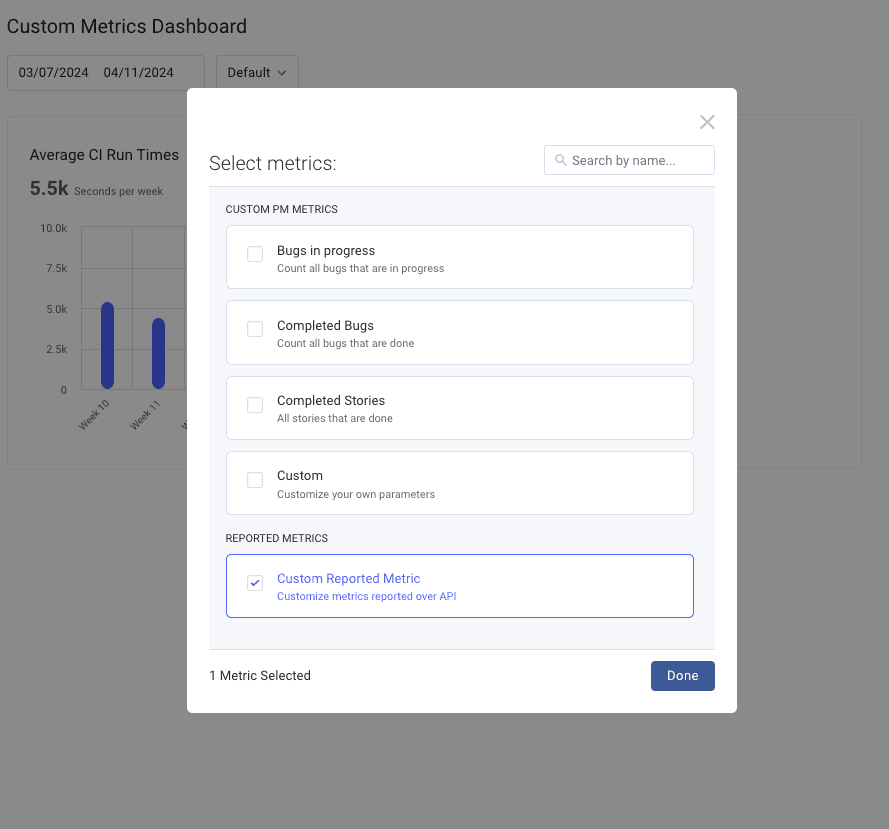
When creating a new visualization, select Custom Reported Metric and fill out all of the forms according to how you want to visualize the data.


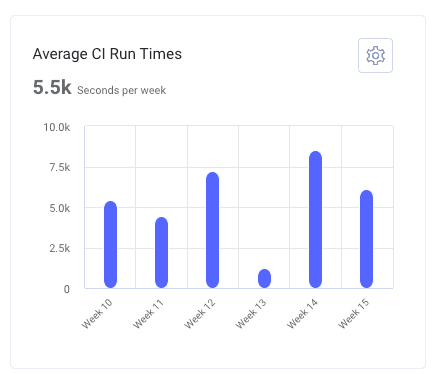
That’s it! Now you’ve got a metrics widget that automatically tracks your average CI Run Times! You can set this up for several other metrics–like build failures, code coverage, or test failures–using a similar process.
So get building!
Trend analysis to show the ROI of your latest initiative or tool investment

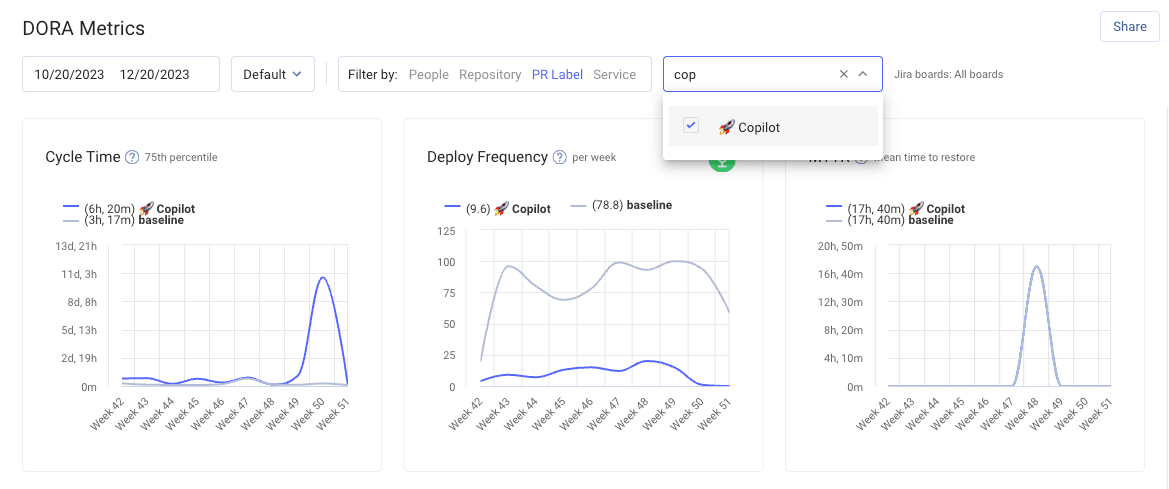
If you’re like the 86% of respondents who are likely to adopt GenAI coding tools, you want to make sure that you see a return on your investment (like faster time to value). The Custom External Custom Metrics feature provides this visibility and can show you how much cycle time was reduced for GenAI-created PRs vs those that went through the standard channels.
In addition to GenAI, you can also build metrics dashboards to see how much more efficient teams are at moving PRs through the pipeline using gitStream.
In short, this capability makes the sky the limit for improvement initiative metrics visibility.
Got an interesting idea or an initiative you want to see metrics for? We want to hear about it!
Final Words on Custom External Custom Metrics
This enhancement is all about improving the flexibility and extensibility of the LinearB platform so you can do more with it. So use your imagination and build an engineering metrics program that meets your exact specifications!
External Custom Metrics is now GA for those on LinearB Business and Enterprise subscriptions.
For LinearB Users: Click here to start building custom metrics dashboards. To learn more about the process, check out Help Docs.
Don’t have LinearB yet? Book a demo and see this awesome feature in action!

