You made it. Your iteration is over. Time for the retrospective meeting.
LinearB can help make your retro meeting more data-driven, while ensuring the team covers the most important items from across the team, including even those that may be hesitate to announce their successes.
Run data-driven retro
**Note: This article focuses on how any dev team can run a data-driven retrospective. The screenshots shown come from LinearB, a free tool for dev teams. You can follow along by starting your free account. Setup takes only minutes.
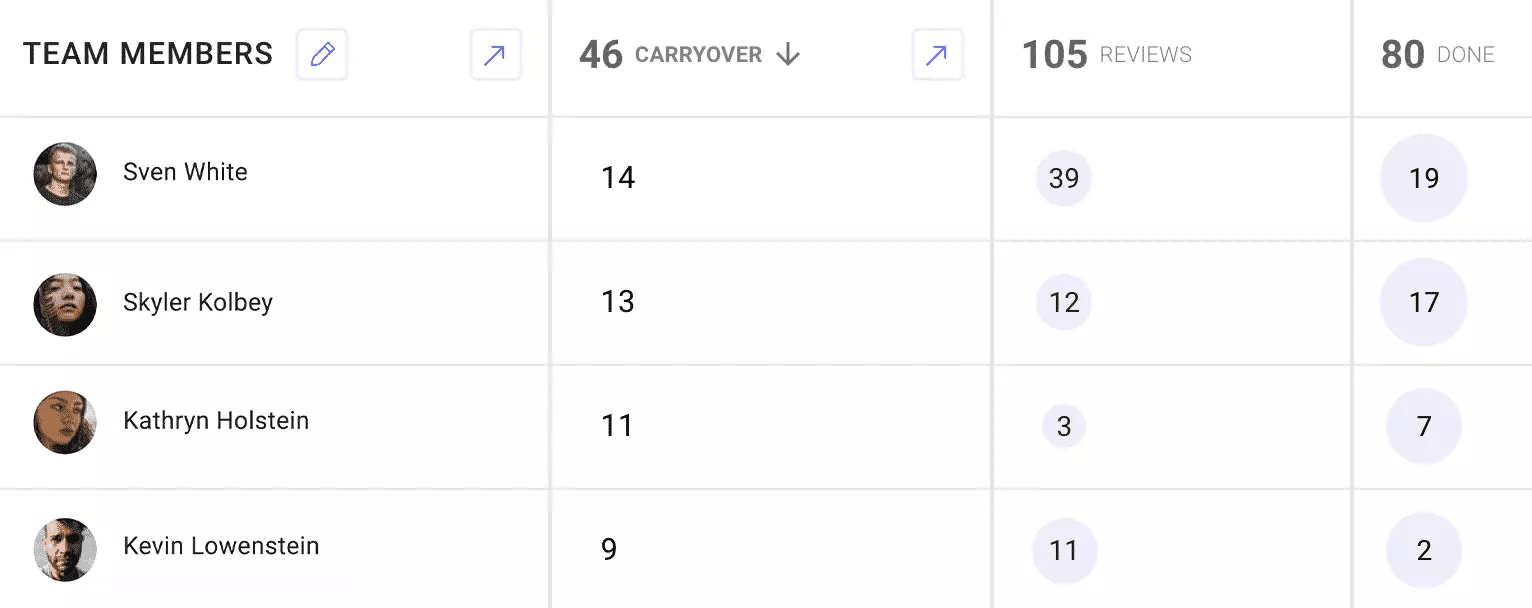
Carryover
You’ll see a summary of work completed and carryover and drill into any contributor individual branches if deeper discussion is desired.
How we use this: We strive for accurate planning so we usually start with carryover in the retro.
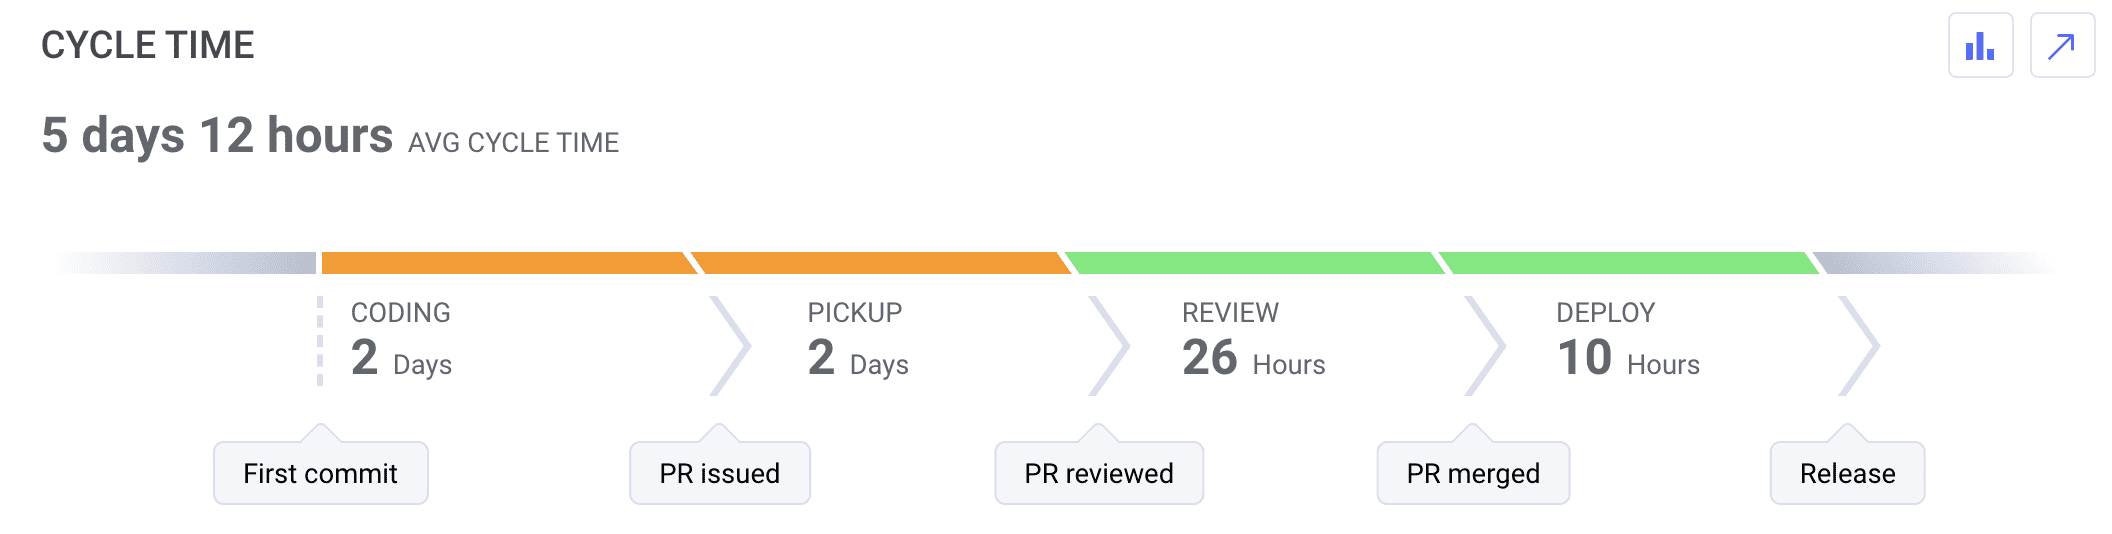
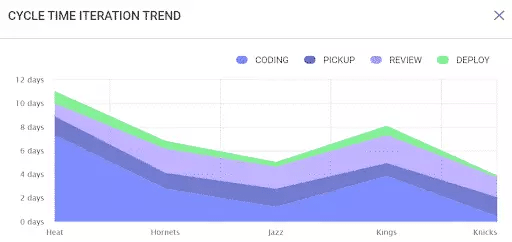
Cycle Time
You’ll automatically see your Cycle Time for the iteration and how it compares to past iterations.
How we use this: The iteration cycle time chart makes it easy to see any areas where we struggled during the iteration (like the review phase in the image below) and discuss how we can speed things up in the next iteration. The trend view drives great discussion about bigger picture things affecting the team (like work from home).
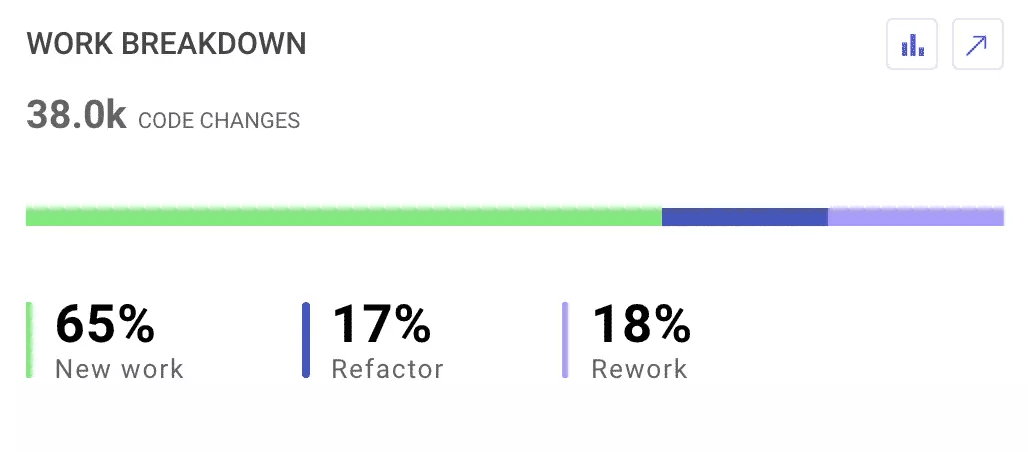
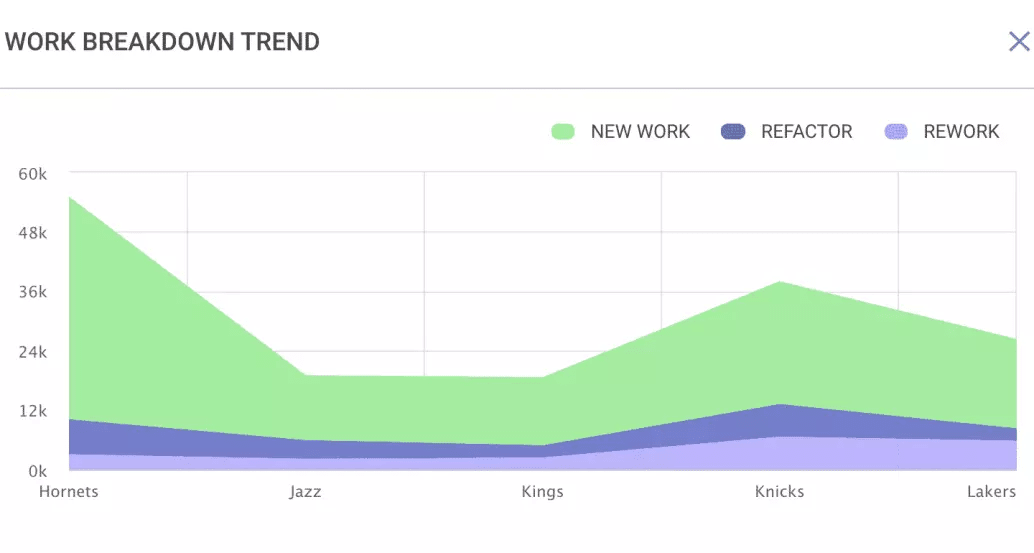
Work Breakdown
You’ll also automatically see your work breakdown.
How we use this: We like to keep rework below 10%. Anything higher is a predictor of quality issues.
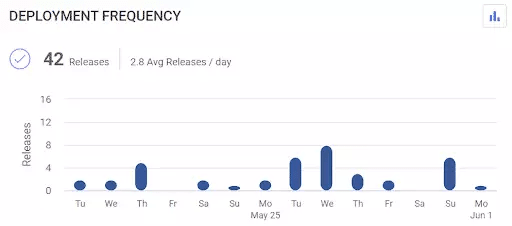
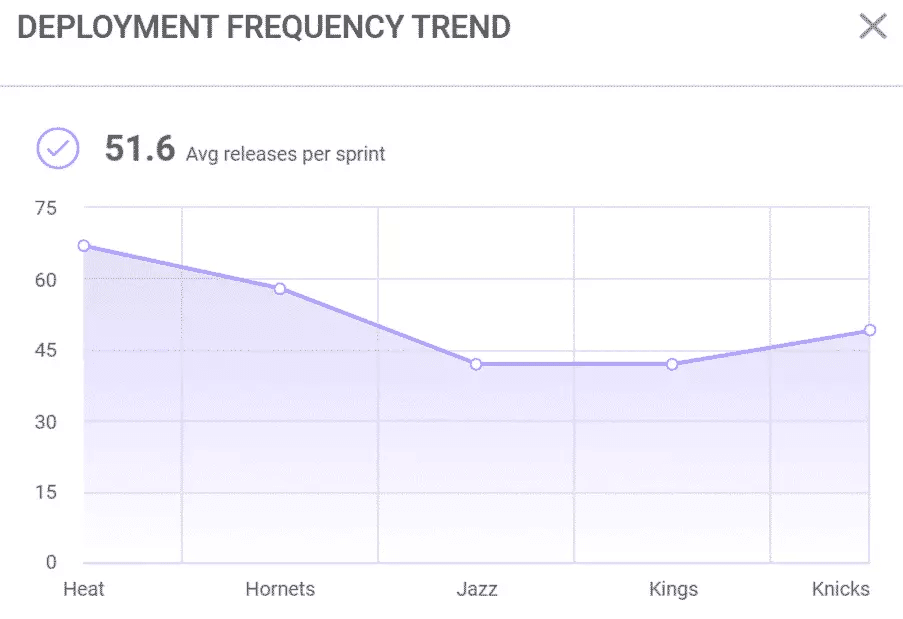
Deployment Frequency
Next, you’ll see your Deployment Frequency.
How we use this: Deployment frequency is one of the most important metrics for the health of our team. Lower frequency means bigger releases which usually leads to quality issues.
Reports
Next, go to the Reports section
The Velocity report automatically calculates your story points from Jira.

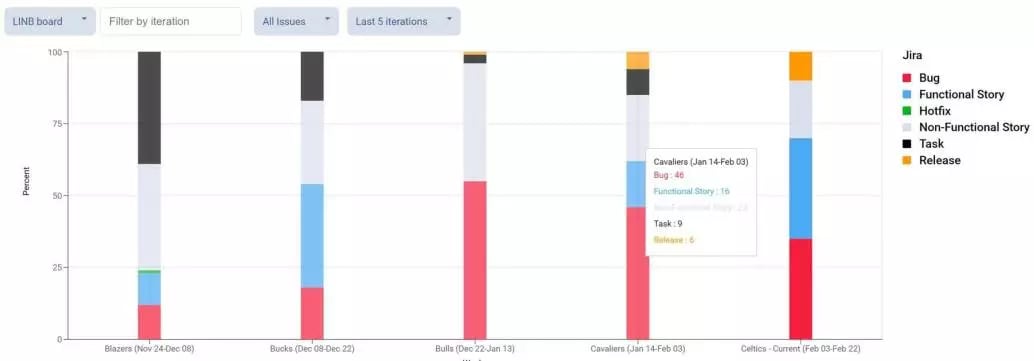
The Investment Profile report shows your true breakdown of work by ticket type.
How we use this: Being a developer-led company, we care about innovation. And we also really care about investing in non-functional projects to help our devs work more efficiently. Our CEO looks at this report for every team every two weeks to make sure we are balancing appropriately.
Ready to make your next retrospective better?
LinearB was built for today’s dev leader. It combines team-base metrics that helps dev leaders see the current detailed status of work, track key delivery metrics, and maintaining a healthy dev culture.
Dev leaders use LinearB to run data-driven retrospectives. Click here to start your free LinearB account today.
We’re here to help. If you have any questions or if you want to walk through, just let our bot in the bottom right know.