2026 Software Engineering Benchmarks Report
The 2026 Software Engineering Benchmarks Report is created from an analysis of 8.1+ million pull requests from 4,800+ organizations worldwide. Inside you’ll find:
- State of the market: Survey results and reflections from our 2026 AI in Engineering Leadership survey.
- 2026 benchmarks: This year’s benchmarks include 20 metrics spanning the entire SDLC – plus all-new AI metrics.
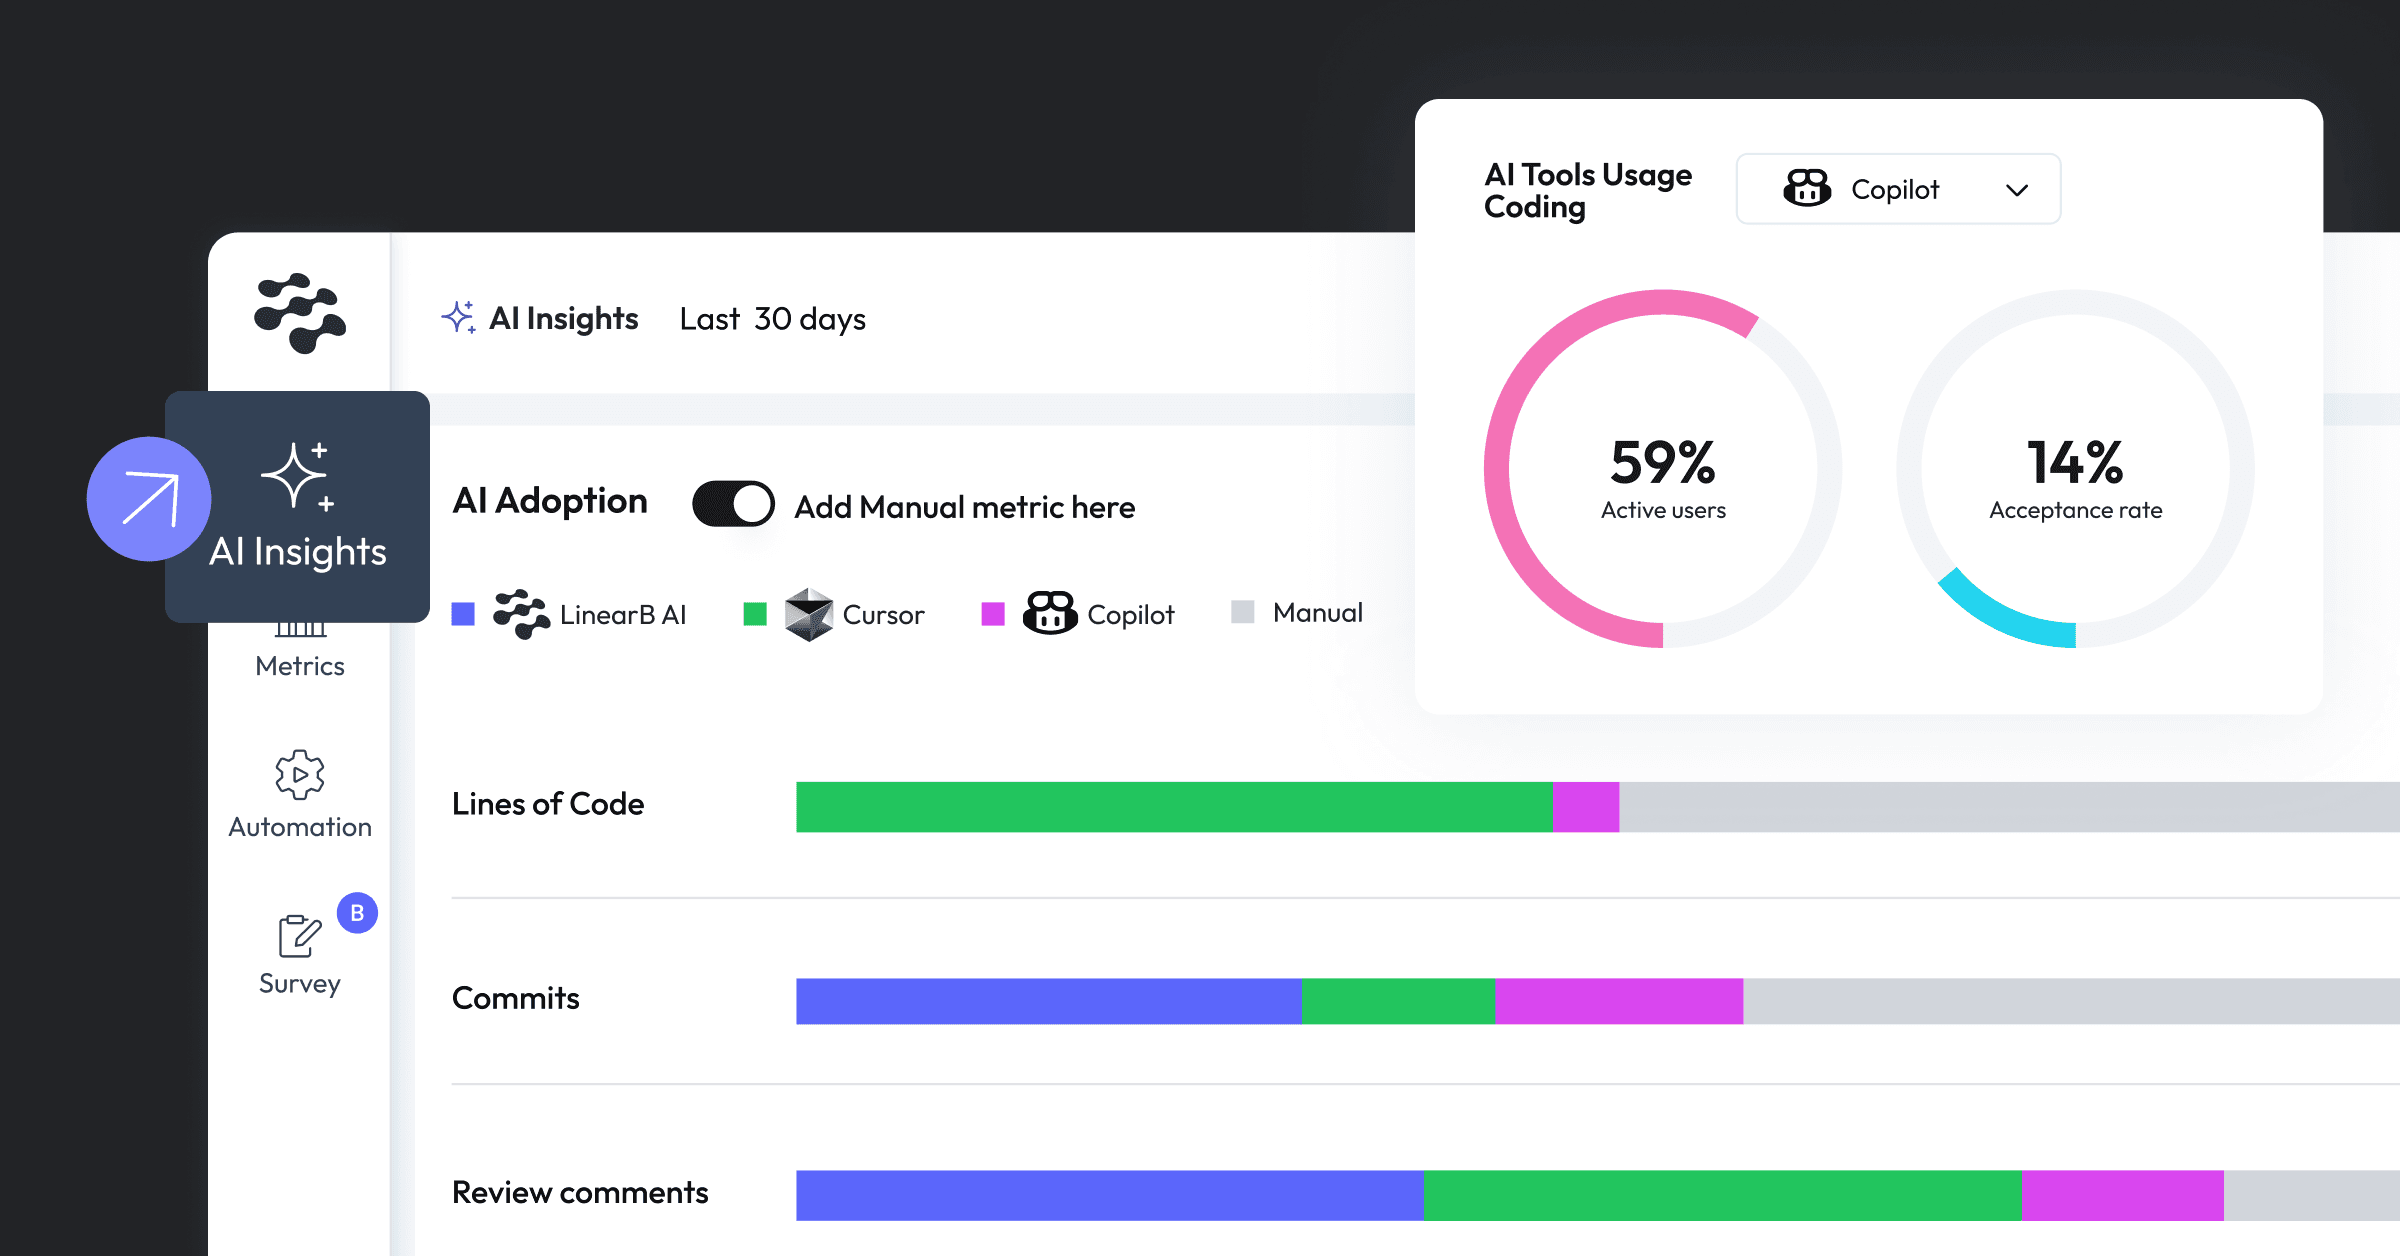
- [NEW] AI insights: A brand new segment breaking down the impact AI tools are having on delivery velocity, code quality, and team health.
2026 Software Engineering Benchmarks Report
Download your free copy

What's inside?
2026 benchmarks breakdown
This year’s benchmarks include 20 metrics spanning the full SDLC – plus all-new AI metrics. Discover industry benchmarks for:
- Delivery: Cycle Time, Deploy Frequency, PR Size, and more
- Predictability: Change Failure Rate, Rework Rate, Planning Accuracy, and more
- Project Management: Issues Linked to Parents, In Progress Issues with Assignees, and more

Real stories from top engineering leaders
Data alone doesn’t tell the full story.
That’s why this year’s report goes beyond metrics, capturing real-world perspectives from top engineering leaders regarding questions like:
- What’s been the biggest challenge or concern with using AI in your role?
- How confident are you in the quality of AI-generated code or suggestions?
- Looking ahead, how do you expect AI to influence your work in the next 12 months?

NEW AI productivity insights
This year’s report takes a hard look at AI’s impact on productivity. Here are a few of the standout findings from this year’s data:
- AI PRs wait 4.6x longer before review – but are reviewed 2x faster once picked up.
- Acceptance Rates for AI-generated PRs are significantly lower than manual PRs (32.7% vs. 84.4%).
- Bot Acceptance Rates vary widely by tool, with Devin’s rising since April and Copilot’s slipping since May.

Download your free copy

More resources

Workshop
2026 Benchmarks Insights
Explore new AI insights from the 2026 Software Engineering Benchmarks Report – backed by 8.1M+ PRs across 4,800 engineering teams and 42 countries.

Demo
Understand AI adoption and developer impact with the AI Insights Dashboard
This demo guides you through the AI Insights Dashboard, demonstrating how to track and analyze trends in AI tool adoption, rule coverage, and code quality....

Demo
Using the MCP Server with Claude
This demo walks you through connecting Anthropic’s Claude to LinearB data, querying insights and recommendations, and building repeatable metrics dashboards –...