CTO Board Deck Template
The best engineering leaders draw a clear connection between engineering KPIs and business goals. In this CTO Board Deck, you’ll find a template that helps you answer the following questions:
DevEx: Are our engineers able to focus on what they enjoy doing?
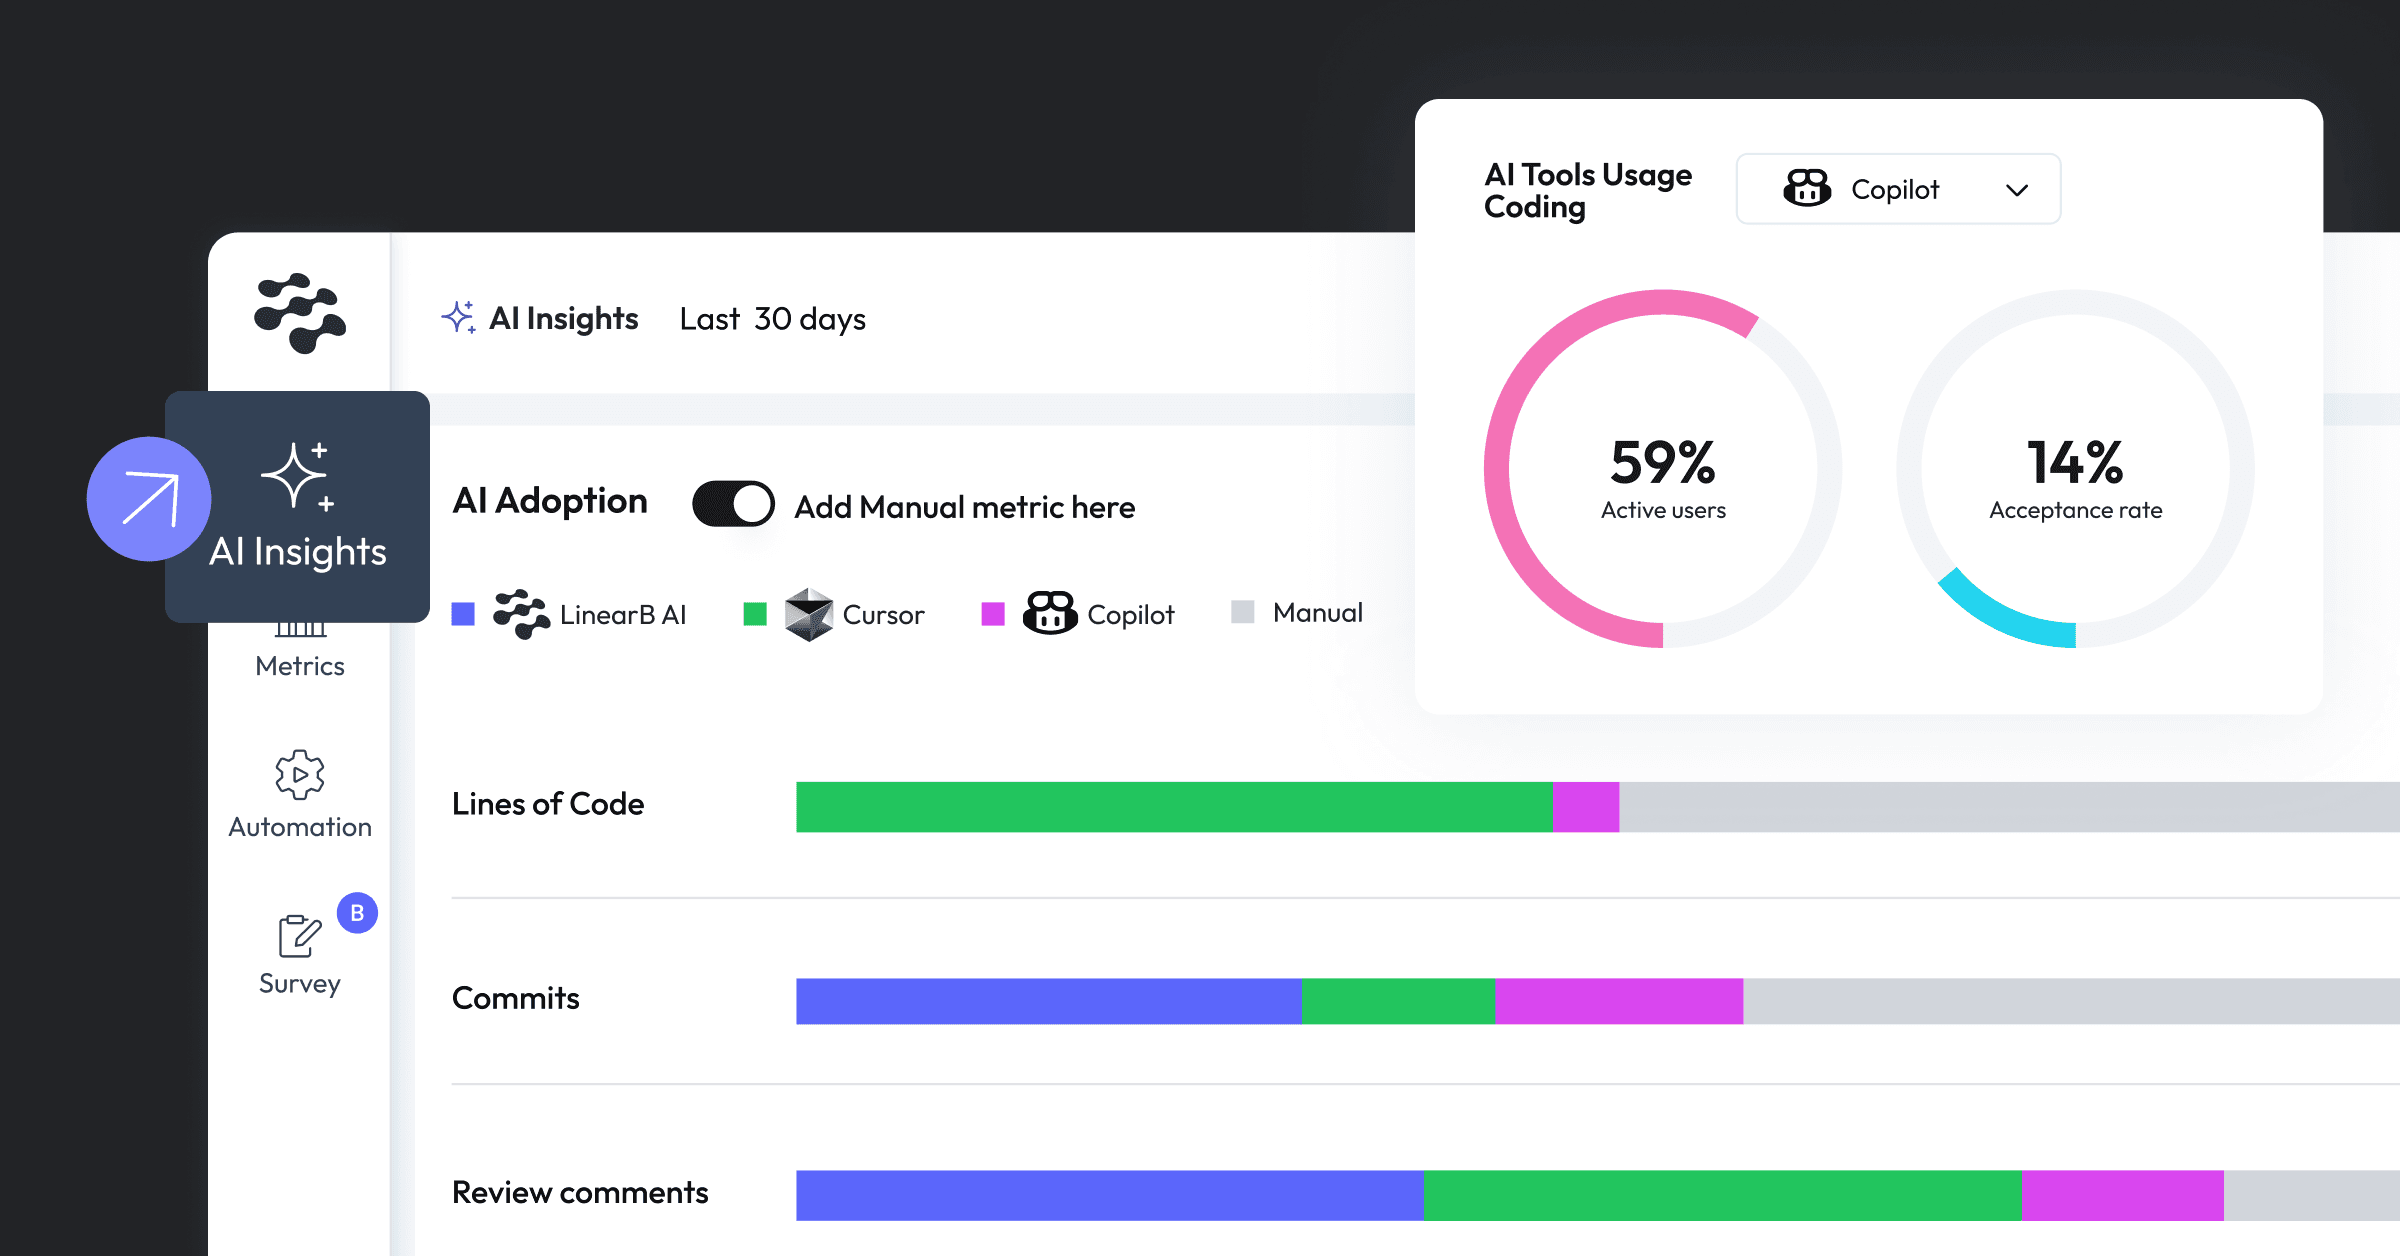
AI Performance: How do we measure the impact of our AI investment?
Engineering Health Overview: What are our teams’ ability to execute on priorities?
CTO Board Deck Template
Download your free copy

Key Investments
Use investment percentages as a starting point when aligning R&D resource investment with the board and executive team. Answer questions like:
Is our investment profile different from what’s typical?
Are we investing below average in New Value? Or above average in KTLO?
Are we balancing our investment in New Value with our investment in new tooling?

Team Health Overview
Translate operational metrics and developer sentiment into an organizational health assessment. Use these slides to report on:
Your teams’ ability to execute on priorities
How long any given piece of work takes to complete
Whether your developers are able to focus on what they enjoy doing

Developer Productivity Reporting
See if DevEx initiatives are helping your engineers move faster, deliver higher quality, or improve satisfaction. Come ready to address the following concerns:
What is developer morale and engagement like?
Is WIP under control, and is my team avoiding burnout?
How often do developers experience flow interruptions or context switches?

AI Impact
Quantify the impact of your AI investment and understand the downstream effects on Developer Experience and productivity. Answer questions like:
What use cases are we solving with GenAI?
Which devs, teams or groups are adopting GenAI the fastest?
Which parts of our codebase are being written by a machine? New code? Tests?

Engineering Investment & Resource Planning
Understand whether your developers are focused on the correct stories, tasks, and work items. Share data on key projects in terms of:
Business impact & resource allocation
Benchmarked execution and efficiency metrics
Investment profile and the cost of your engineering initiatives

Download your free copy

More resources

Report
2026 Software Engineering Benchmarks Report
Created from a study of 8.1+ M PRs from 4,800 engineering teams across 42 countries.

Workshop
2026 Benchmarks Insights
Explore new AI insights from the 2026 Software Engineering Benchmarks Report – backed by 8.1M+ PRs across 4,800 engineering teams and 42 countries.

Demo
Understand AI adoption and developer impact with the AI Insights Dashboard
This demo guides you through the AI Insights Dashboard, demonstrating how to track and analyze trends in AI tool adoption, rule coverage, and code quality....