Resource Center
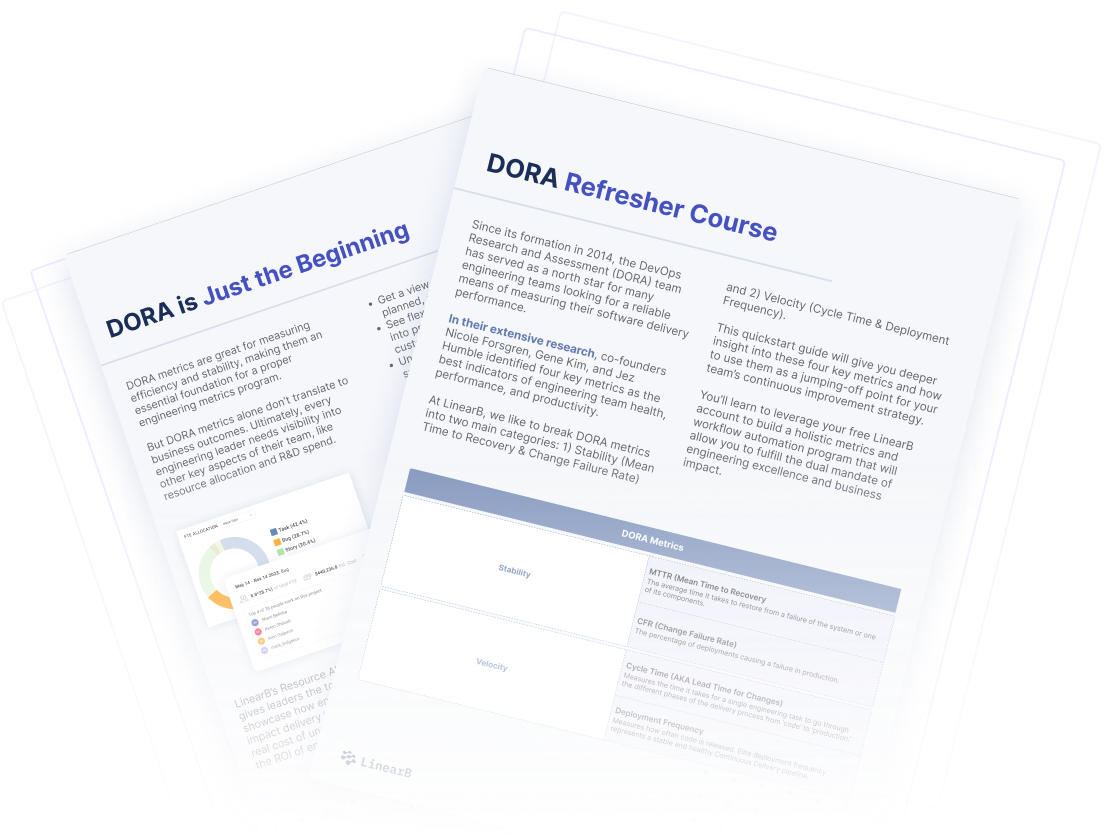
Quickstart Guide: Your Path to DORA Excellence

Download
What's Inside?

Configure Your Dashboard in < 5 Mins
This guide will walk you through a one-time set up that can be completed in minutes.
You’ll learn how to:
Connect your repos and PM tool
Customize your metric calculations
Segment data by team, label, repo, and service

Benchmark Your Performance
Once you have your metrics in place, you’ll want to get a sense of where you stack up against industry peers.
Your DORA dashboard will help you answer questions like:
Is our 12-day cycle time good?
How about our average PR size of 250 lines of code?
Where does my engineering team stack up against industry peers?

Apply PR Automation
Metrics alone don’t improve dev teams. The DORA Quickstart Guide will show you how to apply workflow automation to your bottlenecks.
Learn how to actually improve your DORA metrics with the following automations:
CI Orchestration: Selectively trigger CI pipelines to reduce wait time
Code Experts: Auto- assign the most qualified developer to review your PRs
Review Time Labels: Add color coded labels to PRs with estimated review time
Download the DORA Quickstart Guide
Download
More resources

Report
2026 Software Engineering Benchmarks Report
Created from a study of 8.1+ M PRs from 4,800 engineering teams across 42 countries.

Workshop
2026 Benchmarks Insights
Explore new AI insights from the 2026 Software Engineering Benchmarks Report – backed by 8.1M+ PRs across 4,800 engineering teams and 42 countries.

Demo
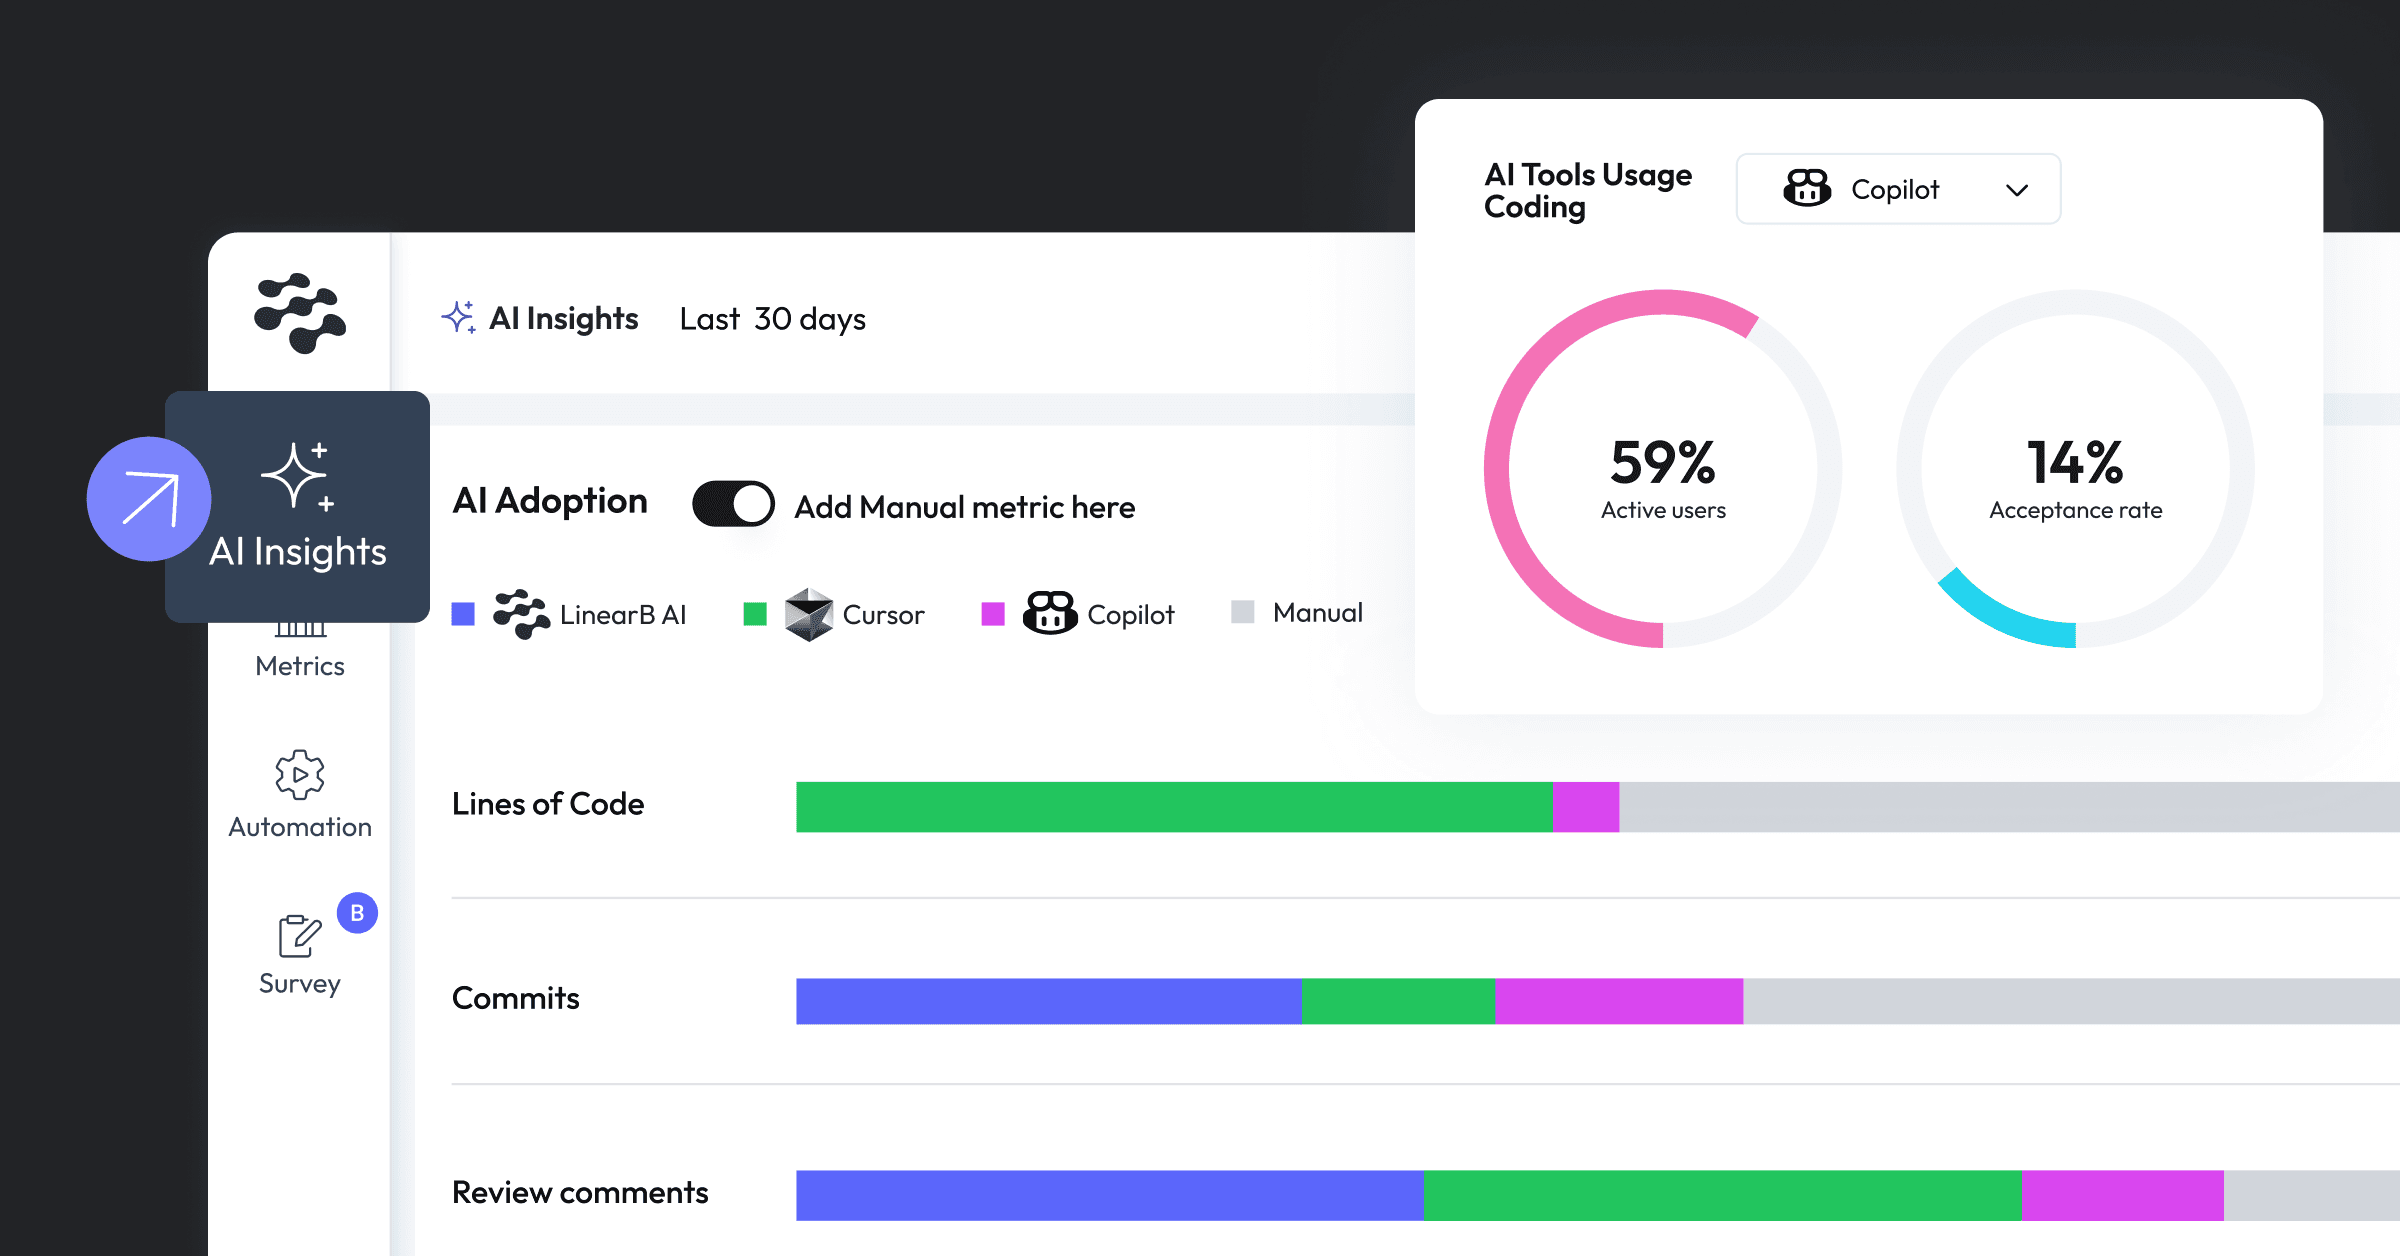
Understand AI adoption and developer impact with the AI Insights Dashboard
This demo guides you through the AI Insights Dashboard, demonstrating how to track and analyze trends in AI tool adoption, rule coverage, and code quality....