The Jira Reporting Dashboard You Deserve
Engineering leaders need holistic visibility into the health of their organization. Unfortunately, out-of-the-box Jira reports aren’t enough. With LinearB you can:
Ensure metrics accuracy with git, CI/CD, and Jira dashboard data
Connect the dots from project investments to business impact
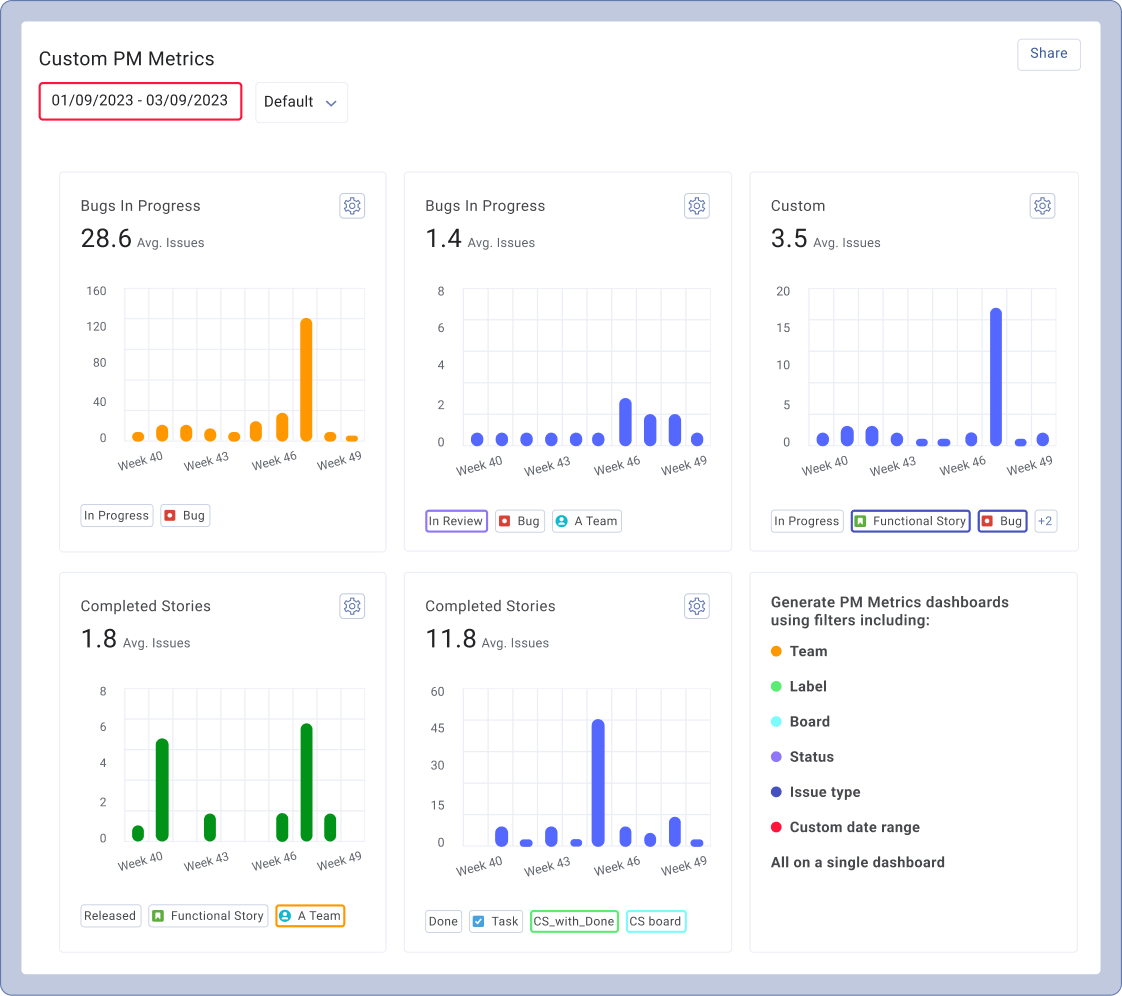
Get custom Jira metrics reports with no JQL knowledge
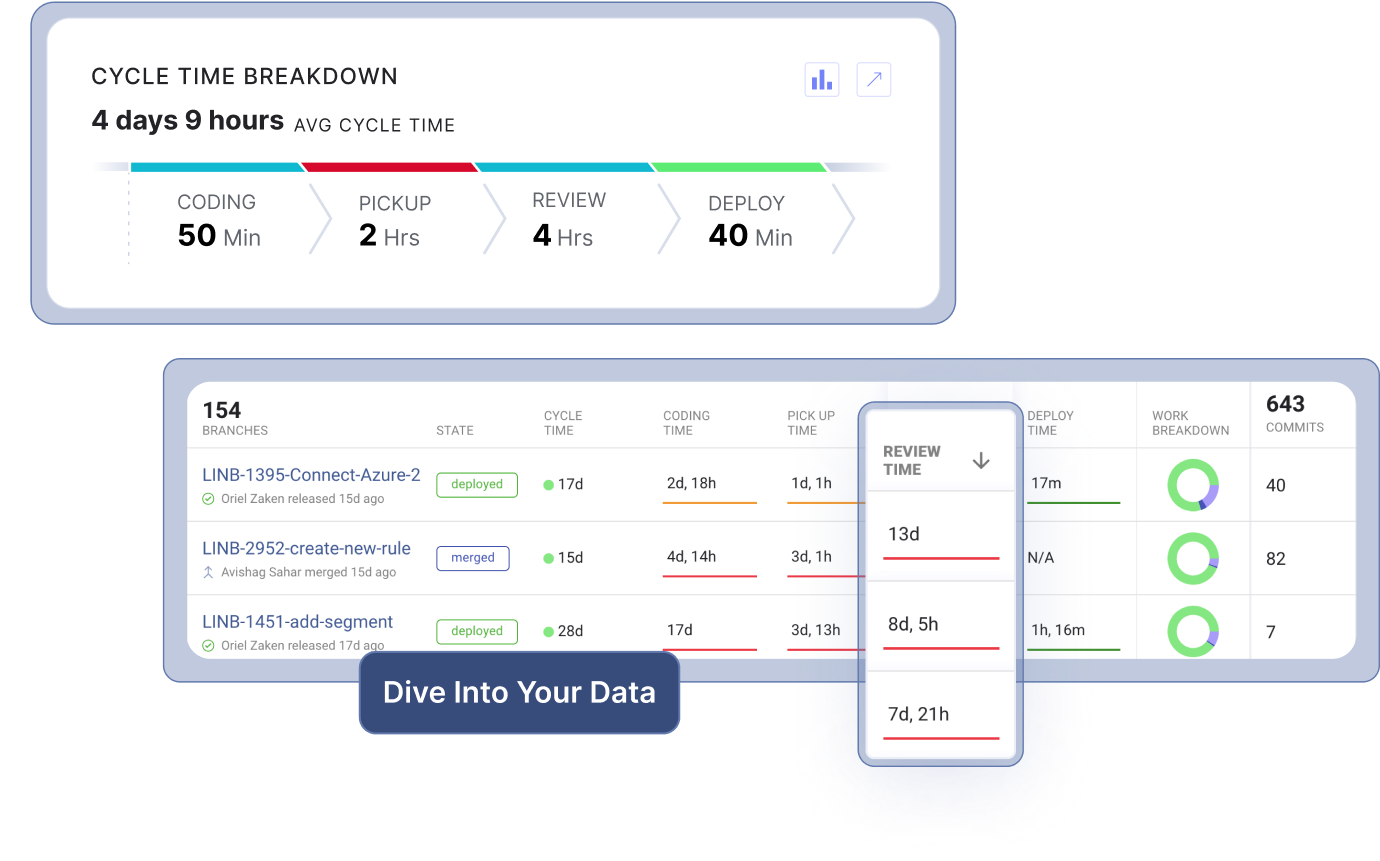
See beyond “In-progress” status with visibility into merges, commits, and deployments
Join the next wave of modern engineering organizations


Get Actionable Jira Insights That Go Beyond Story Points
Correlate
Data
Simplify
Reporting
Customize
Views
Automate
Work
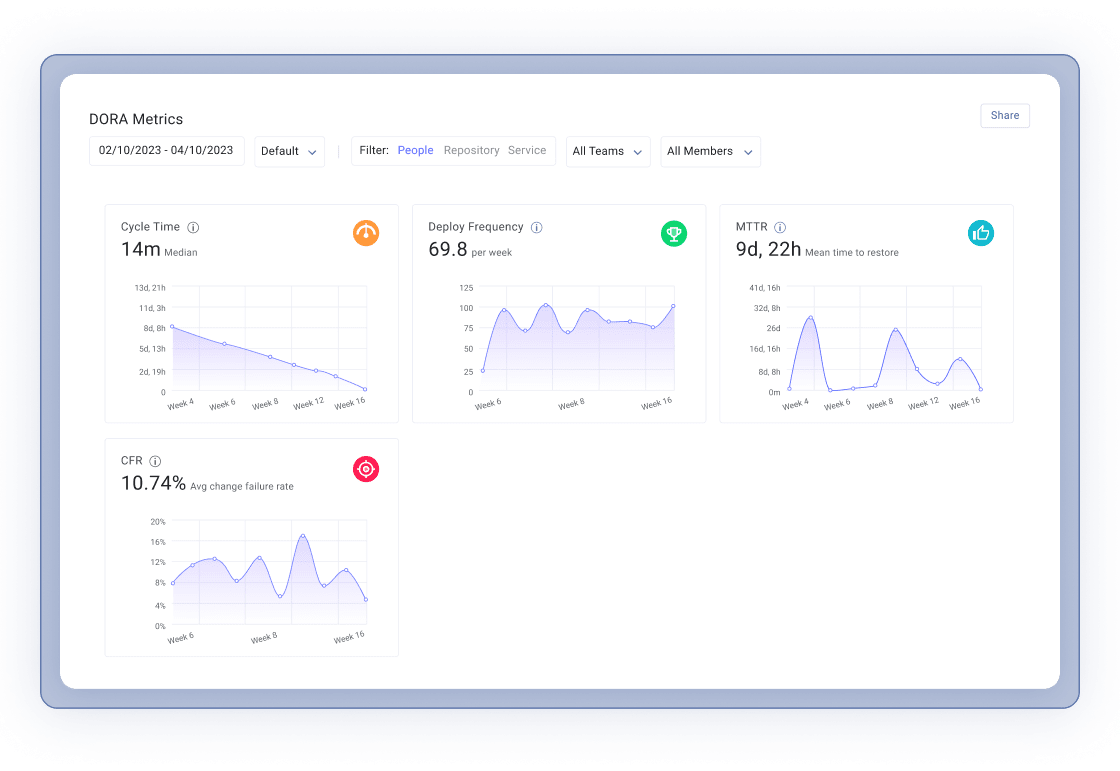
Jira reporting tools aren’t always useful because of three big limitations: (1) Jira data only (2) Data hygiene is required (3) Rigid data segmentation makes cross-board visibility tough. LinearB correlates your Jira data with your git & CI/CD tools so you can:
See all project and git data in one place
View stability DORA metrics–MTTR and CFR–automatically
Get Jira automation for missing tickets and status updates
Uncover your project status beyond the black box of “In progress”
Get Actionable Jira Insights That Go Beyond Story Points
Correlate
Data
Simplify
Reporting
Customize
Views
Automate
Work
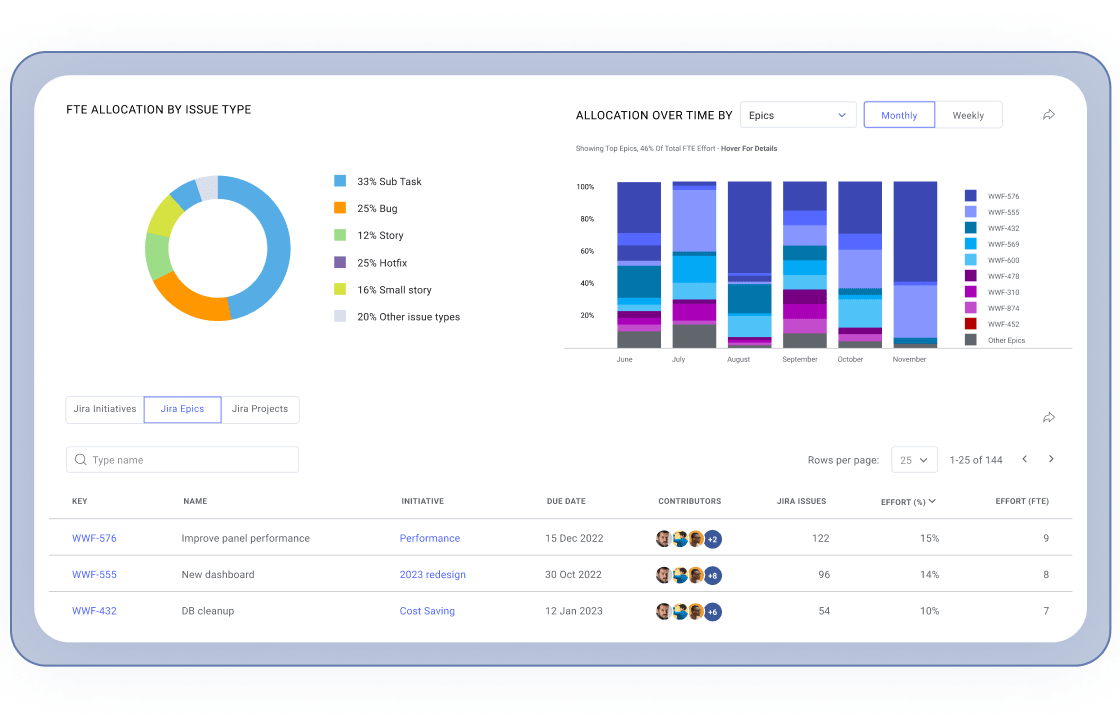
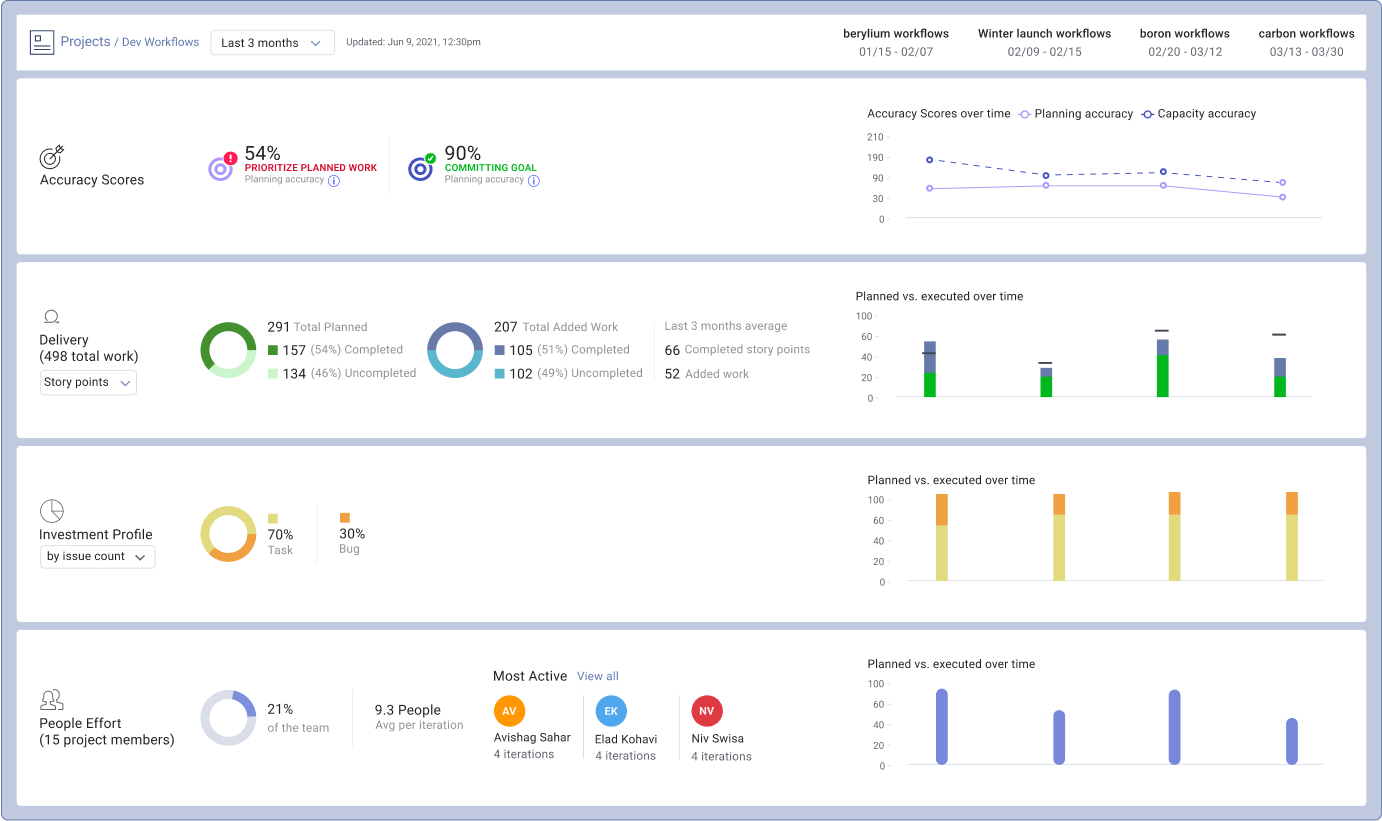
With Jira alone, finding useful data (if it’s there at all) can be hard. With LinearB, the metrics needed to update stakeholders and drive improvement are automatically generated and always accessible.
Automatically see trends and patterns across projects
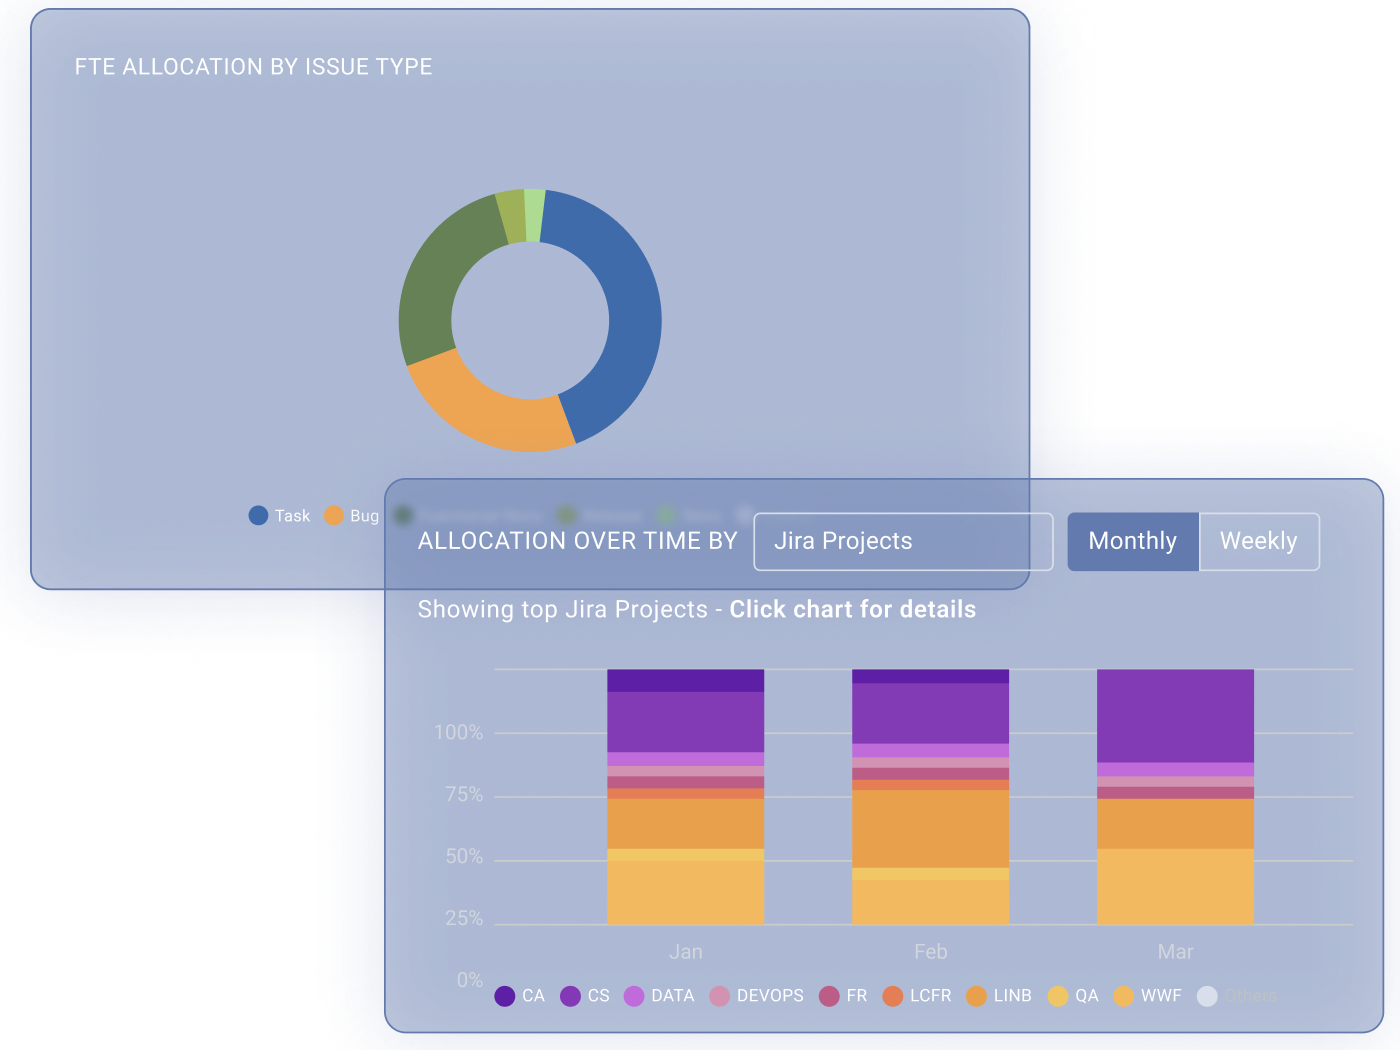
See where your team is spending time (and resources)
Get git, CI/CD, and project metrics in a unified, easy-to-read report
Get one view of metrics that spans teams, squads, boards, labels, epics, or any combination you want
Learn more
Get Actionable Jira Insights That Go Beyond Story Points
Correlate
Data
Simplify
Reporting
Customize
Views
Automate
Work
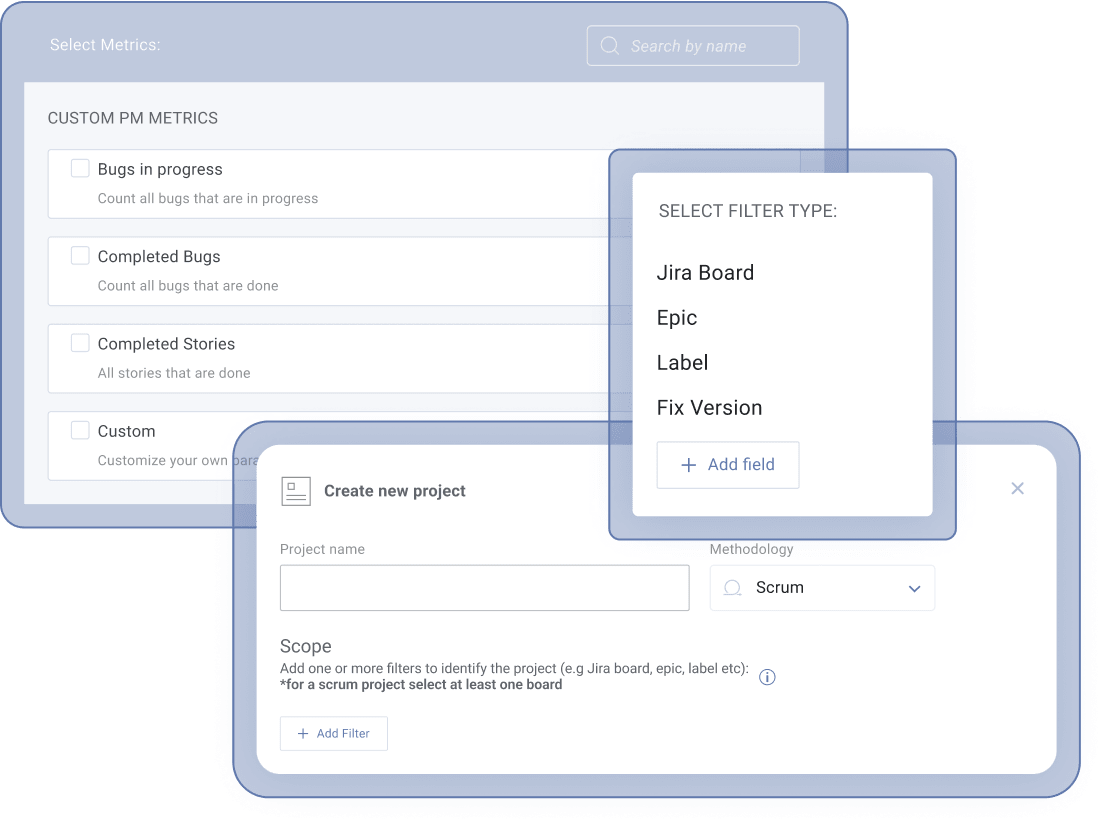
It can take hours, if not days, to create custom executive reports in Jira that showcase what engineering is doing in a meaningful way. With LinearB it takes minutes–no advanced Jira knowledge required.
See beyond velocity charts, sprint reports, or created issues
Build custom, easy-to-understand project reporting fast
Learn more
Get Actionable Jira Insights That Go Beyond Story Points
Correlate
Data
Simplify
Reporting
Customize
Views
Automate
Work
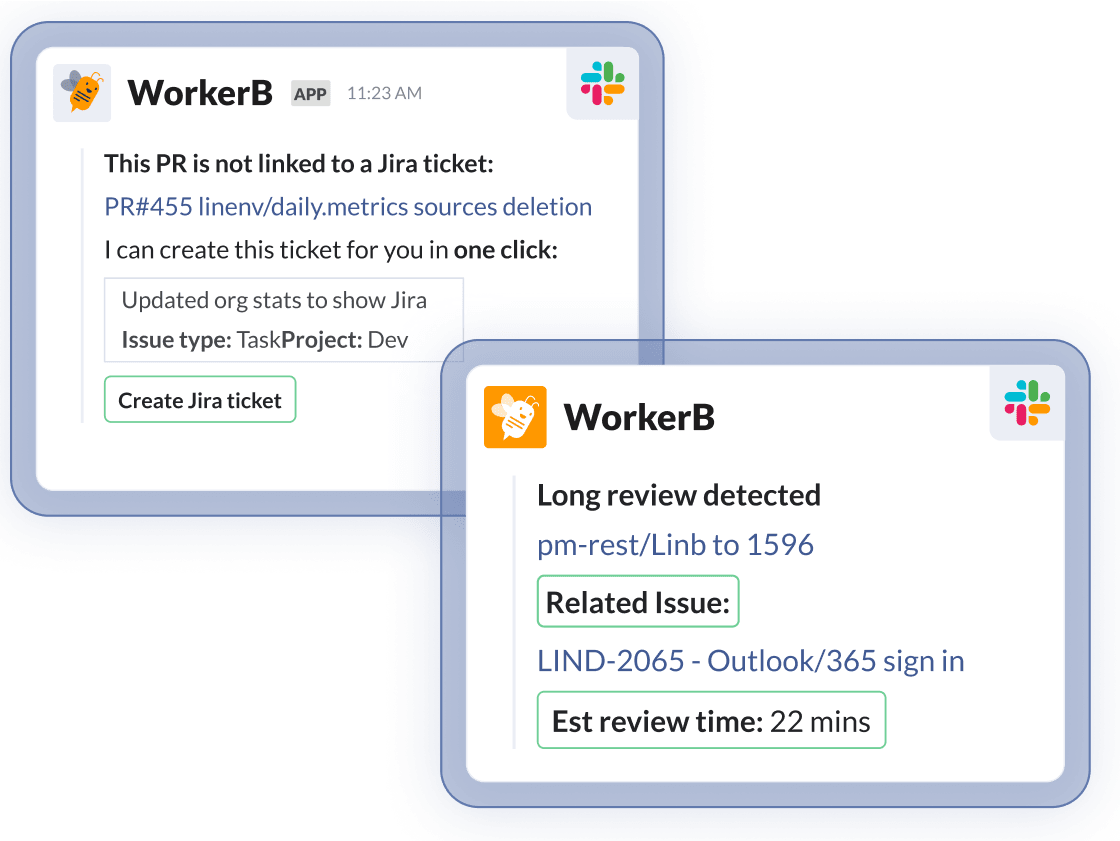
Jira’s achilles heel is that it depends on good data hygiene to be useful. But ask any dev how much they like data entry. LinearB solves this problem with automated tools to help ensure data integrity.
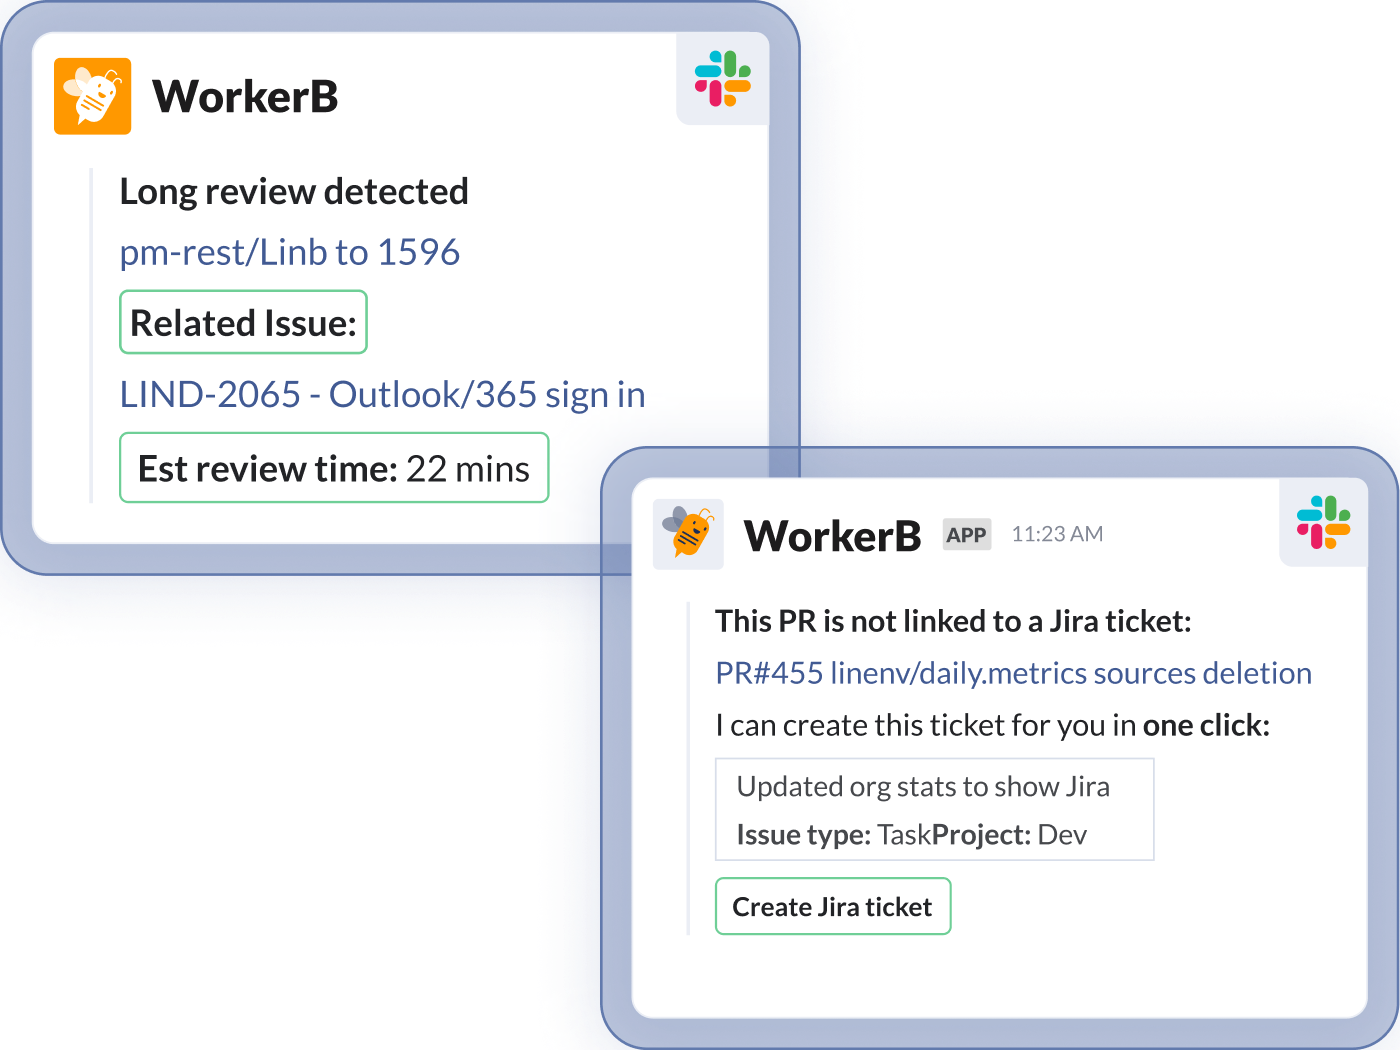
Create Jira tickets for unlinked branches in one click
Update status for issues branches without signing in to Jira
See issues names at IDs, git activity, contributors, and story points in one view–no manual input
Book a Demo
“It helped us hit the ground running when adapting health metrics into our process. We connected our Gitlab and Jira accounts, set up our squads and projects, and the tool delivered value to us straight away.”

Patrik L.
VP of Engineering
“LinearB provides excellent KPIs, industry benchmarks, and seamless Jira and Slack integrations. Highly recommended for improving team performance and achieving our OKRs.”

Ángel Blanco f.
G2 Review
“Actionable insights at the click of a button! I've been so impressed with the ability to drill down and identify tasks/projects which are at risk, where others I would have been stuck digging into Jira and Github manually.”

G2 Review
VP of Engineering
“It helped us hit the ground running when adapting health metrics into our process. We connected our Gitlab and Jira accounts, set up our squads and projects, and the tool delivered value to us straight away.”

Patrik L.
VP of Engineering
“LinearB provides excellent KPIs, industry benchmarks, and seamless Jira and Slack integrations. Highly recommended for improving team performance and achieving our OKRs.”

Ángel Blanco f.
G2 Review
“Actionable insights at the click of a button! I've been so impressed with the ability to drill down and identify tasks/projects which are at risk, where others I would have been stuck digging into Jira and Github manually.”

G2 Review
VP of Engineering
Unify Engineering Metrics and Business Impact Easily
1
Connect Jira On-Prem or In the Cloud
Use our step-by-step connection guide to quickly sync and backfill your Jira data into LinearB. The process is simple and straightforward. We’re also here to help if you need it!
2
Build Your First Project or Custom Report
One of the most powerful aspects about LinearB is its flexibility. Build a project using your boards, epics, labels, etc. or structure a team as a project to see their Planning Accuracy and work breakdown.
3
Gain Insight and Drive Improvement Efforts
Discovered that your team is getting bogged down with unplanned or added work? Delivery dates slipping as a result? Surface this with stakeholders and realign your teams’ focus on scoped work.
Want to Enhance Jira?
Get the visibility you’ve been missing with LinearB
Move Past Simple Reporting with Jira and Drive Improvement
“I used to wait around a lot during the dev process. Waiting for unit tests to pass, waiting for someone to pick up and approve my PR, waiting for the build to complete so I can cut a release… Since we adopted gitStream and WorkerB, I’m never waiting because I’m notified of all these events - my whole team is and everything moves much quicker now.”

Truong-An Thai
VP of Engineering
|
FloSports
The Engineering Leader’s Guide to Building a Metrics Program
Inside this comprehensive guide, you’ll find:
The philosophy and ingredients of an effective engineering
metrics program
An overview of why metrics programs have been difficult to
implement in the past
Practical, step-by-step guidance on building an improvement
strategy from the ground up
Get My Free Copy
