
What’s your cycle time? If you can’t answer it, don’t worry, you’re not alone. Many engineering leaders couldn’t tell you without some significant number-crunching. Gaining visibility into performance is only half the battle though. Knowing how to interpret metrics and how to apply them to improving performance is where the magic happens. Many CEOs do not know how to align engineering metrics to business KPIs (revenue, customer retention, etc.). Bringing metrics to your board or non-technical CEO for the first time may be challenging if you are unable to help them bridge the gap.
Understanding Your Organization’s Goals
Your CEO has a set of goals for the organization. They are used in executive & team meetings, pitch decks, QBRs, and more. Every organization is different, but most have some common threads: Grow the customer base, grow revenue or profitability, keep customers happy, scale the organization, and keep employees engaged and productive.
Your counterparts in marketing, sales, HR, etc. can draw a clear line between their goals and company goals. Marketing finds new customers and keeps existing customers engaged. Everyone understands that more leads today generally leads to more customers tomorrow.
Sales grows the revenue and has sales pipeline projections and closed sales metrics. HR grows and supports the team and typically can show “people analytics”. Sharp CEOs understand the connection from employee engagement and happiness to increased revenue.
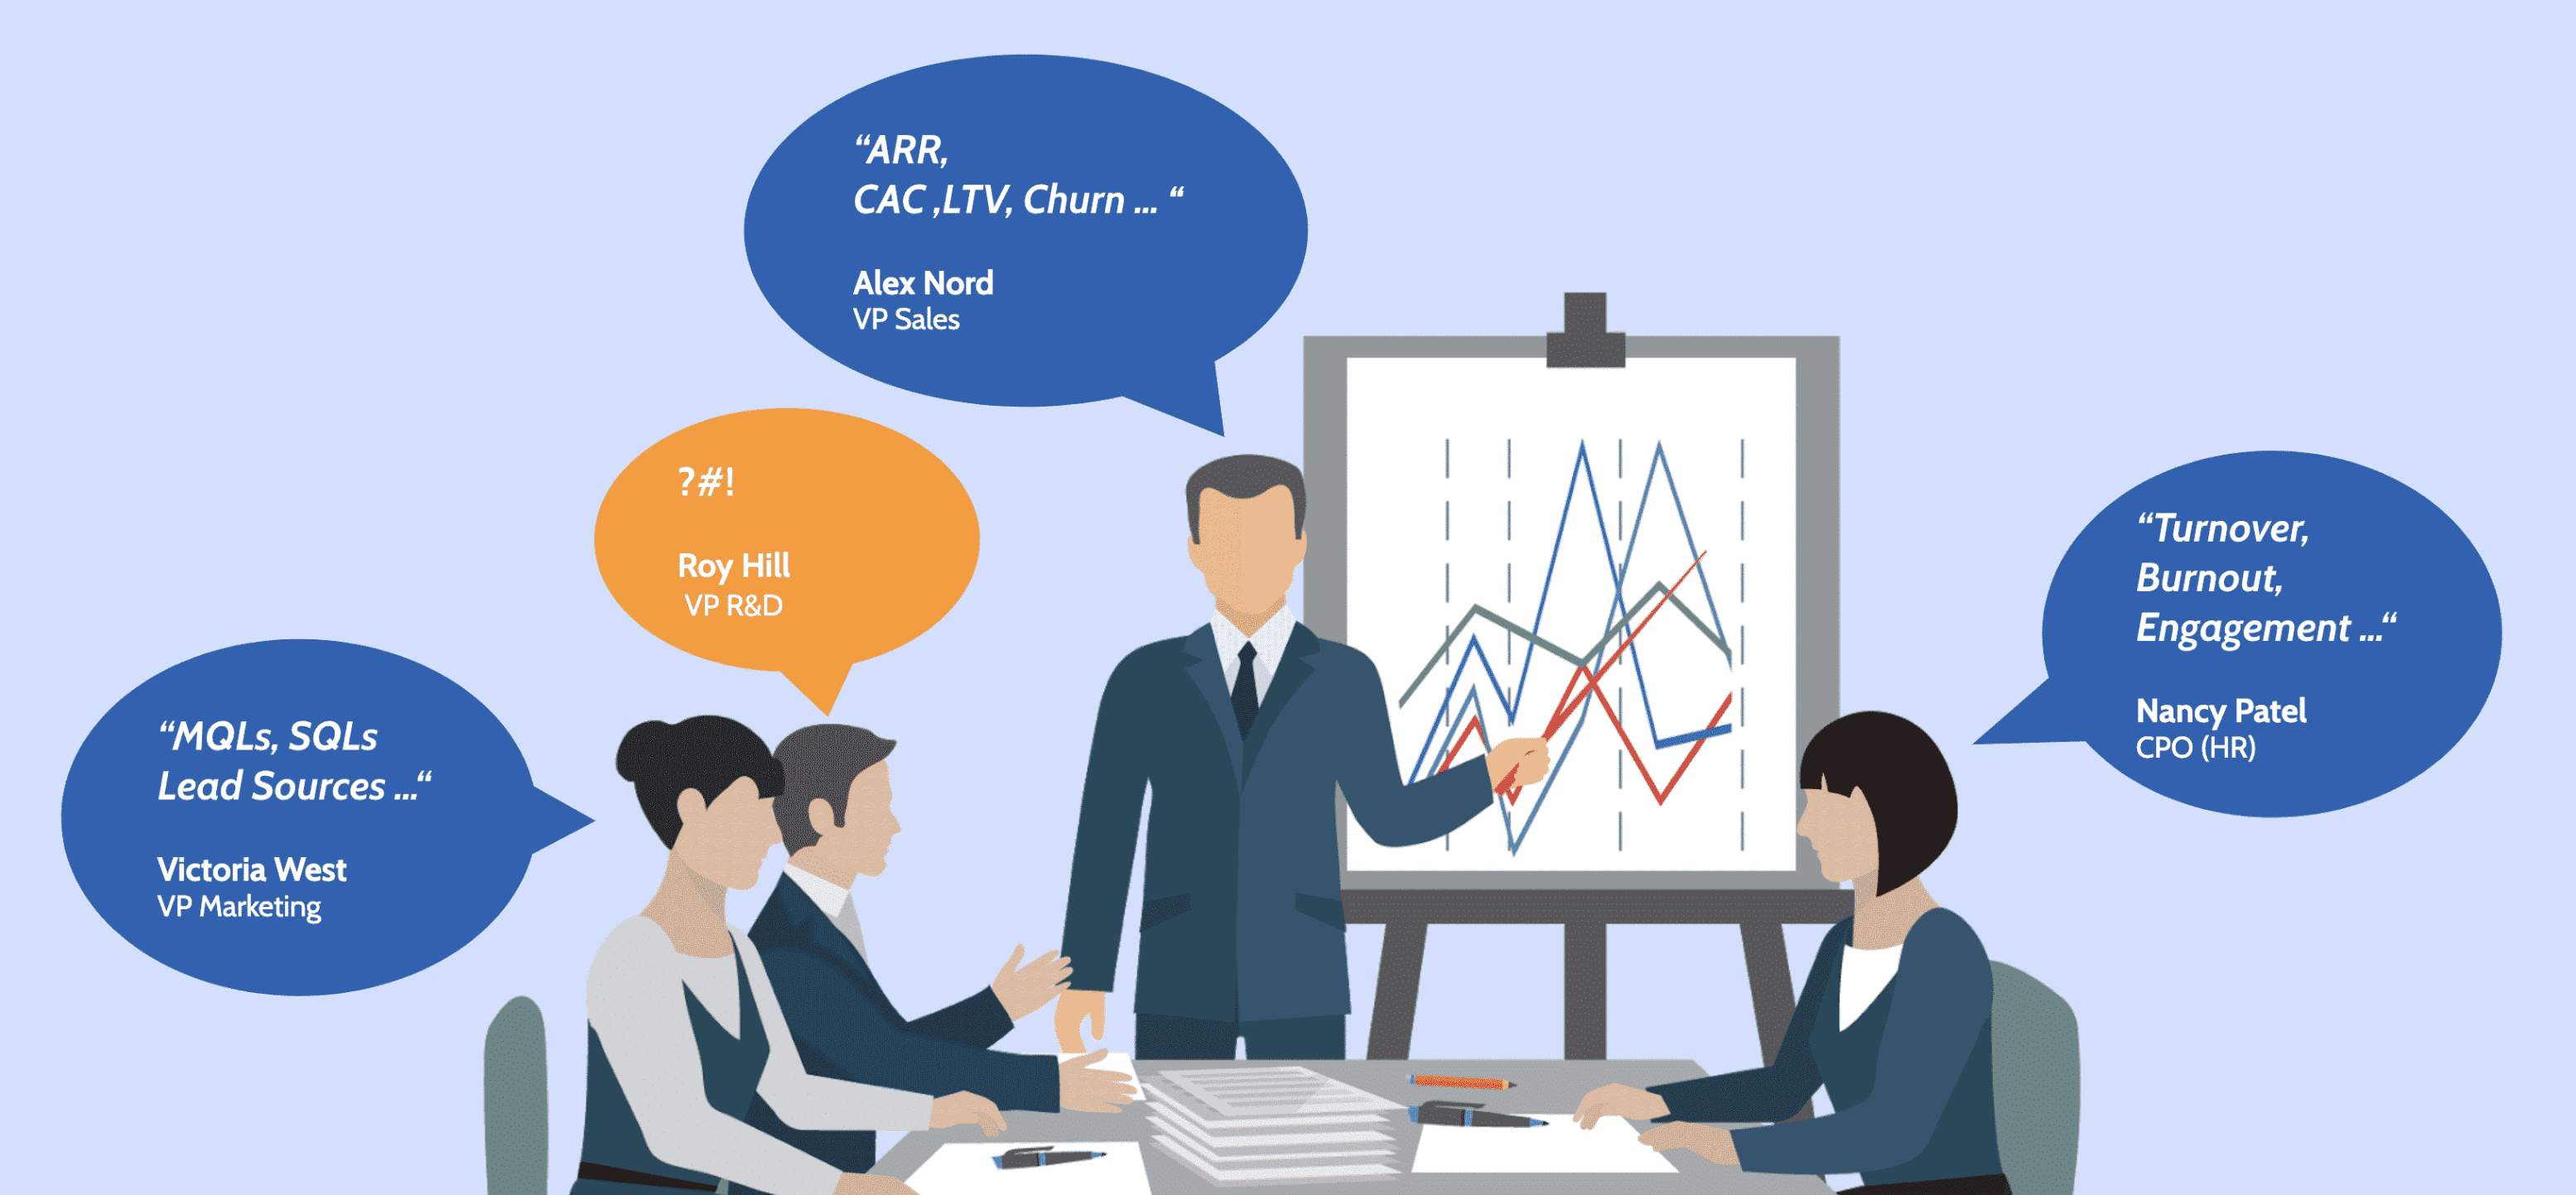
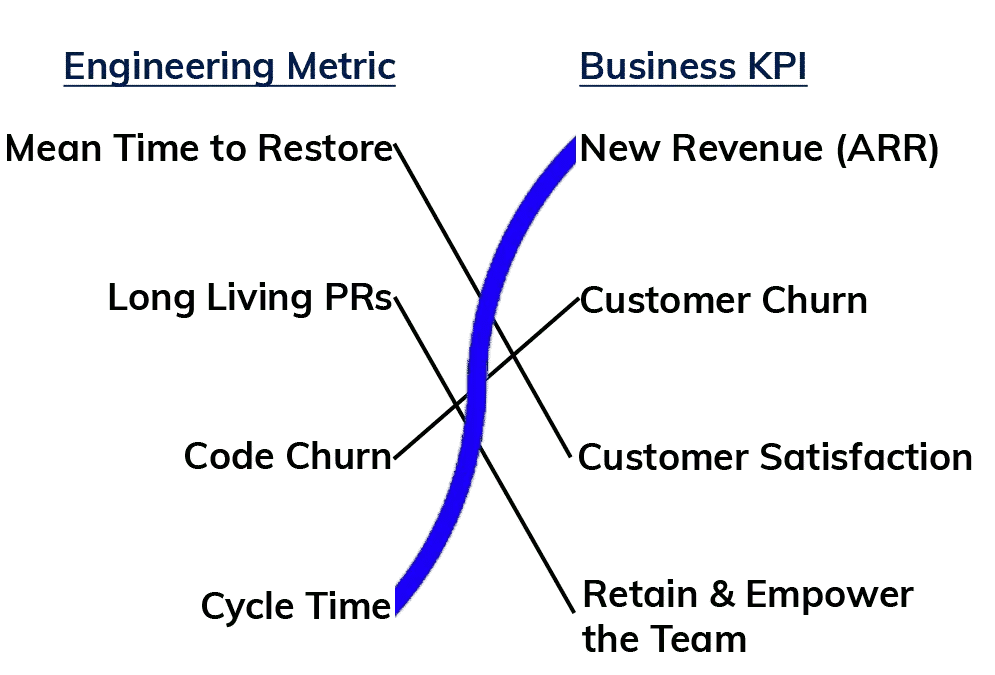
As dev leaders, we spend much of our time translating engineering velocity to business value. But which engineering metrics line up to business KPIs?
Aligning engineering metrics to business KPIs. It’s not easy, but it’s worth it!
How to Align Software Engineering Metrics to Business KPIs
Are your metrics aligned to the company’s goals? And what metrics help you track progress? Moreover, does your team know their goals and how they relate to the organization’s goals?
Here are some examples of how leaders can use metrics to improve team and organizational performance and better demonstrate value to your team, peers, board, and CEO.
Grow Revenue:
For most CEOs, this is the most important goal they must achieve. Many engineering leaders have experienced the conversation with the CEO asking “when is this new functionality going to be ready?” New value delivery is tied directly to customer acquisition and upselling.
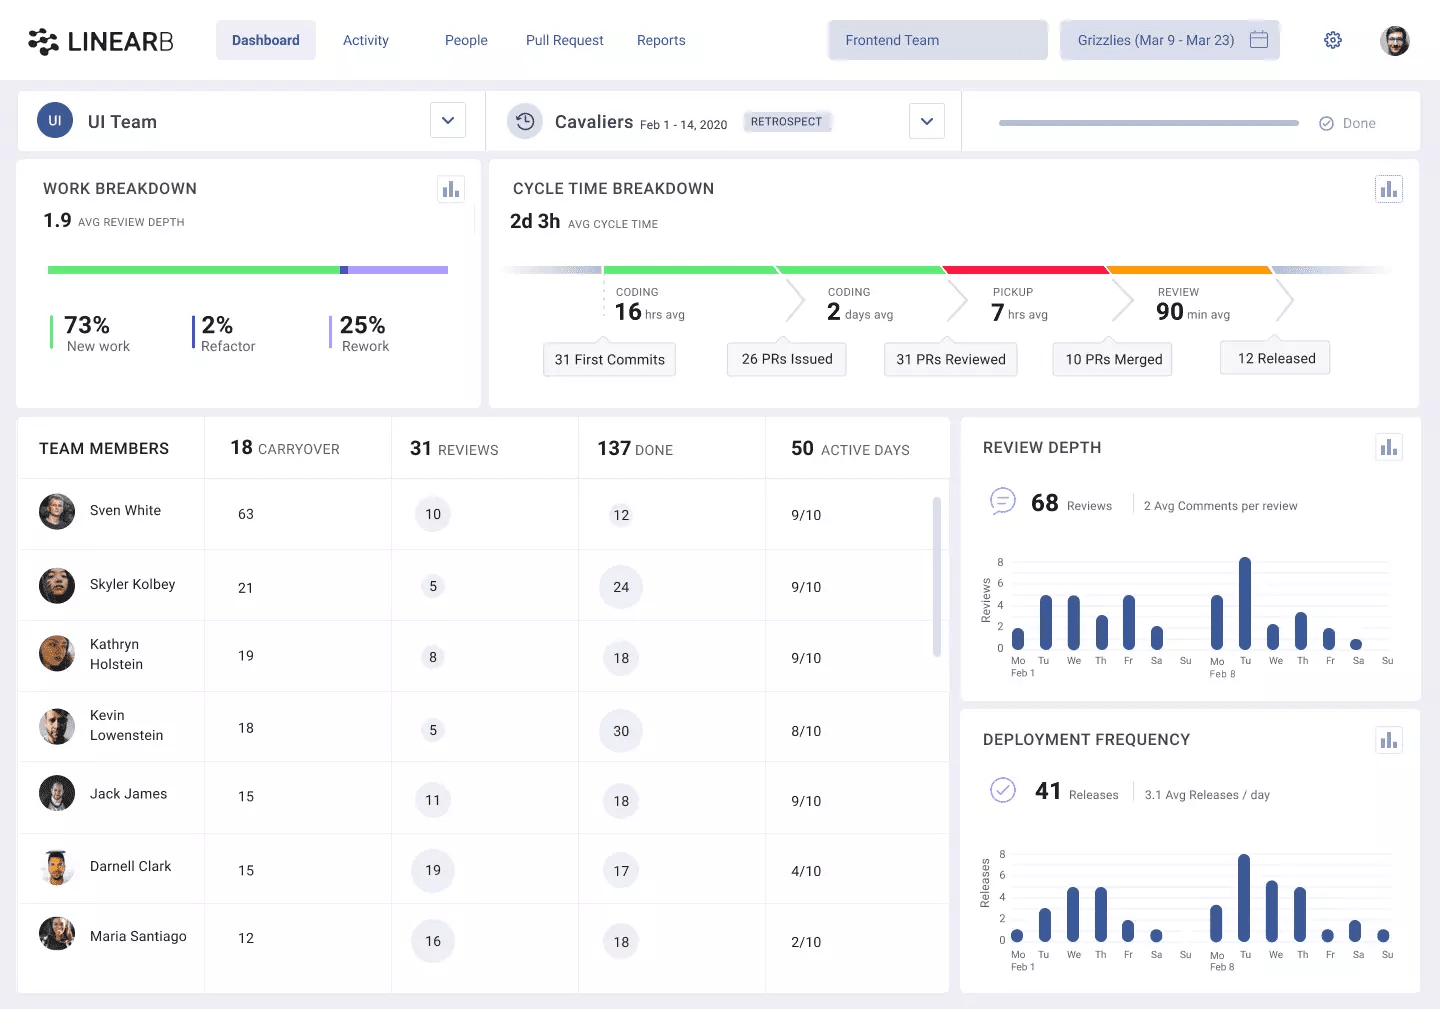
To support this goal you need to track and minimize your cycle time. (Learn more about Cycle Time). Cycle time can be broken down into different timespans that construct it. Shorter cycle times indicate an optimized process, and faster time to market. Shorter cycle times for software teams lead to increased revenue, high customer renewal rates, and a happy efficient development organization. This helps your team deliver new value more predictably. Enhancing the speed and cadence of new value delivery enables marketing and sales to generate and close leads, leading to new revenue.
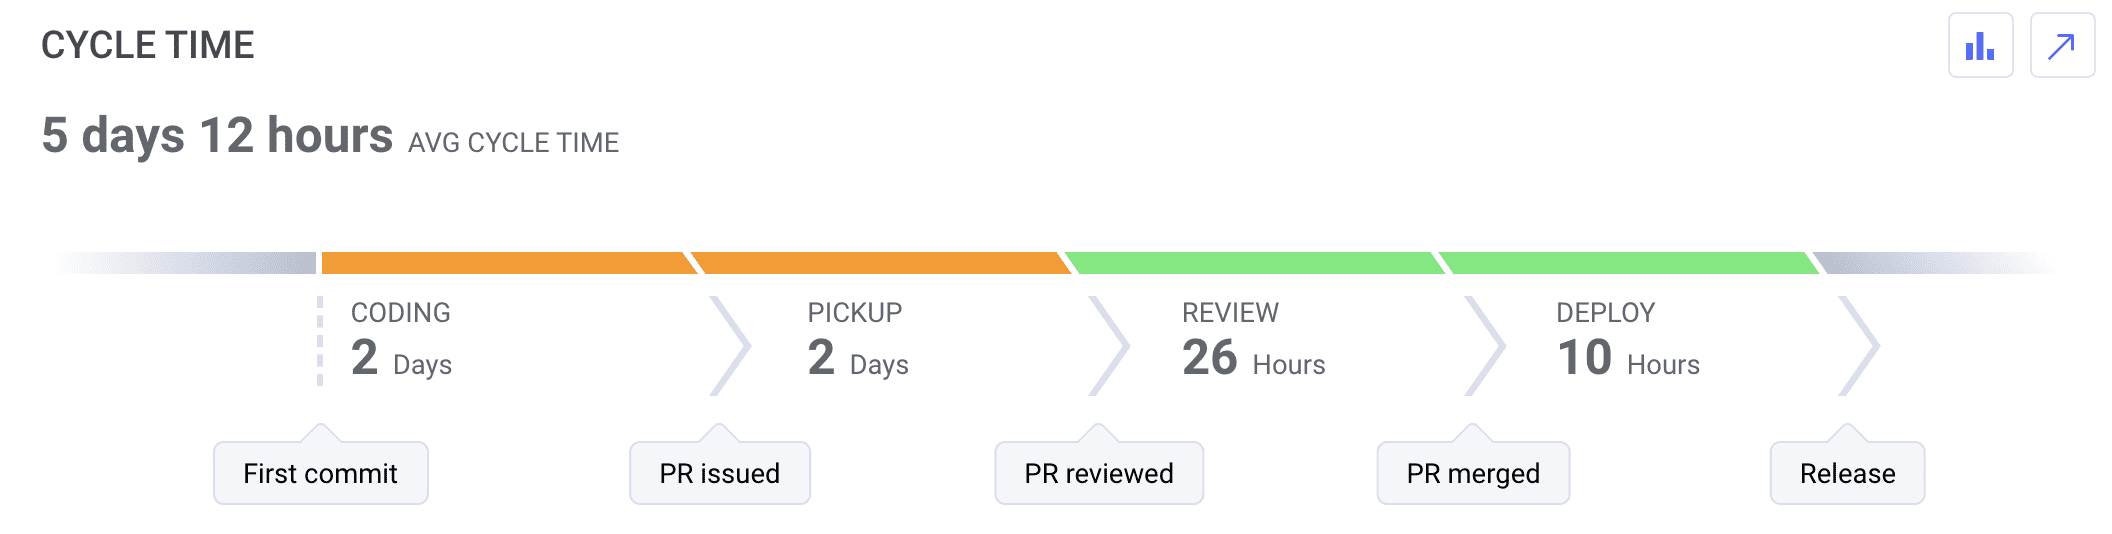
A lot of organizations have used velocity as a productivity metric. It’s a bad idea. See why agile velocity is the most dangerous metric. Instead, pay attention to your cycle time, visualized above in LinearB.
Reduce Customer Churn:
Second only to revenue in most organizations is a goal of keeping customers happy. In SaaS companies, this usually is around customer churn, ensuring as many customers renew as possible. In more enterprise companies, the goal is usually framed in terms of customer satisfaction.
Many engineering teams track bugs in production and while this is important, it’s a lagging indicator. To keep customer churn low, it is better to be proactive about managing your quality. Some key metrics to ensure quality include rework %, as well as tracking lightning PRs, long-living PRs, review depth, and MTTR (Mean Time to Restore),
//side note: MTTR is important not only because you recover fast but also because it gives you confidence to fail with minimal impact and hence you can release more often.
Proactively managing your quality requires visibility into “risky” work BEFORE it gets deployed. LinearB provides alerting on long-living PRs, PRs merged without review and other risky work. Using these tools will help lower your escape rate and minimize customer churn.
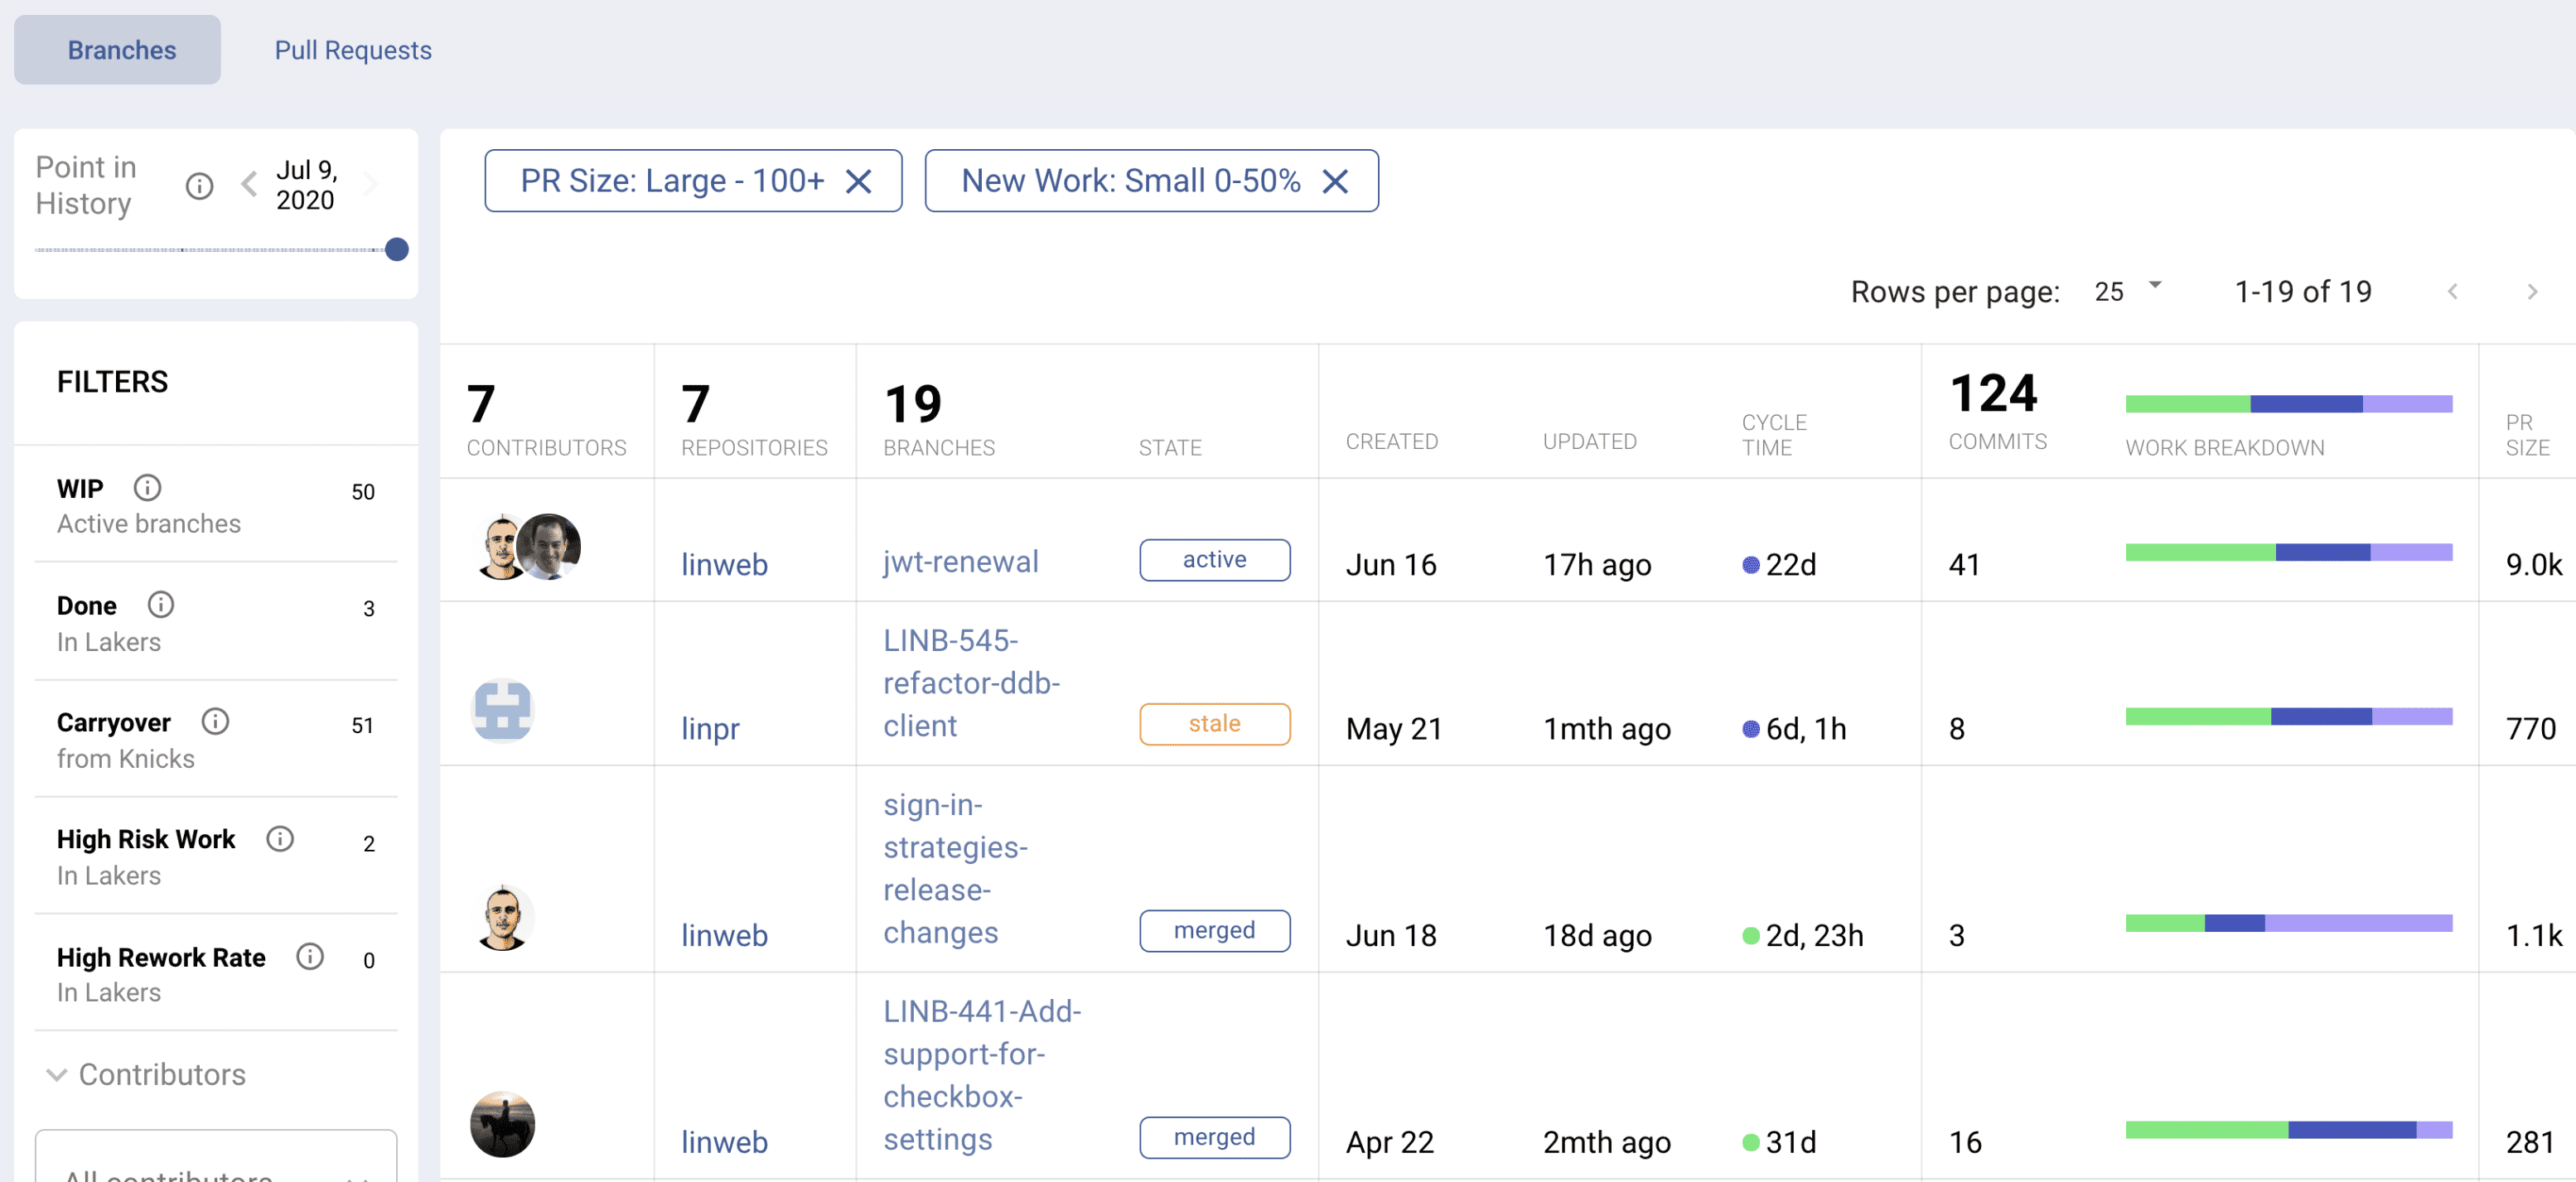
LinearB filter showing “risky work” in branches, work with large code changes and large amounts of rework.
Retain and Empower Your Team
Executive leaders understand that the success of the business is highly dependent on people. Many businesses spent significant effort in creating an environment designed to keep their people happy (see ping pong tables, free snacks and soda, etc). Beyond having a cool office, having work processes that enable your engineers to thrive happily will prove to be best for your delivery and retaining your best team members.
Happy developers work in an environment where they are easily able to deliver their work to production, are part of a team that values continuous improvement, and are not distracted by production fires.
A few engineering metrics that describe a developer’s ability to efficiently deliver code to production include Time to Pull Request Review and Long Living Pull Request Rate. LinearB enables engineering leaders to track Time to Pull Request Review and alerts teams on Pull Requests that have been open for a long period of time for proactive improvement.
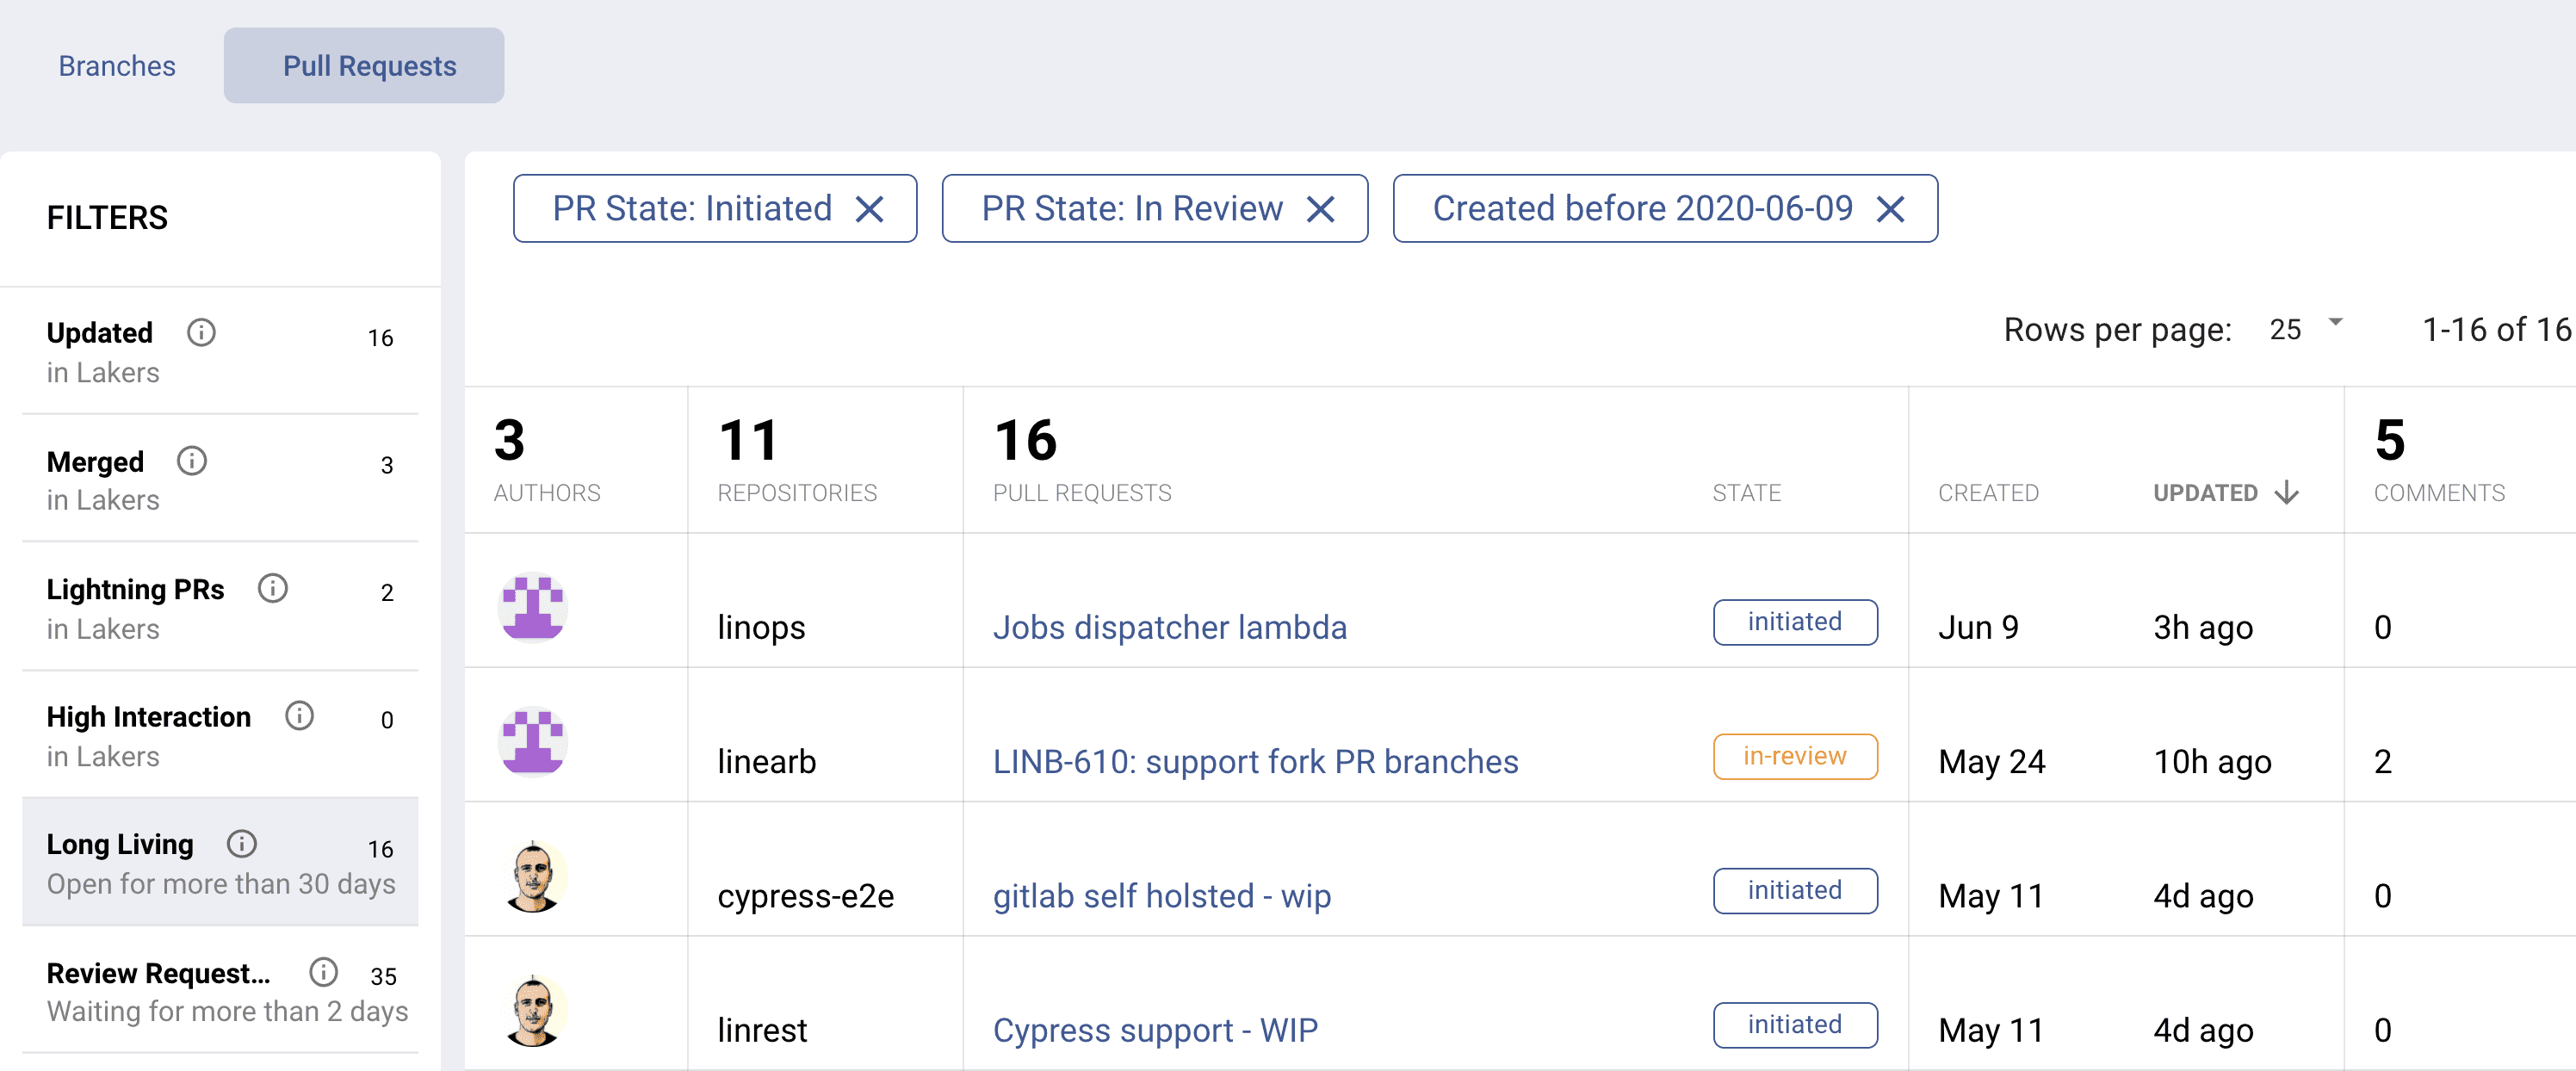
Long Living PRs tracked in LinearB
Production fires cause unexpected interrupts and are happiness killers for software developers. Tracking bugs found in production and proactively identifying high risk work while code is still being developed in branches will limit the amount fire interrupts.
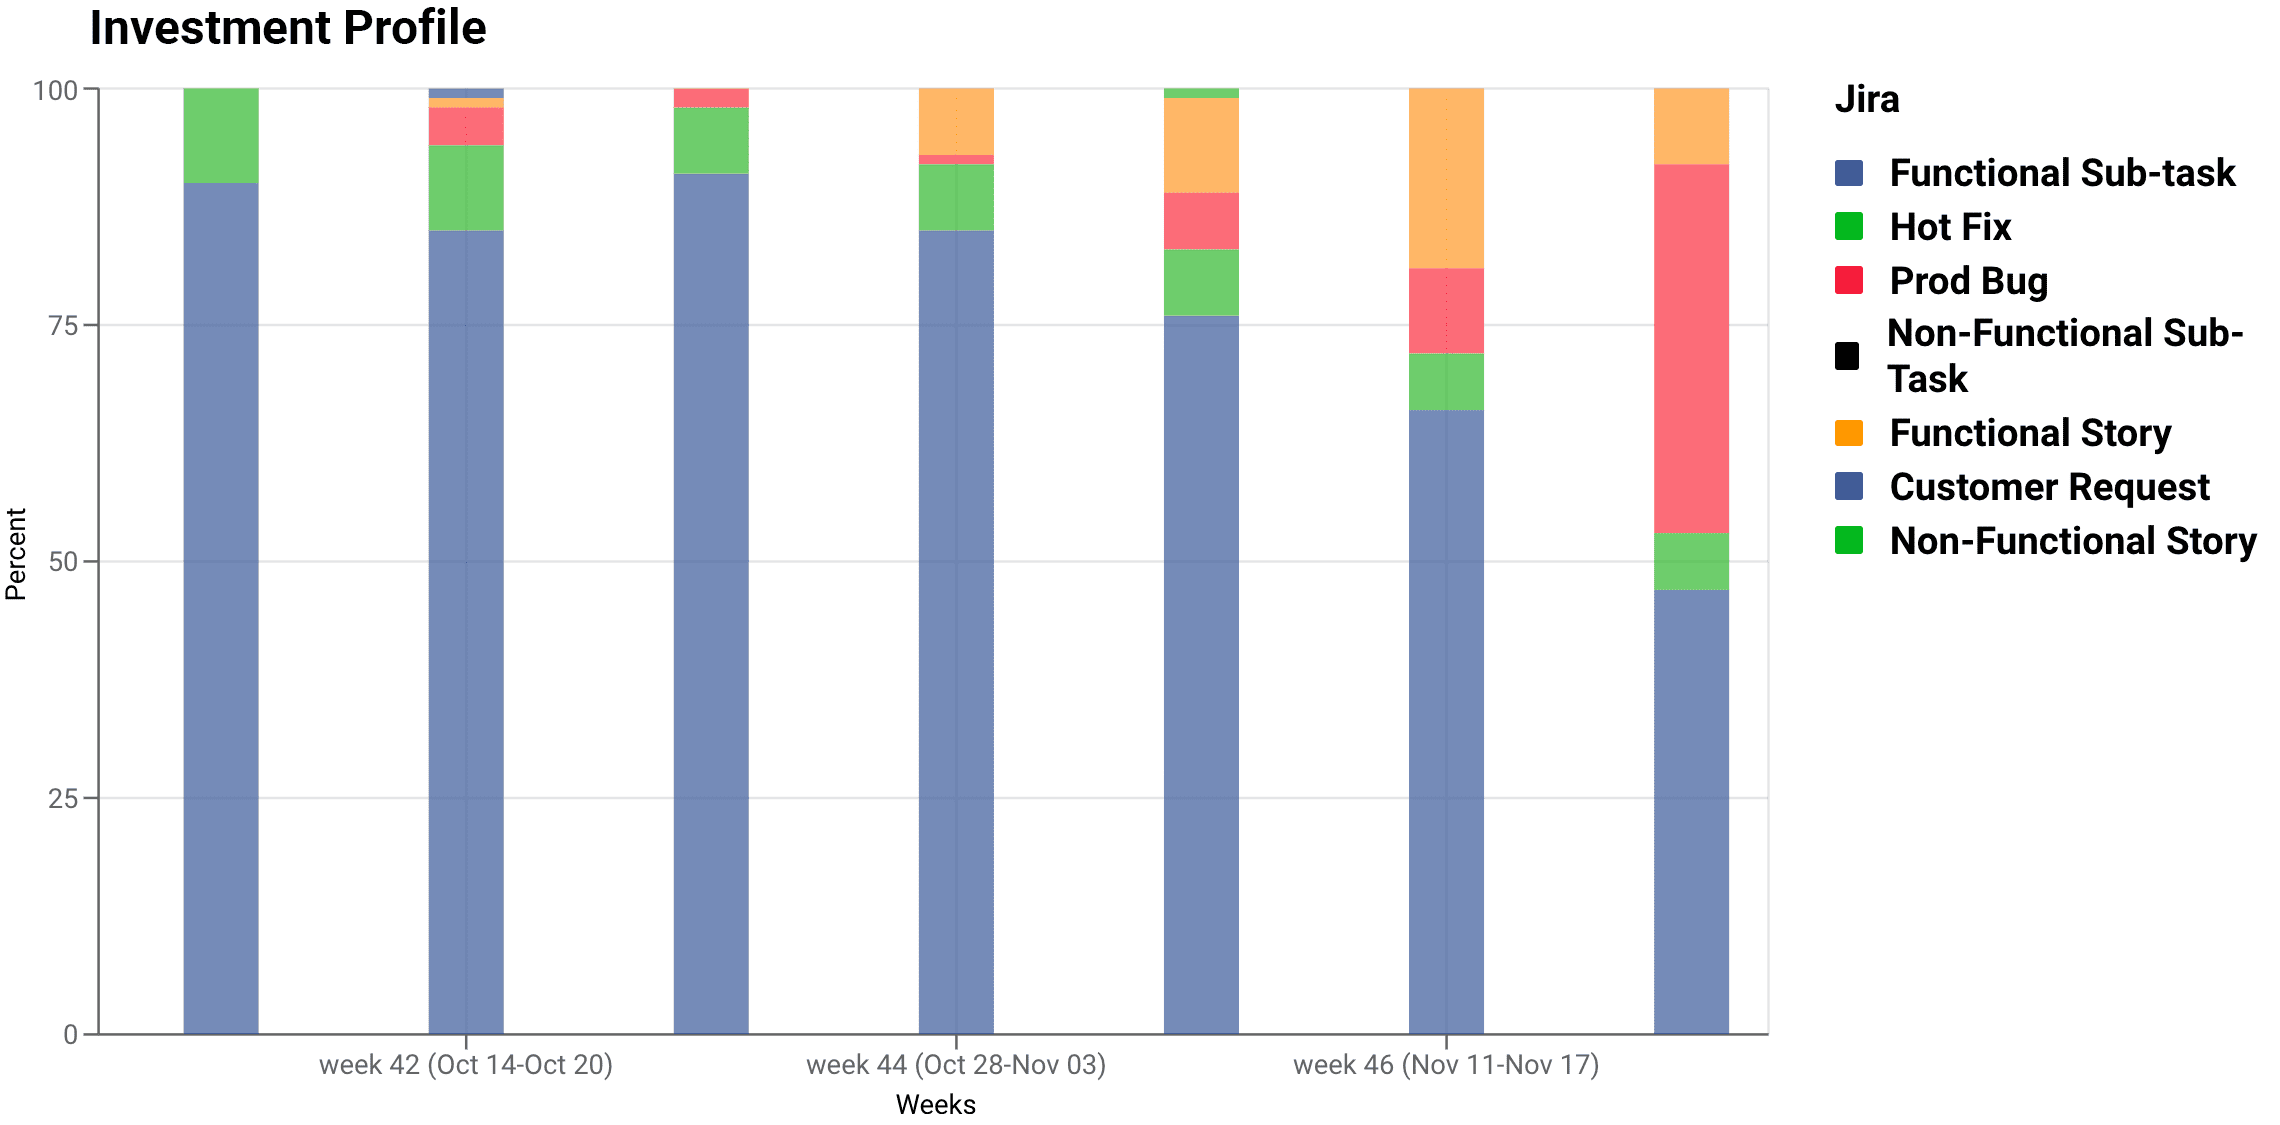
Track your investment profile in LinearB to see where Production Bugs are derailing your iterations.
Develop Your Team Leaders, Scale Your Team
The success of your team leaders will lead to the success of your engineering organization. The promotion and growth of your internal leaders will enable you to scale and retain your workforce. The trouble for many new team leaders is they do not have a framework for continuous improvement and do not have any reference points for improvement conversations with their boss (possibly you).
The art of continuous improvement for software teams starts with the foundation of measurement and visibility. Retrospective meetings are a great place for teams to review and set goals for improvement, but this can be difficult without a visualized data-driven report. LinearB provides an automated retrospective dashboard for all teams to enable a continuous improvement environment and set goals with improvement tracking.
LinearB provides an operating framework that allows all leaders to improve their teams using metrics in key operational areas, including delivery, quality, and investment.
Conclusion
The right metrics make all the difference for engineering leaders who are striving to be more data-driven. Aligning metrics to business KPIs will empower you and your team to improve the way you work and improve communication with your CEO and executive peers.
LinearB gives engineering leaders a framework of key metrics in a SaaS-based platform. Ready to see your metrics? Sign up free for LinearB today.