
So you decided to become an engineering leader.
Congrats, your ability to pay your mortgage now depends on your team’s capacity to reflect regularly on how to become more effective, and then tune and adjust its behavior accordingly (Agile Manifesto Principle #12).
Now you’re asking yourself:
- How do you know if your team is more (or less) effective this sprint than it was the last sprint?
- Is that level of productivity good or bad by industry standards?
- What levers can you pull to increase your team’s effectiveness?
Peter Drucker said, “You can’t improve what you don’t measure.” But we think there’s more of an art to it than that.
The Right Engineering KPI Metrics to Track
One of the most common anti-patterns with engineering performance metrics thinking that one piece of data can solve every problem. This is an extremely common trap with agile velocity. More on that here.
The reality is, of course, that no metric can or should do that. The best ones should help you make better decisions by providing an additional data point for discussion and analysis.
But then what are the best engineering performance metrics? Here are five that can help you measure and manage your team’s progress.
Cycle Time
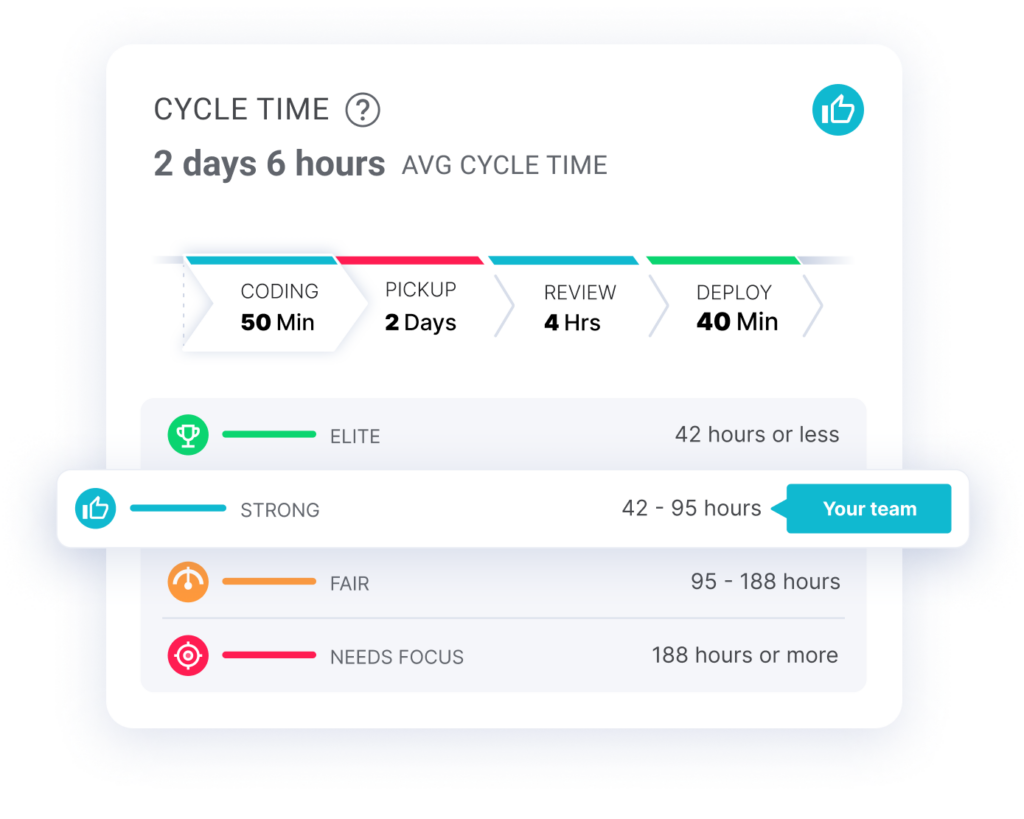
Cycle time, also known as lead time for changes, measures the time from first commit to production release. At LinearB, we break down cycle time into four phases: coding time, pickup time, review time and deploy time.
High cycle times are most often caused by bottlenecks in the code review process. They reduce engineering efficiency, which means software development teams are unlikely to deliver features predictably.
Deployment Frequency
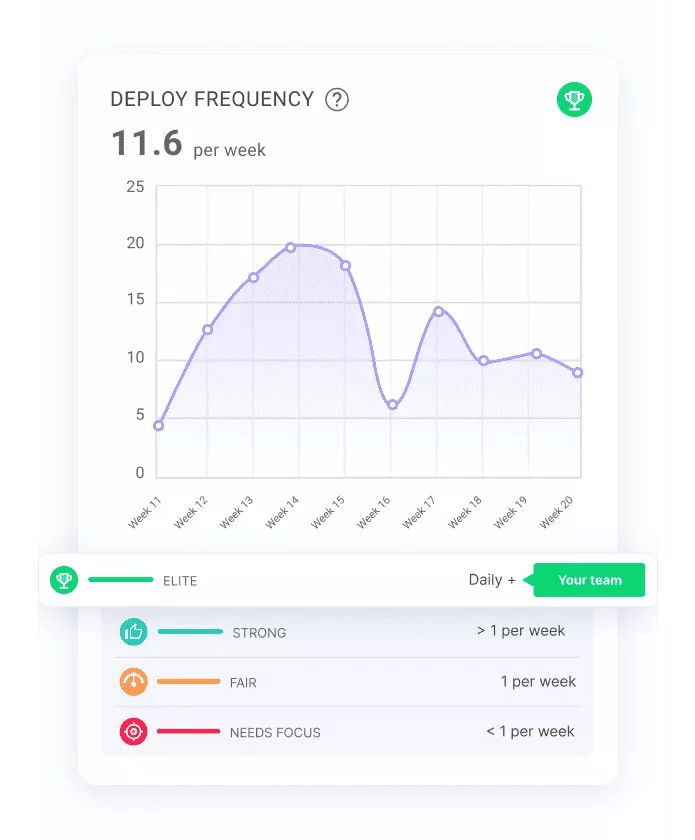
Deployment frequency measures your team’s ability to push new code to production quickly and efficiently.
A high deployment frequency indicates that your team is able to make code changes frequently without a lot of drama or delay. This, in turn, indicates that your team is deploying small chunks of code, has a good understanding of their toolchain, and is using continuous integration / continuous delivery (CI/CD) processes effectively.
You likely have a low deployment frequency if your team only deploys to production once per week or month. This usually indicates that the team is afraid of breaking things and doesn’t trust their automated tests, which may suggest their deployments are full of large pull requests that were difficult for the team to review.
Our recent study on what makes engineering teams elite shows that the top 10% of software engineering teams deploy code daily. See how your team stacks up.
Pull Request Size
As mentioned above, the size of a pull request has a trickle-down effect on deployment frequency. Now I know I said no metric can solve every problem, but PR Size should be the first engineering KPI every team tracks because it has the biggest impact on your productivity.
Check out our presentation on the topic from Interact.
Smaller PRs are generally easier to review and understand. They also tend to have fewer merge conflicts.
As a rule of thumb, PRs should be small enough that they can be reviewed and merged in a single sitting. If you find that your team is regularly creating PRs that are hundreds or thousands of lines of code, that’s a sign that the PRs are too large and need to be broken down into smaller chunks.
Rework Rate
So what happens when your pull requests are huge and your code is tightly coupled? Fixing bugs becomes a walk through a minefield.

For every bug you fix, two more pop up because you messed with an invisible dependency. Once unit tests start failing, the completed issue gets reopened and dumped back in your lap as rework.
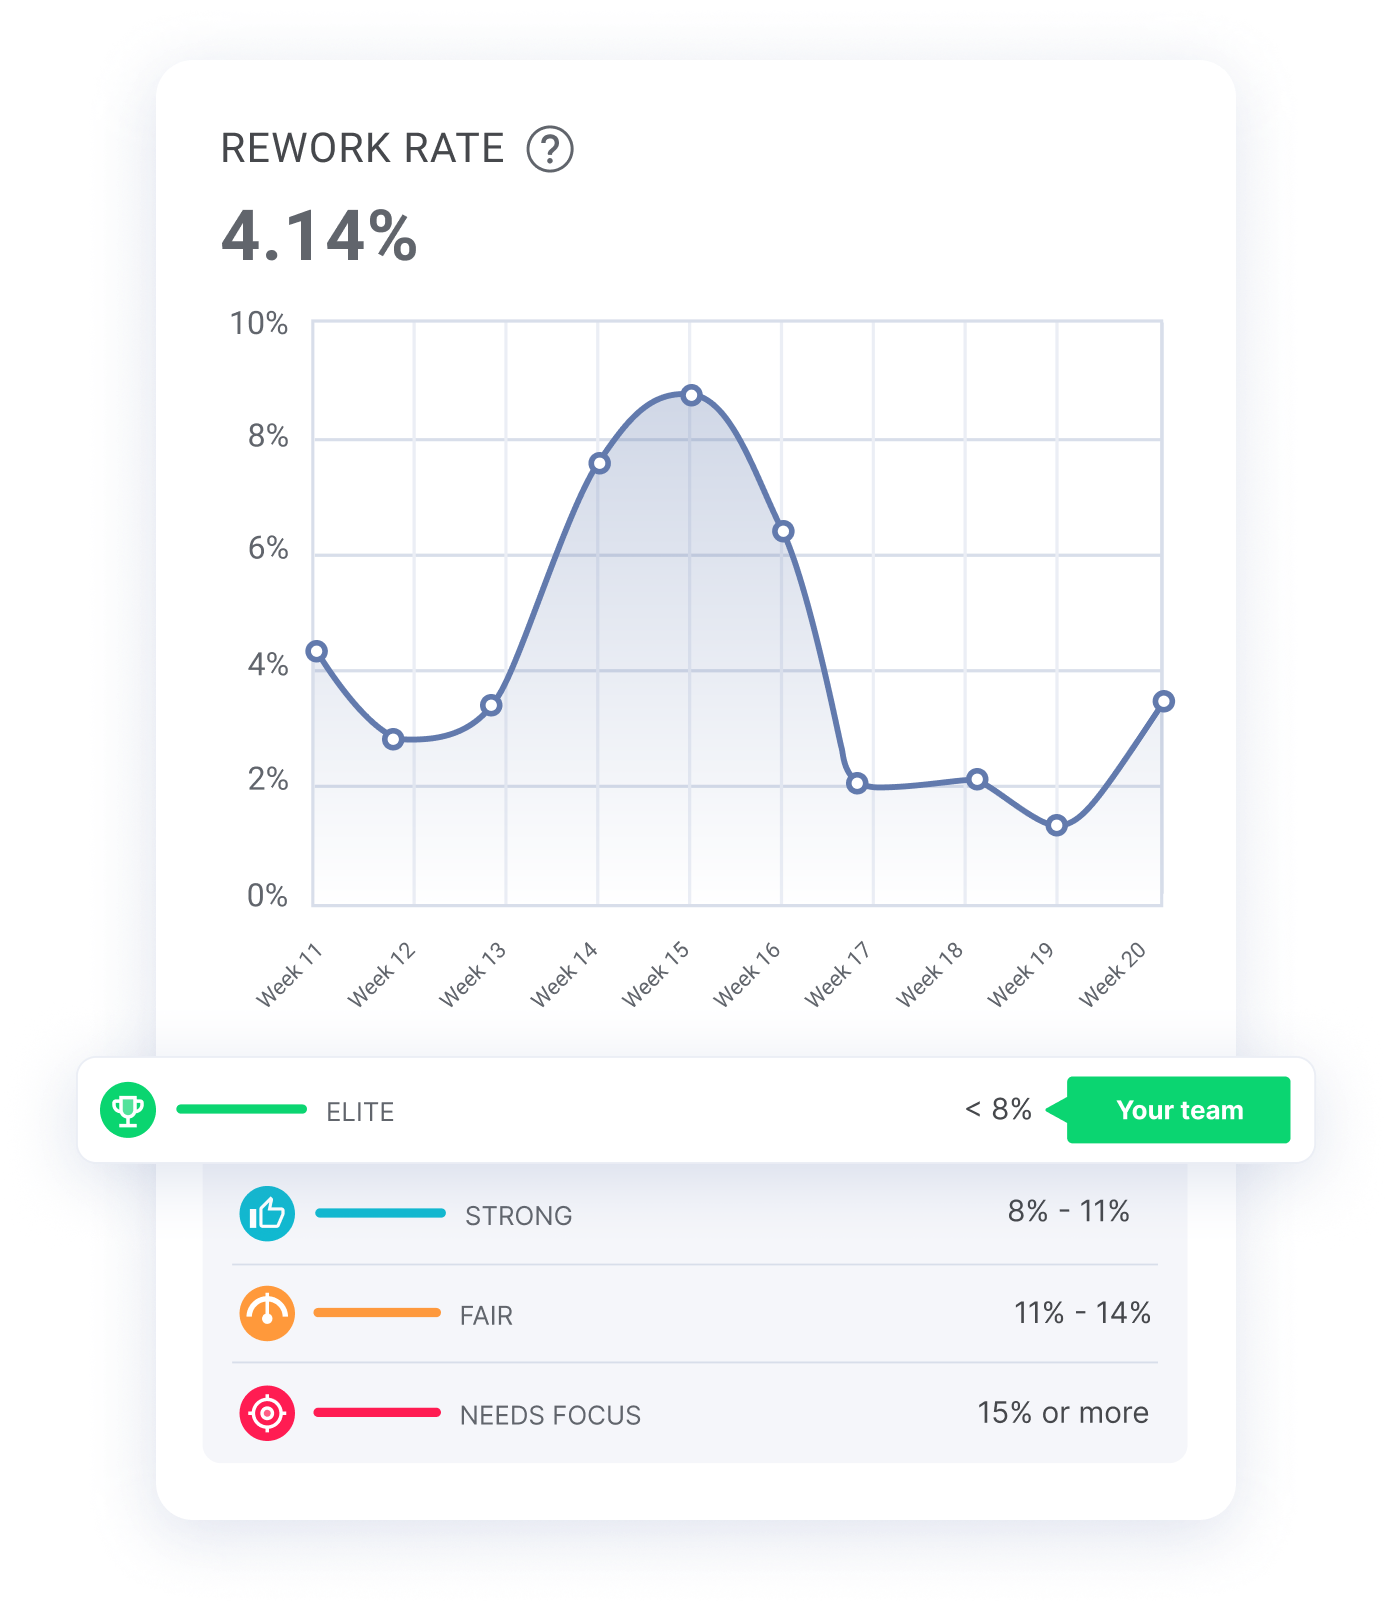
That’s not to say that you’ll never have rework or that all rework is bad. No matter how skilled your developers are, it’s impossible for your team to have zero code rewrites. But a high rework rate is definitely an indicator of code quality issues.
Our research shows that elite teams keep their rework rate below 8%. And ideally, you’re never letting it surpass 15%.
Planning Accuracy
“Are we on track to deliver feature XYZ by the deadline?”
You probably hear this question at least once a week…once a day…once before you finished your first cup of coffee today.

Predicting the future is hard. In fact, the industry average for planning accuracy is less than 50%. That means that engineering leaders are wrong more than they’re right.
Even the most elite engineering teams are only 80% accurate. Their secret is that they focus on optimizing their developer workflow and improving the first four metrics in this list. And they talk about how to improve them with their devs during sprint retrospectives.
The Right Way to Track Engineering Performance Metrics
The tools you already use to track your engineering projects don’t provide engineering KPI metrics right out of the box.
Jira reporting isn’t the best.  You already know this.
You’ve probably experienced the frustrations that these tools never quite seem to nail the metric you actually want to measure. Getting there usually requires its own mini-development project.
So our co-founders Ori and Dan, started one and built dashboards that provided actually useful engineering KPIs. But they didn’t just stop at metrics because metrics alone don’t improve dev teams.
The LinearB approach couples developer workflow optimization with value stream management to help engineering teams deliver on their promises and ship features faster.
By combining these five engineering performance metrics with our customizable team goals and WorkerB bot, you can develop a plan during your sprint retros to actually start improving.
Let’s take pull request size for example:
- Set a goal with your team to keep PRs under 200 code changes
- Set your WorkerB team goals to smooth out PR handoffs
- Automate real-time alerts to the team about goals
- Look at your metrics to see if your team is hitting the mark and if action needs to be taken
It’s really that simple.
Stop fighting with Jira reporting. Stop avoiding the dreaded questions about feature deadlines. Focus on improving one or two metrics in a sprint.
As PR sizes get smaller, cycle time and rework rates decrease and deployment frequency increases, which leads to a more predictable team that can increase its planning accuracy and deliver more features faster.


