TLDR: By using quantifiable software engineering intelligence data, Matt Culver and the engineering team at Super are able to:
- Provide a great developer experience
- Surface coaching and improvement opportunities
- Make operations more stable, uniform, and consistent
- Institute healthy engineering management practices and culture
Super–a thematic “super app”–makes it easy for customers to build credit, earn rewards on their purchases, and save big on travel–all through a sleek, simple, unified UI that makes the process fun and delights customers.
The engineering team–responsible for product development, delivers a great UX and is taking the financial world by storm. But their operational success isn’t only measured in output, it’s also how they work that is worth noting.
When Super approached LinearB, they had some pretty ambitious goals–chief among them were establishing a healthy culture and great developer experience centered around:
- Support and professional development
- Proactive, data-driven decision making
- Operational consistency and efficiency
In this initiative they’ve succeeded.
Support and Transparent Coaching Create Best Practices
Rather than identifying “problem” areas or performance gaps that need to be managed, the Office of the Vice President of Engineering (OVPE)–responsible for delivering great DevEx and operational efficiency, among other results–has adopted a data-driven coaching practice that emphasizes a culture of servant leadership and engineering excellence above all else.
“This is the first organization where I’ve been able to successfully manage proactively with data.” says Matt Culver, who heads up the operational arm of OVPE. “We’re moving far past the notional management of ‘Did the project get completed?’. There’s so much more to the SDLC than a simple binary of whether or not that key result was complete or not.”
The subject of these coaching sessions is all about fostering positive atomic habits, good discipline, and operational rigor that can easily translate to a team of 4 or 40. By ensuring developers understand the mission, the relationship between metrics, and the increased value they’re creating through greater efficiency. When the whole team improves, all boats rise–developers are able to progress professionally, and Super sees more business value.
Data Analysis Highlights Opportunities
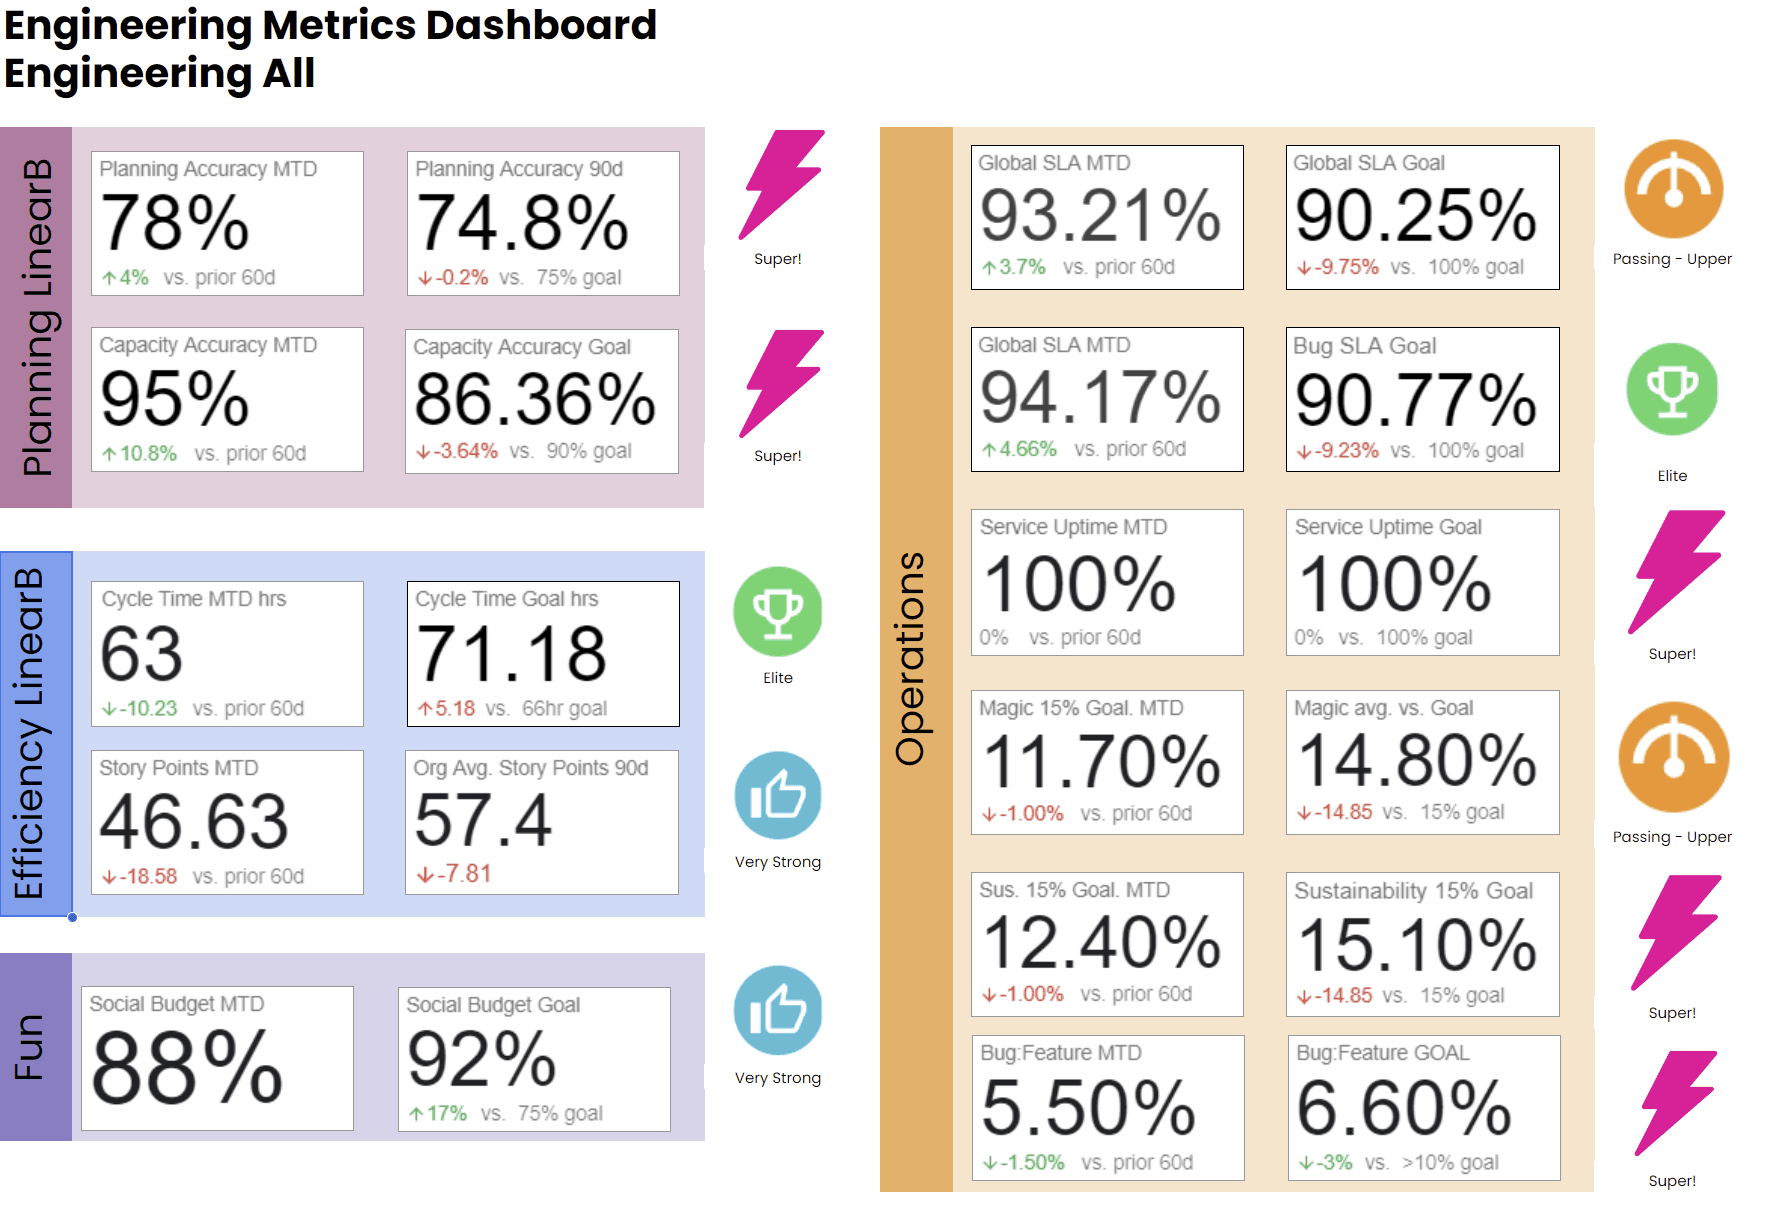
The team at Super has created custom team scorecards that provide a 360-degree view of engineering health using a modified SPACE metrics framework, which includes keystone metrics for Planning and Capacity Accuracy, efficiency, as well as KPIs for various other operational metrics. Just as important as the metrics themselves, the correlation between metrics, trends, and performance against improvement goals are also analyzed and shared sprint over sprint. 
It’s through this constant analysis that Super had an epiphany: organizational discipline cuts across all teams, regardless of size or mission. The key is a culture of engineering excellence to ensure the same uniform practices exist on every team in order to deliver on-trend improvements.
“A team of 2 can’t deliver the same output as a team of 8 so not all productivity measures are directly comparable, but comparing how teams manage planning and grooming rituals is. That’s what I'm trying to improve: our practice and cadences, and we know that that discipline has to be built at the cultural level.”
- Matt Culver
In addition to pattern recognition, the Super team uses LinearB to dive deeper into key data points–like a spike in Cycle time or PR size. The team then uses that telemetry to ask and answer a single question: “What’s going on right here?” Anchoring coaching sessions around this data leads to more productive conversation and serves as a starting point for getting to the heart of blockers so teams can learn and improve from the metrics provided by the tool.
Operational Consistency is the Key to Good Culture
To Matt and the Super team, efficiency and health are the top two priorities. Using metrics like Planning Accuracy and Capacity Accuracy, they were able to focus their efforts on addressing a pretty common problem across the technology industry: tail loading work at the end of a sprint or quarter.
An all-to-common scenario is that teams get busier and busier as time goes on, which often requires teams to push harder at the end of a sprint or quarter to meet their goals. Super, like every technology organization prioritizes delivery and getting the work done. But a key difference is their focus on how that work gets done.
With LinearB data, they realized that this “tail loading” pattern made them significantly less efficient. This led to an observed ripple effect, which in addition to driving efficiency down, also impacted quality. At one point, they were creating more bug tickets than they were closing as a result of tail loading. Today this rate and pattern is monitored as a top line metric, ensuring teams sustainably balance capacity with demand.
To address these issues, the team worked to build more uniformity and consistency in the volume of work, characteristics of the work, and the time it takes to produce that work. They also created an organizational OKR that teams must dedicate a portion of their time on product quality. This helped teams get into a rhythm of smooth, uniform, continuous cycles.
Results
“Because of our shorter, faster cadences, we’re getting more stuff out the door on time.” says Matt. With LinearB data informing developer team coaching sessions, Super has seen a 200% improvement in Cycle Time and Planning Accuracy. “Interestingly, as teams get closer to the 75-100% goals for Planning and Capacity Accuracy, they know that they’re going to ship stuff on time. It’s not going to be delayed.”
Ultimately it’s this greater ability to execute that provides the dopamine hit developers crave, improving morale, and fostering a data driven culture.


