Too often, engineering leaders think they won’t be able to tie Developer Experience (DevEx) directly to the bottom line. It’s easy to justify new features, which help close new customers, improve retention, and meet market demand. However, drawing direct lines between bottom-line value and infrastructure investments is far more complex.
To help understand the impact of engineering infrastructure investments, LinearB publishes a yearly set of Engineering Benchmarks that share insights from more than 2,000 engineering teams around the world, covering more than 3.6 million PRs. This post will share five key DevEx indicators from these benchmarks that quantify the bottom-line impact of DevEx investments:
- Productive Companies Invest in Developer Experience
- High-Performing Organizations Are Predictable
- Healthy Teams Collaborate Efficiently
- Effective Managers Invest in Personal Improvement
- Happy Developers Are Empowered
Productive Companies Invest in Developer Experience
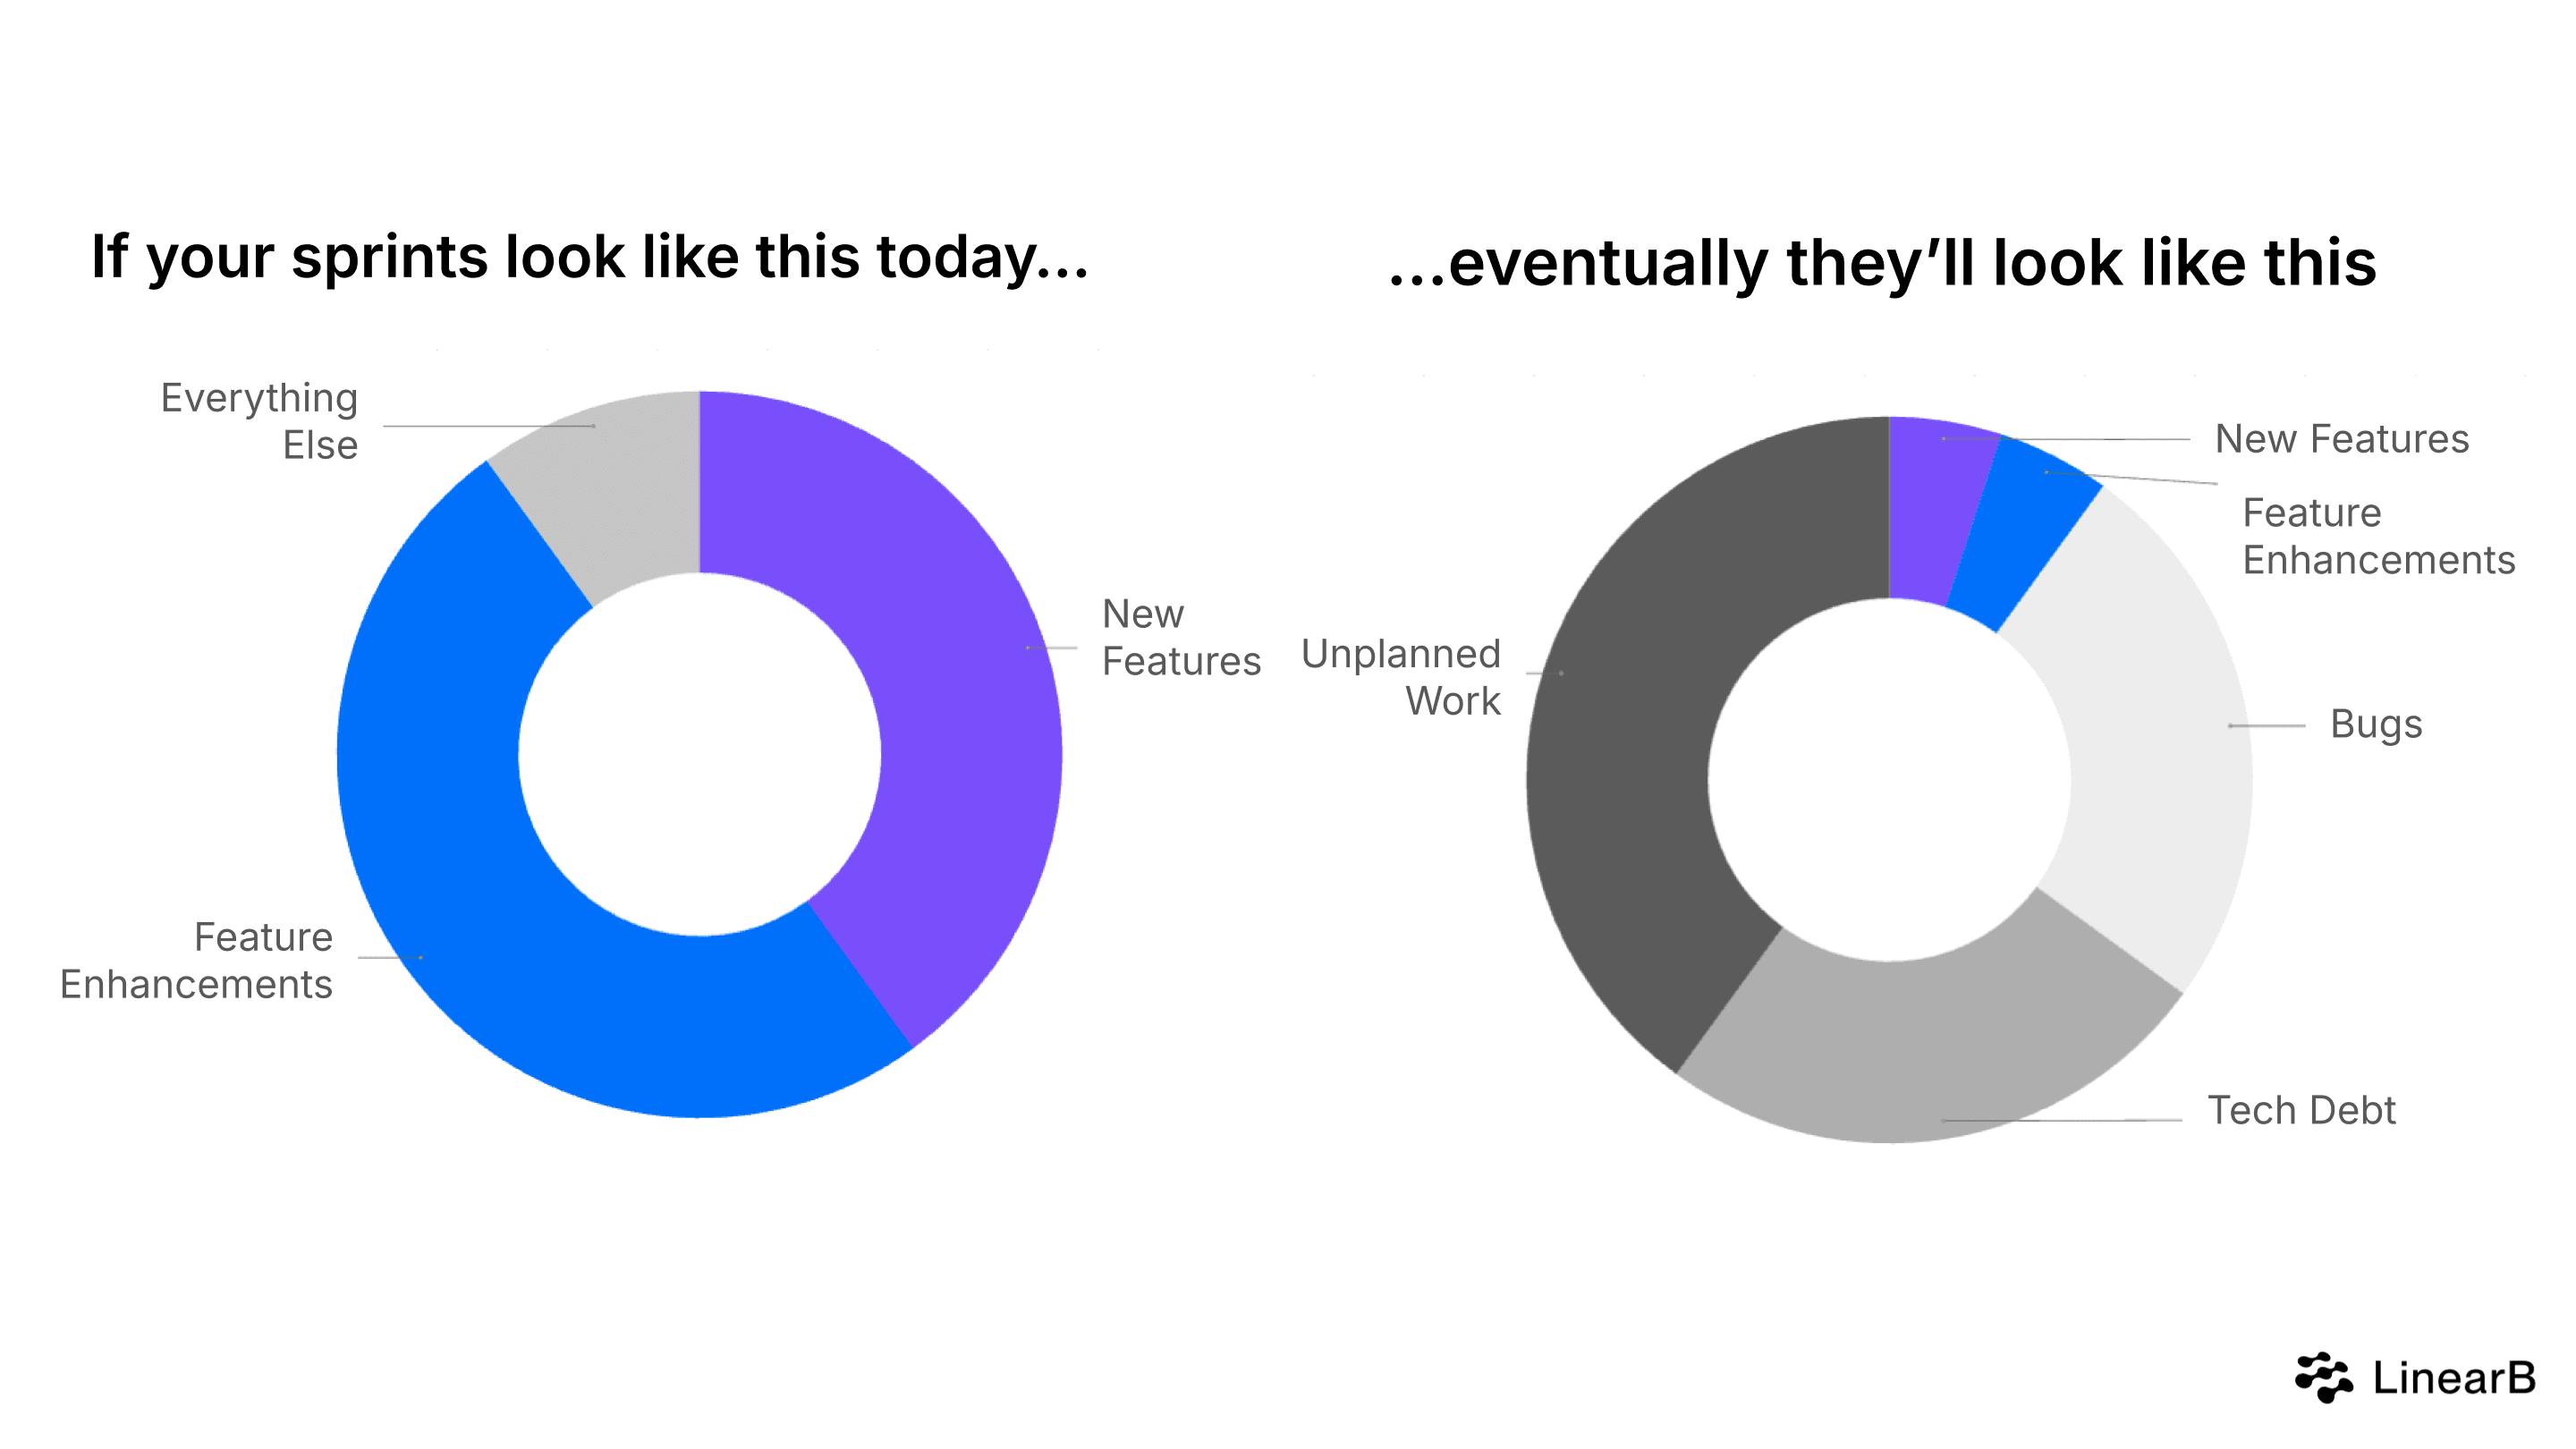
Let’s start by looking at high-level engineering investments. If you overinvest in new features and underinvest in the critical infrastructure needed to keep the lights on, you’ll find yourself responding more and more to unexpected situations. Excess time spent on bugs, tech debt, and unplanned work indicates poor DevEx, which directly impacts productivity.

For instance, our engineering benchmarks report found that the average organization invests 15% of its time into DevEx. This category includes improvements to developer productivity and overall work experience, such as enhancing tooling and platforms, adding test automation, restructuring code to reduce technical debt, and reducing backlog.
Knowing where your engineering organization invests time allows you to make data-backed decisions. New projects typically focus on new value and DevEx, while mature projects invest more in feature enhancements and KTLO (Keep The Lights On). Understanding your investment profile is crucial for tracking and improving DevEx regardless of your stage.
High-Performing Organizations Are Predictable
No manager wants to explain why their team only delivered 60% of what they promised, and no developer wants to be on a team constantly pressured to deliver over capacity. Marketing, sales, and customer success plan significant initiatives around product releases and engineering delays impact the entire go-to-market organization.
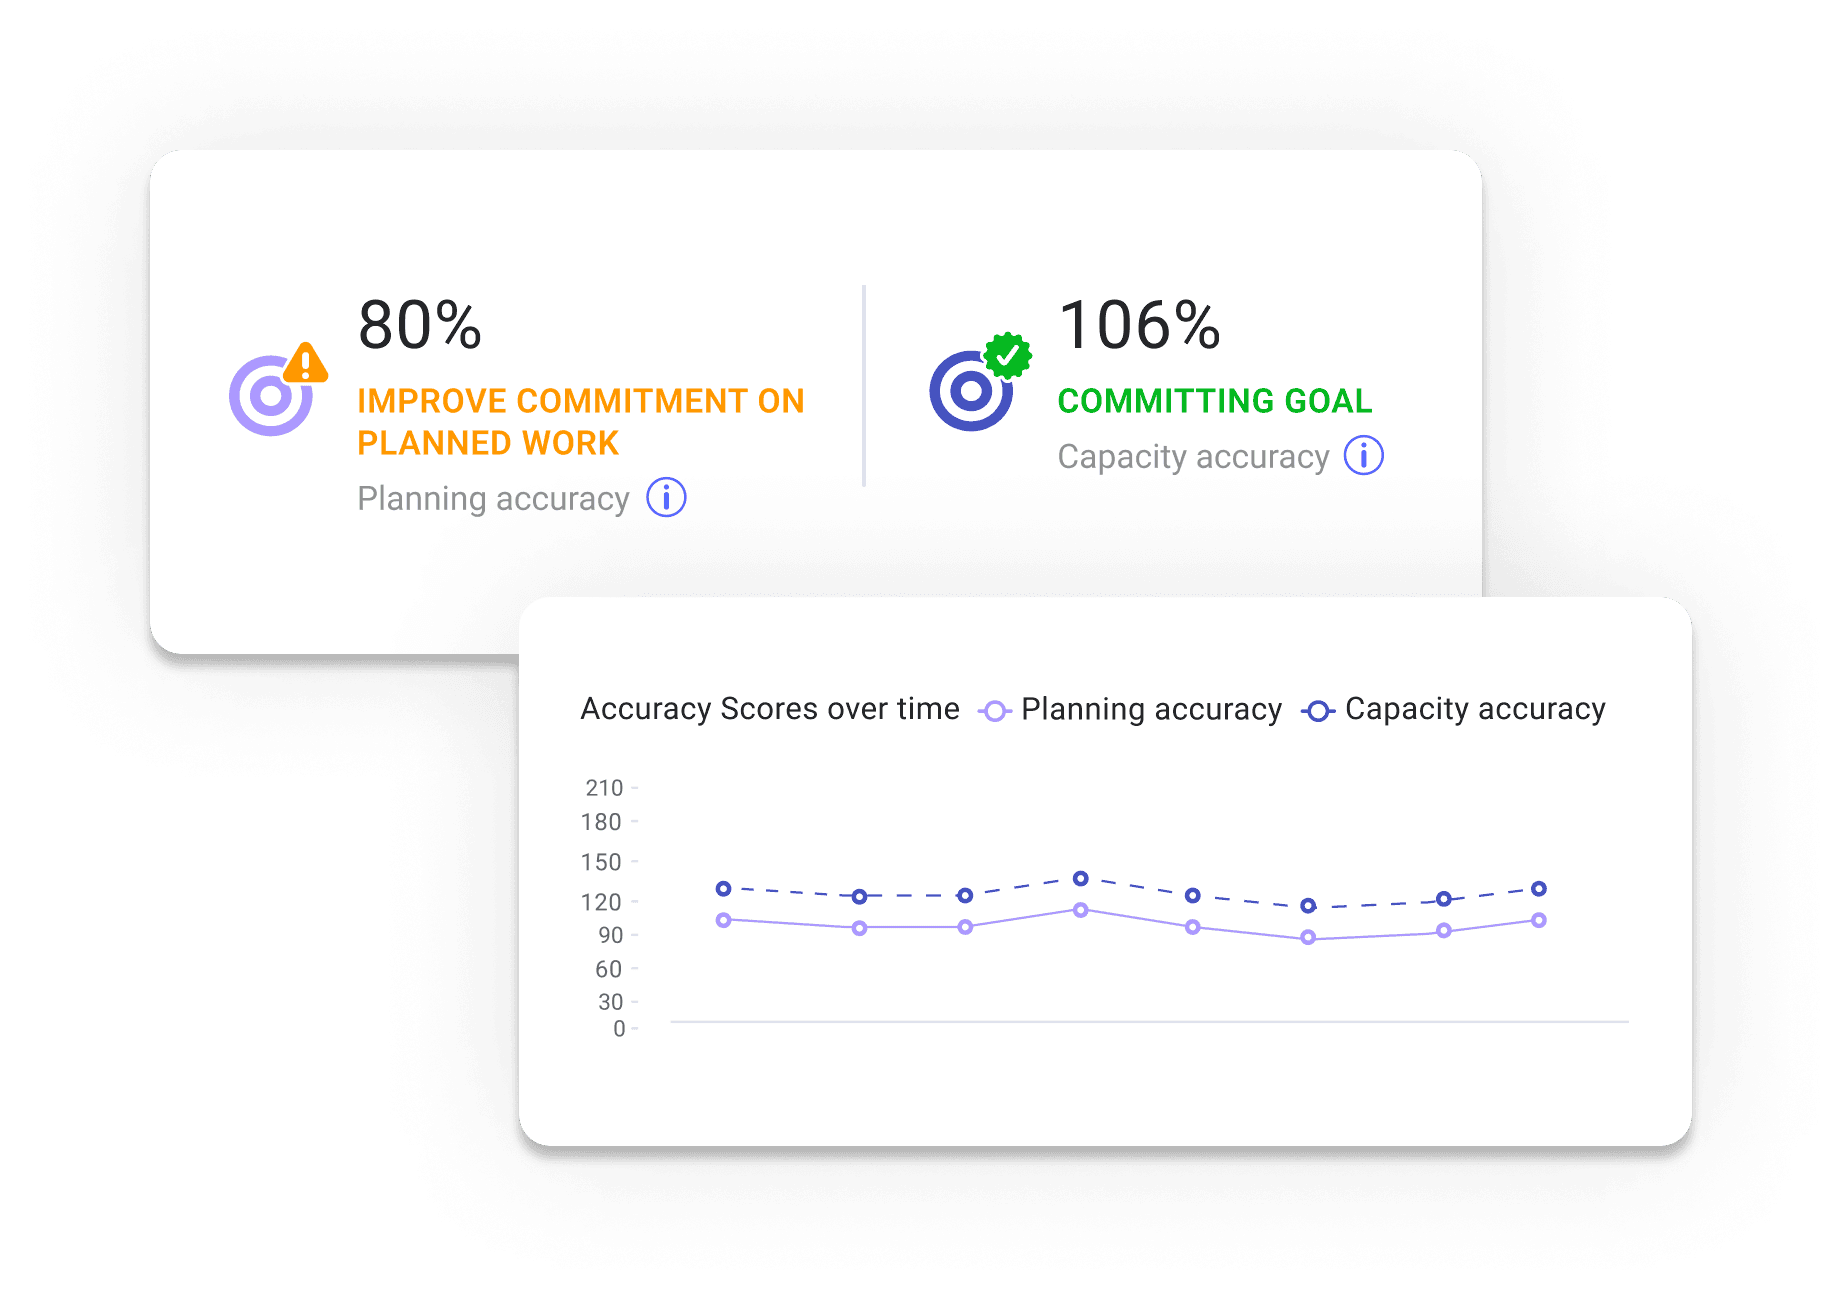
There are two primary metrics to measure your engineering organization’s predictability: planning accuracy and capacity accuracy. Planning accuracy measures the ratio of planned work vs. what was delivered, and it tells you how well your teams prioritize and execute against planned work. Capacity accuracy is the total completed work divided by planned work and tells you if your team is taking on an appropriate amount of work that they can reasonably accomplish. You should aim to have a planning accuracy above 85% and a capacity accuracy between 85%-115%.
High Capacity Accuracy (85% - 115%) | Low Capacity Accuracy (<80%) | |
High Planning Accuracy (75% - 96%) | Your project and or team is doing extremely well! Keep it up! If other projects are not trending so well, consider moving some resources around | Your team scoped the iteration well, but they aren’t necessarily responding to normal changes and fluctuations Work on adapting to the needs and priorities of the business |
| Low Planning Accuracy (<70%) | Execution is good, but you’re focusing on the wrong things Scope creep and unplanned work is taking up too much time Talk to PM about added work and prioritize your planned work | You’re taking on too much work – splitting focus and increasing delay risks You need to scope down and focus on your planned work Would be a good time to inquire about additional resources if possible |
Predictability comes down to tying individual activity to the overall roadmap. You should know at a glance what contributes to your ability to deliver software predictably, enabling you to take action in real-time. Unplanned work, stalled work, and over-extended developers negatively impact your ability to deliver software consistently, and you should deploy a software engineering intelligence tool that combines git and project management data into a unified visibility layer.

Healthy Teams Collaborate More Efficiently
Most of a typical developer's day occurs inside the software cycle: creating, reviewing, merging, and deploying code. Inefficiencies impact developers individually, but the bottlenecks that make them often exist at the team level.
Problems such as high coding time, high pickup time, high review time, and high deploy time can indicate issues like poor scoping, communication gaps, uncertainty in the merge process, and poor post-merge experience. These issues severely impact DevEx but are outside their control, leaving developers powerless to fix the problem. Team leads and managers need visibility into cycle time blockers to collaborate with other teams to resolve them.

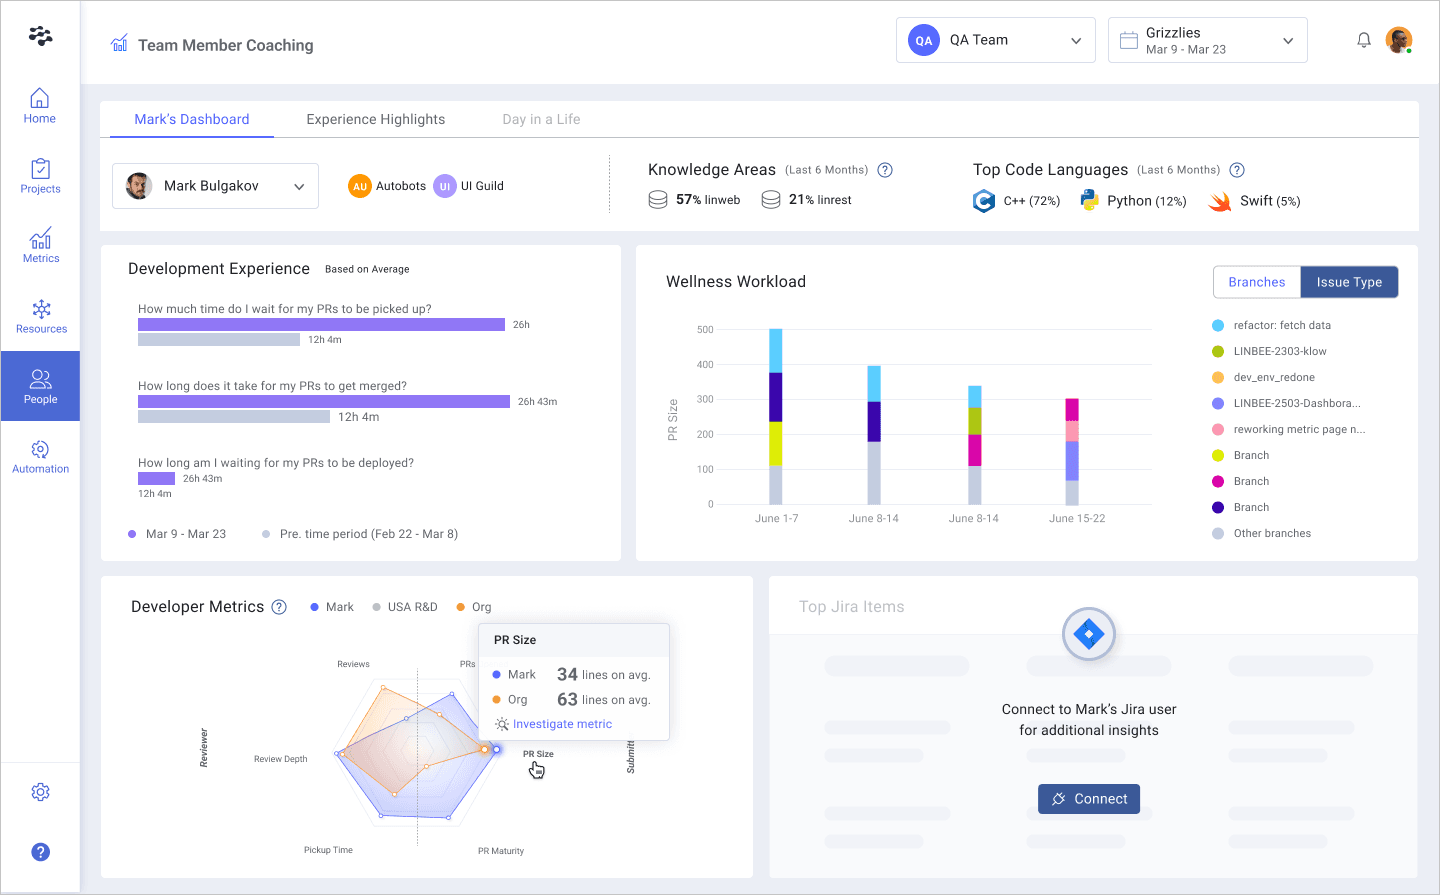
Managers should work with their teams to establish working agreements that improve efficiency. Here are some metrics you should set goals for:
- Pickup / Review Time - Research shows that code reviews are the most consistent bottleneck for software delivery pipelines. Hence, it’s crucial to recognize the value of developers who unblock code reviews and reallocate support to those who need it.
- PR Size - Small PRs are a leading indicator of software delivery efficiency. Large PRs could indicate a developer is working with complex parts of the codebase or needs tasks to be better scoped.
- Review Depth - Code reviews improve your codebase and facilitate knowledge sharing and mentorship.
- Work-In-Progress (WIP) - Monitor in-flight work at the individual level to identify areas to provide more support.
- Burnout - Flag developers who are potentially overworked and adjust priorities on the fly.
- Focus time - Ensure developers have enough time to achieve a flow state.
Effective Managers Invest in Personal Improvement
Effective managers understand the role each team member plays in achieving team goals. Individual developer metrics can be a touchy subject, but taking a shared-accountability approach to these metrics is essential because it ensures all participants have skin in the game. Goodhart’s Law states that when a measure becomes a target, it ceases to be a good measure. Use metrics to understand how individual efforts fit together into team outputs, not to determine who the high performers are.

Individual developer metrics can be a touchy subject, and for good reason. Most developers have at least one story of a company misusing metrics to target individuals for elimination from the company. However, when used appropriately, they can be a vehicle for personal improvement and empower developers to take career progression into their own hands. In particular, code reviews are one place where individual metrics can be a strong driving force.
Code reviews build bi-directional relationships between developers and its important that developers both give and receive prompt and detailed feedback. Pickup and review time are two metrics that measure the pace of collaboration between team members. A high pickup time may indicate that a developer’s work isn’t getting the visibility it needs, while a high review time might indicate uncertainty in the merge process or problems with code quality.
Further as developers progress from junior to senior positions, you would probably expect them to review more PRs relative to the amount of code they produce themselves. Giving developers direct visibility into their impact on their team through code reviews is a great way to put them in the driver seat for their next promotion.
Finally, review depth: the amount of effort spent reviewing a PR is also important to ensure that code reviews don’t become a rubber stamp process. Low review depth typically indicates one of two things: unnecessary toil, or code quality risks. In either situation, visibility is key to understanding which projects and teams need to make improvements.
Happy Developers Are Empowered
Healthy engineering cultures empower developers to improve their environment proactively. DevEx initiatives are more likely to succeed with bottom-up buy-in, and individual empowerment is how you get this buy-in. Optimizing the merge process, nudging developers when their teammates need help, or implementing self-service catalogs for internal dev tooling gives developers the tools to make their lives easier.
Developers want autonomy but not necessarily complete freedom because they often prefer clear guidelines about optimal pathways. The key to a successful DevEx initiative is to make the path of least resistance the most likely to result in success.
If you’re struggling to understand the biggest blockers to developer empowerment, one option is to run a one-time survey to gauge the perception of your developer teams and compare that to objective, quantifiable metrics. You don’t need a heavy upfront investment to take advantage of surveys.
Data-Driven Developer Experience Investments
Investing in DevEx is essential for creating productive, predictable, and efficient engineering teams. By focusing on quantifiable DevEx indicators, you can measure, evaluate, and justify these investments, ensuring your team’s success and satisfaction. Empower your developers, invest in their experience, and see the positive impact on your bottom line.
Sign up for a free LinearB account to start your journey toward becoming a data-driven engineering organization.


