Our development team in Tel Aviv has been busy building for you (from home).

This week we’re announcing 5 new features to help you more easily see trends and connect to your full tech sack.
- Cycle time trend graph
- Work breakdown trend graph
- Iteration retrospect view
- Release from branch option
- Jira Server (on-prem) connector
For each of the five features below you’ll find a screenshot plus an explanation of how it works and how our own dev team uses it internally.
1) Cycle time trend graph
How it works:
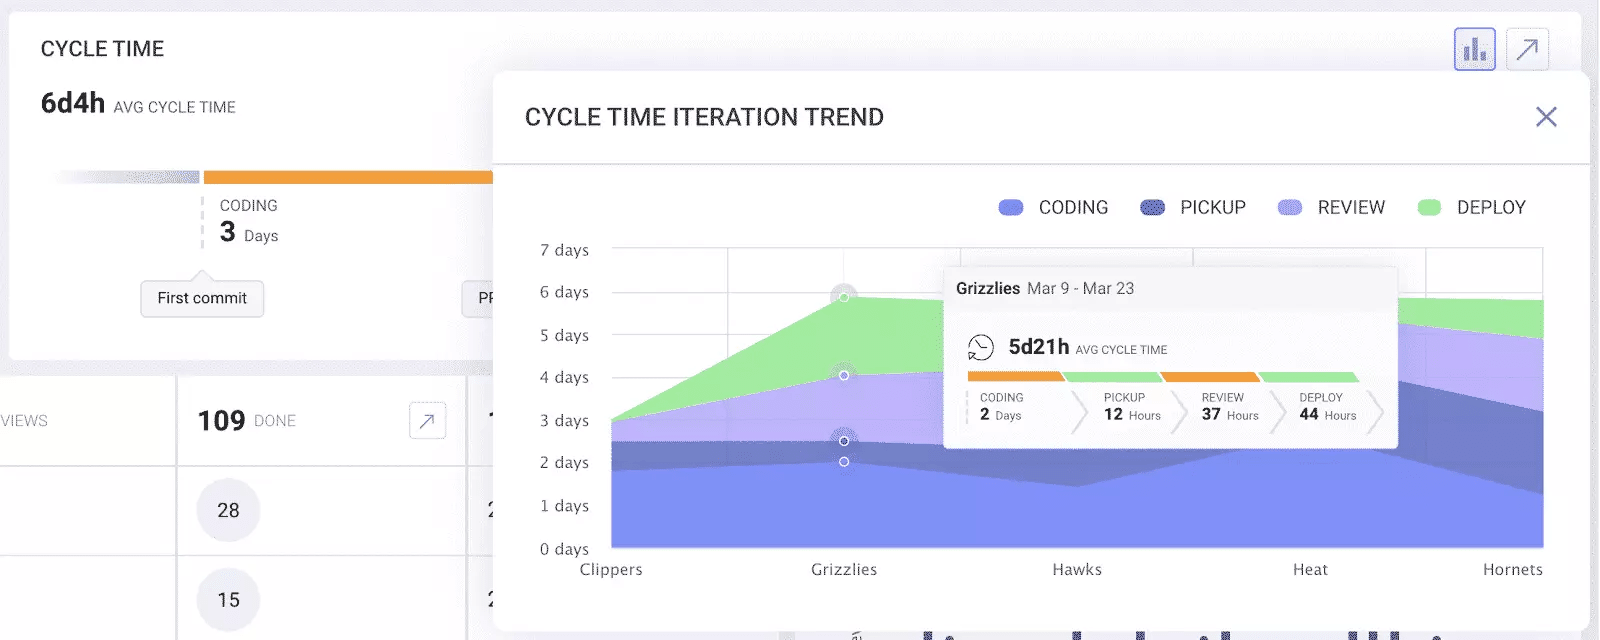
The cycle time trend displays the cycle time average values for the five most recent iterations as a stacked graph. Each part represents the average time for each of the cycle time phases – coding time, pickup time, review time, deploy time. You can hover over all of the elements in the trend graph to see benchmarks for each phase and the total summary for each iteration.
How we use it internally:
Our CEO Ori loves this view because he can easily see how our efficiency is trending. Plus we use Cycle Time to determine where we have bottlenecks in our delivery process and the new trend graph shows if the investments we made in problem areas are paying off.
2) Work breakdown trend graph
How it works:
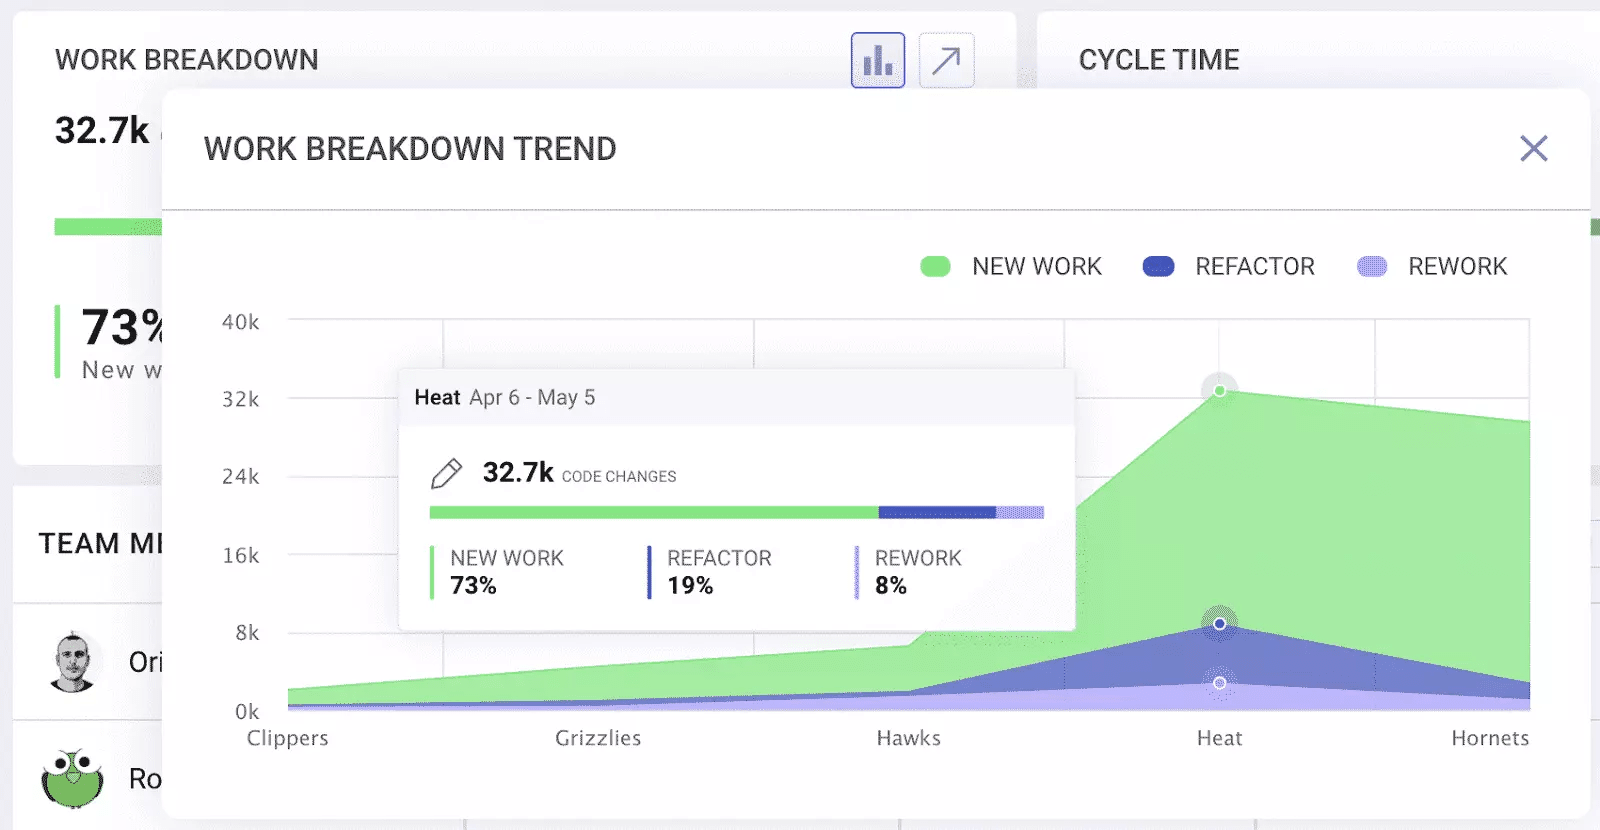
The work breakdown trend displays the work breakdown average for the five most recent iterations as a stacked graph. Each part represents the total code changes made in each category (new work, refactor, rework). You can hover over each value in the trend graph to see the work breakdown for the relevant iteration as well as the total code changes in the relevant iteration.
How we use it internally:
Our dev team lead Ariel likes to keep our ratio of rework at 10% or below because anything higher than that has a strong correlation to quality issues. He uses this view to monitor our progress against this indicator over time. Ariel also likes the work breakdown trend graph because it helps him and Ori make decisions about how we’re investing in innovation (new work) versus technical debt (refactor).
3) Iteration retrospect view
How it works:
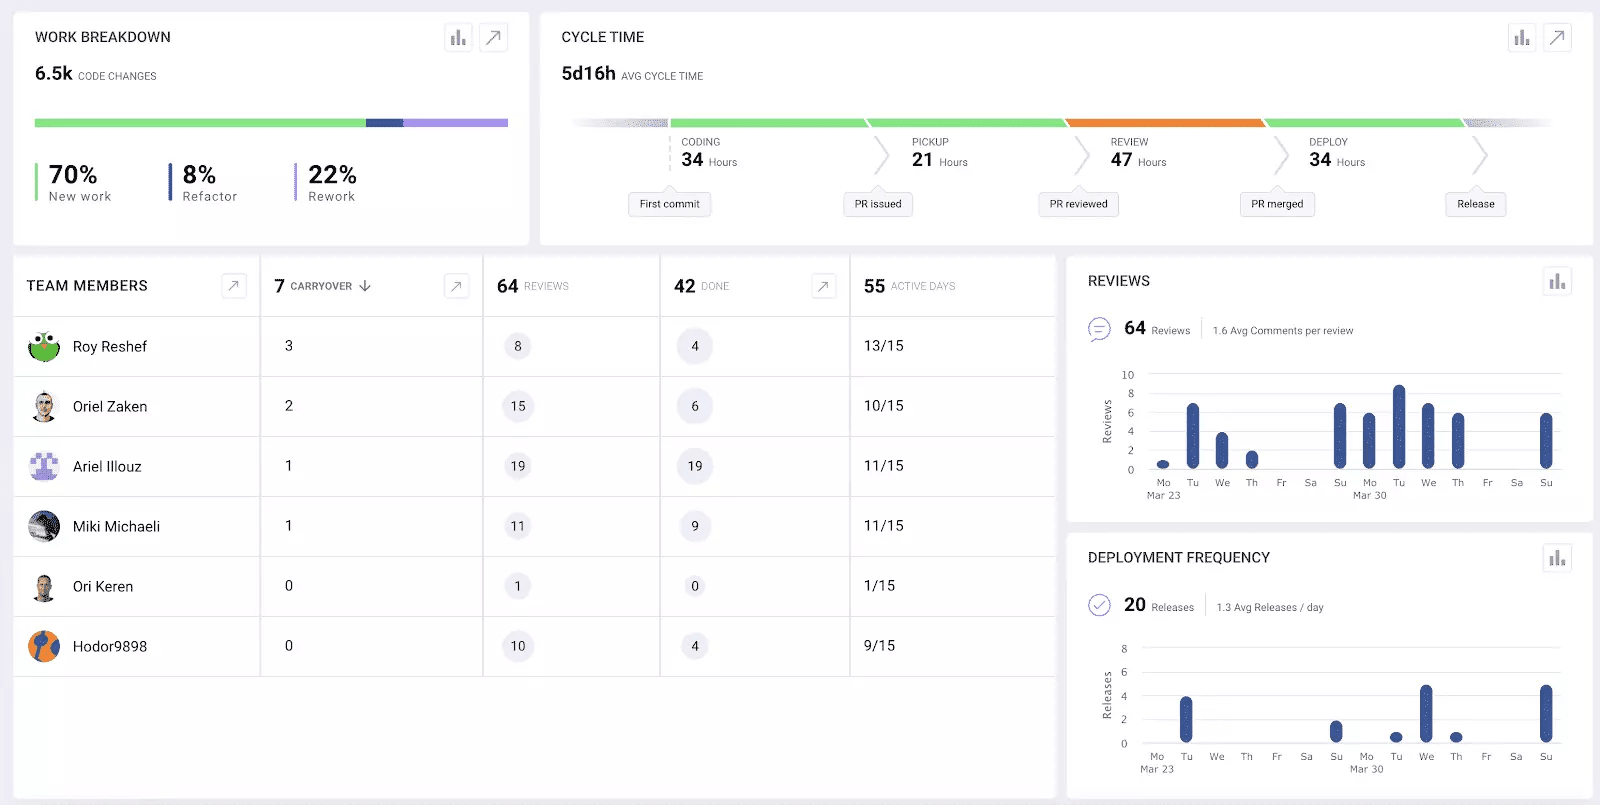
The retrospect view allows you to see key metrics across your entire organization or specific teams for iterations that have concluded.
The iteration retrospect view has four key elements:
Work breakdown
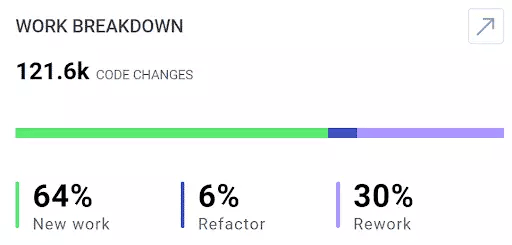
How it works:
The iteration retrospect work breakdown view shows the number of code changes in the iteration and the breakdown of new code, refactor, and rework as well as a trend graph to compare it with the 4 previous iterations.
Cycle time
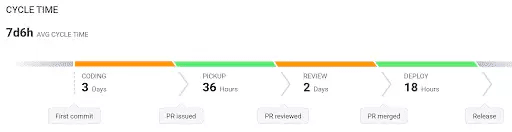
How it works:
The iteration retrospect view shows the average cycle time for the iteration as well as a trend graph that compares the cycle time of that iteration and the cycle time of the 4 previous iterations.
Team members
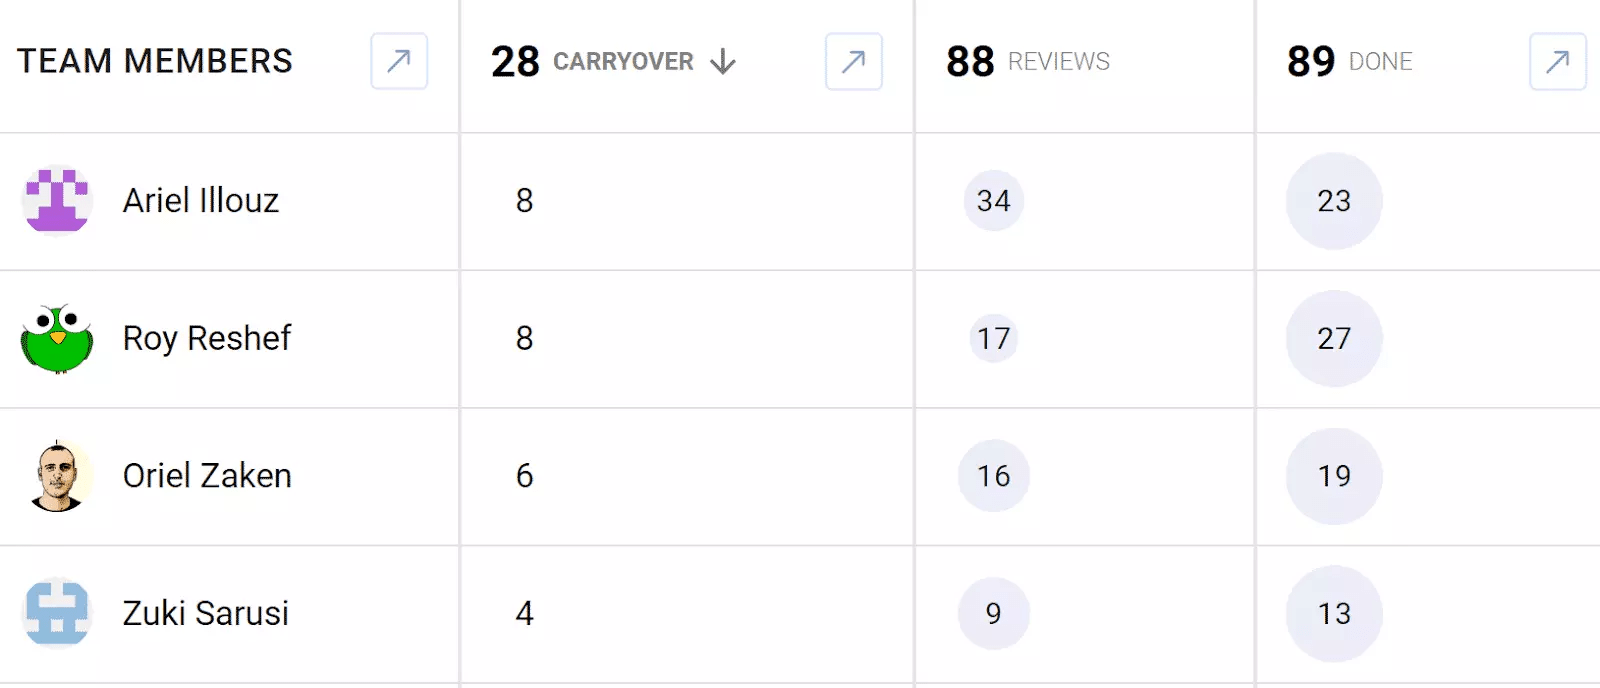
How it works:
The work in progress “WIP” column displayed in the current iteration view is replaced with the “carryover” column which displays for each team member the number of work units that were not completed during that iteration.
Reviews
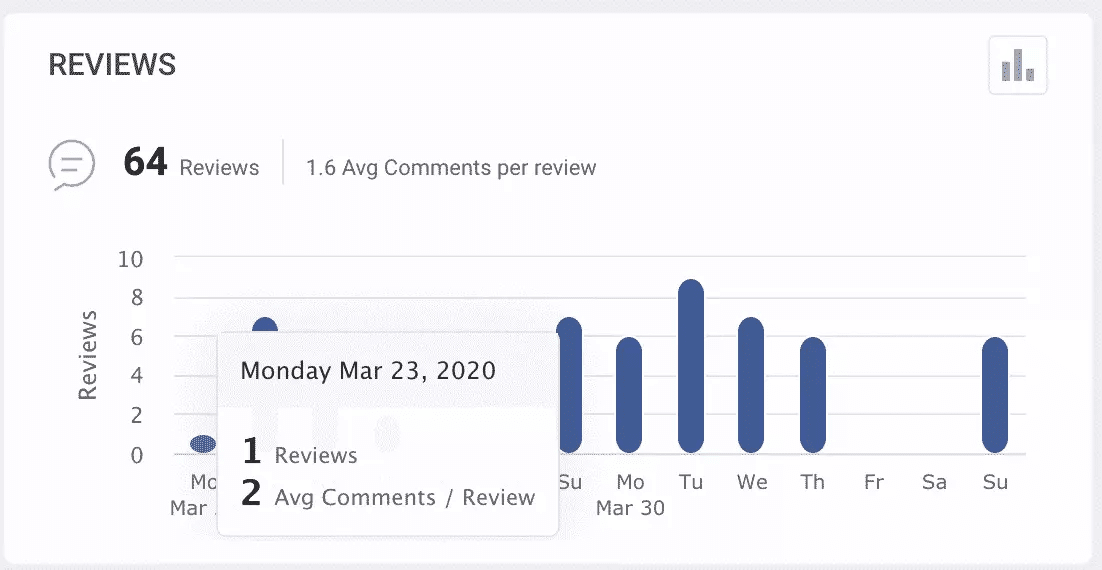
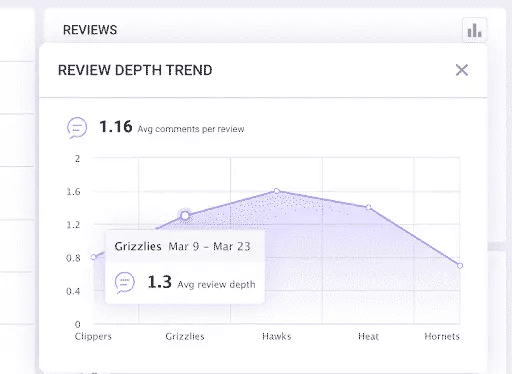
How it works:
The reviews graph shows the number of reviews and review depth for each day of the iteration. The summary shows the total reviews done in the iteration as well as the average review depth. The review depth trend graph displays review and review depth trends compared to the previous 4 iterations.
Deployment Frequency
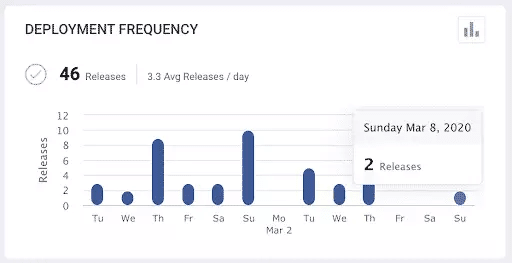
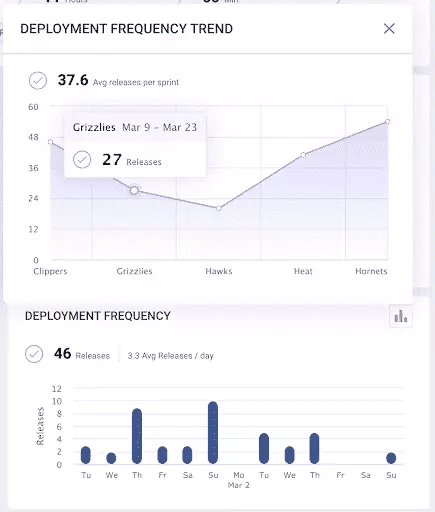
How it works:
The iteration retrospect deployment frequency graph shows the number of releases for each day of the iteration. The summary shows the total releases done in the iteration as well as the average releases per day. The deployment frequency trend graph displays the trend of the releases compared to the 4 previous iterations.
How we use all of these internally:
Everyone involved in product development reviews this dashboard in our retro meetings and our executive team looks at this data monthly in our CEO staff meeting. At LinearB even our business people care about our key engineering metrics and we use iteration retro as an opportunity to educate sales, marketing, and customer success on what’s happening with engineering and product.
Cycle time is our favorite indicator of development speed and efficiency so we look at how we did after each iteration to see where we can improve.
Dev team members are how we deliver all of this value to you. So keeping them happy matters to us. We don’t want them to be overloaded. And they don’t like to be on the sidelines. So balancing their WIP is really important. Plus our product lead Boaz is constantly trying to get to 100% completion on our iterations so studying carryover trends helps him increase our predictability.
Reviews and review depth are indicators of both quality and team culture for us. Do our devs have enough time to help their teammates? Are we doing thorough reviews to avoid problems down the road? We use this data to answer these questions at the end of every iteration.
Deployment frequency really matters to us. We want to stay lean and ensure our devs are breaking their work into small chunks and merging and releasing constantly. We find that deployment frequency is also a leading indicator of quality for us.
4) Release from branch option
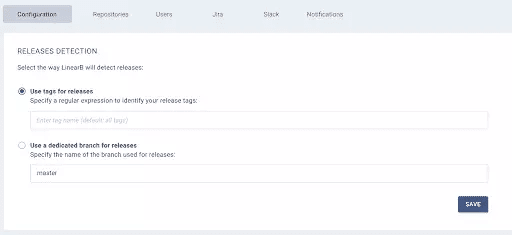
How it works:
This new option gives you flexibility for how to signal your releases to LinearB. Until now we measured releases based on tags either in general or tags with a specific name pattern. Now we are supporting an additional methodology where we can consider a dedicated branch or branches as the “release” branch. If you use this option, every PR merged into this branch will be counted as released. This option is available in the settings -> configuration.
How we use it internally:
This one is all about you guys. LinearB should fit to the way you already work. You asked to be able to release from a dedicated branch, so we built it for you.
5) Jira Server (on-prem) connect
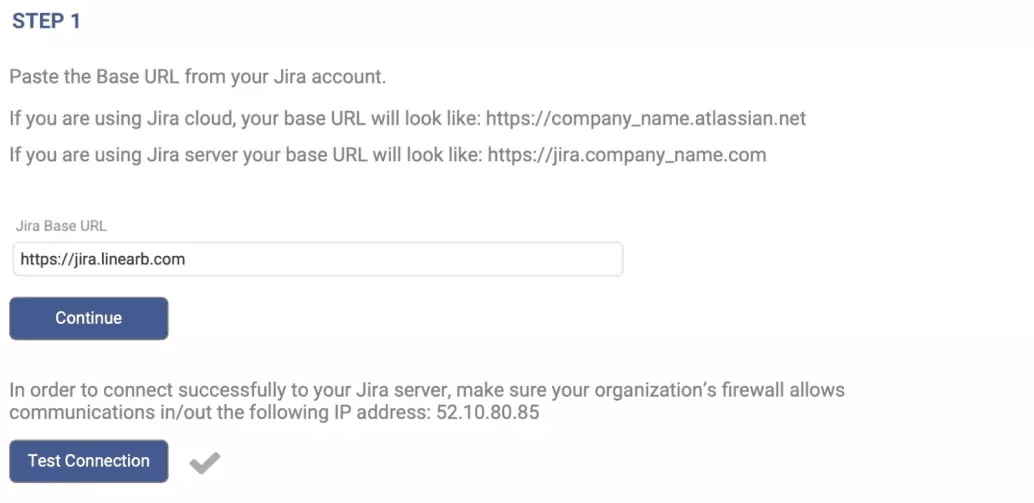
How it works:
You can now connect your Jira Server (on-prem) to LinearB. The Jira connection is done through Settings -> Jira and includes a connection wizard that walks you through three steps: 1) validate your URL 2) create an OAuth application 3) authorize LinearB.
How we use it internally:
Correlating Jira data with Git data is critical to our mission of connecting engineering and product and empowering those organizations to give context to the business. You can’t get the full picture of what’s happening with software delivery by looking at just Git or just Jira in the same way engineering team and product teams can’t build great product without each other. Now all of our customers, including those running Jira Server (on-prem), can bring Jira and Git together to see a higher level of context – powered by LinearB.
I want your feedback and I would love to connect with you directly – by Zoom or over Slack. If you have any ideas, comments or questions, please get in touch at boaz@linearb.io.
Thanks for being part of the LinearB community.