# Customize Your Engineering Metrics Dashboards in LinearB | LinearB Blog

> Introducing Custom Engineering Metrics Dashboards 🚀 I’ve been a Software Development Manager without the right metrics.  Believe me, it’s a challenge. But you don’t have to be like I was anymore. Now you can not only have metrics to give you insight into what your development team is doing, but you can view those metrics [&hellip;]

_This is a markdown rendering of a live HTML page on linearb.io, generated for AI/LLM consumption — it is not a markdown-only site. To get the full HTML page instead, request this URL with an explicit `Accept: text/html` header (no wildcard, no markdown preference)._

[Blog](https://linearb.io/blog)

/

Customize Your Engineering Metrics Dashboards in LinearB

# Customize Your Engineering Metrics Dashboards in LinearB

![Photo of Nick Hodges](https://assets.linearb.io/image/upload/c_limit,w_2560/f_auto/q_auto/v1/logo-mark-lg?_a=BAVMn6ID0)

By [Nick Hodges](https://linearb.io/blog/custom-metrics-dashboards#nick-hodges)

|

May 7, 2021

![Standup_93e1b3d552](https://assets.linearb.io/image/upload/c_limit,w_2560/f_auto/q_auto/v1/Standup_93e1b3d552?_a=BAVMn6ID0)

## Introducing Custom Engineering Metrics Dashboards 🚀

I’ve [been](https://linearb.io/blog/?utm%5Fsource=Referrals&utm%5Fmedium=devinterrupted.com&utm%5Fcampaign=devinterrupted%20referrals) a Software Development Manager without the right metrics. Believe me, it’s a challenge.

But you don’t have to be like I was anymore. Now you can not only have metrics to give you insight into what your development team is doing, but you can view those metrics in exactly the way that you want to see them. 

LinearB’s new custom dashboard feature allows you to build a metrics view that makes the most sense for you and your team. 

* You might need a specific set of metrics for a specific meeting or as the first thing you look at every morning.
* Maybe you have some specific concerns about your team and want to track some metrics that will help you deal with those concerns.
* Maybe you want to keep track of everything happening with the pull requests on your team.

Whatever it is, [LinearB’s Custom Engineering Dashboards](https://linearb.io/engineering-metrics/) can give you the view you want when you need it.

Our custom dashboards are even customizable! We went above and beyond with this feature by allowing your custom dashboard to be set as a private or public, any number of colors, line or bar graph. You get to choose.

You can even show it off to your boss or embed a view in PowerPoint by simply exporting the dashboard as a PNG file.

## Create your custom dashboard in less than 60 seconds 

Here’s a video of me creating one in about a minute. Seriously — it’s that easy:

[This Release Note has step-by-step instructions](https://linearb.helpdocs.io/article/s6eszgwmm2-release-157) if you prefer to read how to do it.

## Useful Dashboard Examples

### DORA Metrics Custom Dashboard

[The DORA Metrics](https://www.blueoptima.com/blog/how-to-measure-devops-success-why-dora-metrics-are-important#:~:text=What%20Are%20DORA%20Metrics%3F%20At%20the%20most%20fundamental,divided%20across%20the%20two%20core%20areas%20of%20DevOps.) are all the rage these days. Many software development leaders are using them as a baseline for keeping track of their development teams. 

Here is a dashboard that displays three key DORA Metrics:
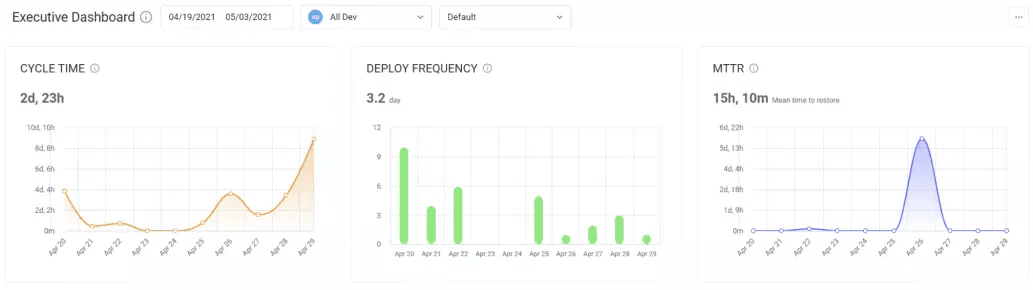
With this dashboard, you can see that Cycle Time has been climbing recently. You might wonder why deployment frequency is dipping, and you can see where the team likely struggled with fixing the application. 

With this simple view, you can see at a glance how your team is performing and what mid-course corrections you might need to make.

### Tracking Pull Requests with a Custom Dashboard

[Pull Requests](https://linearb.io/blog/what-is-a-pull-request/) have become more common in recent years. They have tons of advantages, and add huge value to the process of committing and merging code into your codebase. 

But there can be some landmines with Pull Requests. They can be too big. Sometimes they can languish waiting to get reviewed. Or they might get only a cursory review. I would have loved to be able to track all these things at a statistical, precise level rather than guessing about things as they happened. I would have loved to have this dashboard, for instance:
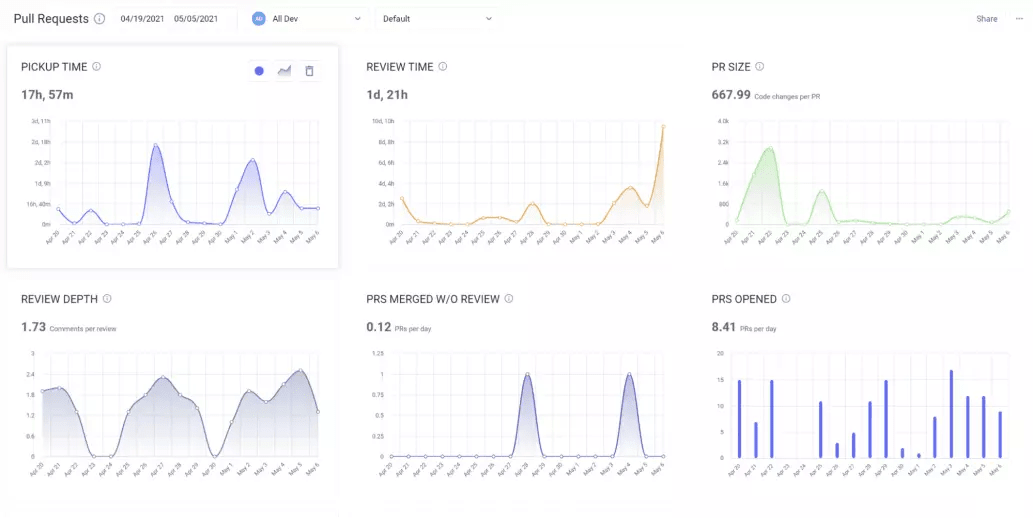
Now, that’s a lot of data, but if after looking that dashboard over, you don’t have a complete view of what is happening with Pull Requests in your code base, well, I don’t know what to tell you. 😃 Maybe you don’t want all those metrics because it is too much, but that is the beauty of custom dashboards. You can tailor it to whatever you want.

### A Custom Dashboard for Your Daily Standup

When I was a Development Manager, I struggled to make my daily standups useful, interesting, and purposeful. The meetings would often be each developer kind of droning on about what he was doing, etc. The meetings were boring, and frankly, I began to wonder if [they shouldn’t be completely made over](https://linearb.io/blog/daily-stand-up-2-0-its-time-to-ditch-the-stand-up-from-1993/). 

What I really could have used were some key metrics [to make my development team stand up more useful and effective](https://linearb.io/blog/make-daily-better/). 

Here’s a dashboard that would have been very useful to review every day in my team standup:
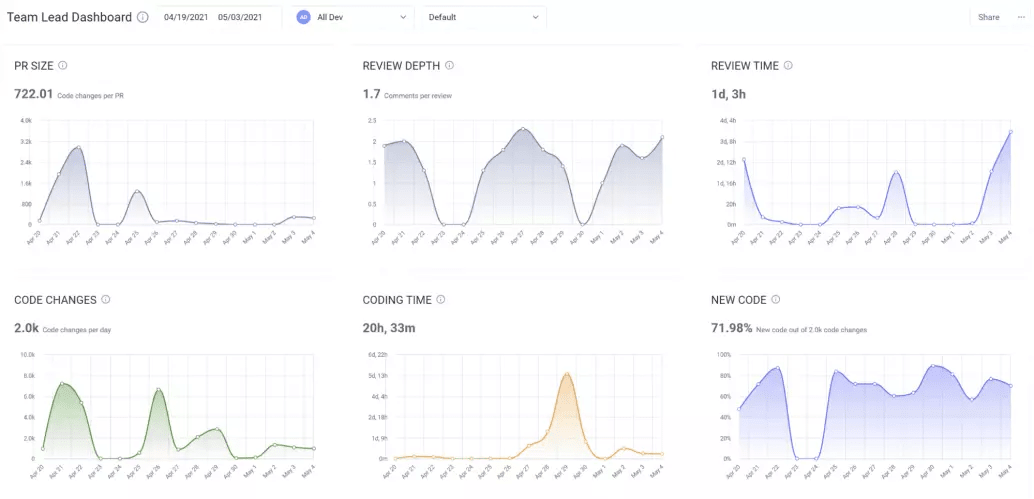
This would be perfect to review before you go into the standup, or even go over it with the team in the standup.

Along the top, I can see three very important metrics about the team’s Pull Requests: the size of pull requests (you don’t want them too big), the amount of review pull requests get (you don’t want it too small), and the amount of time it takes to do a review (you want it just right).

On the bottom, I can see how many code changes my team is making, how much time each project is spent in coding, and how much of the code they are writing is new code. 

Now you may want to track different metrics, or have those metrics that you do track alter over time. That’s fine — you can easily update your dashboards at any time.

## Show Us Your Custom Engineering Metrics Dashboard**🎉**

So go give it a try. As seen in the video above, creating your own new custom dashboards is startlingly easy. 

We’d love to see your own custom dashboards

If you are an existing customer, you can already use this feature.

If you aren’t yet a customer, you can [sign up for free with just a few mouse clicks](https://app.blog.linearb.io/register?%5Fgl=1%2Aylfwpm%2A%5Fga%2AMTMwMDgzMTY1MS4xNjE3NjQzMDUx%2A%5Fga%5F24C8YJGTX9%2AMTYyMDE1NjUzMy40NS4xLjE2MjAxNTY3MDEuMA..).

Once you are rolling, here’s what you can do:

1. If you aren’t a member of our Discord Community, [it’s totally anonymous if you want and very easy to join](https://discord.gg/QMZv8QVfCK).
2. Create your own dashboard.
3. Export it using the Export to PNG Feature. (See the “Share” button in the upper right)
4. Go to our **_#show-off_** channel and post your dashboard along with a description of why you chose the metrics that you did.

Post your dashboard and its description, and we’ll send you a free Dev Interrupted t-shirt!

## Improve developer productivity with LinearB

Find us on

[](https://www.linkedin.com/company/linearb)
[](https://devinterrupted.substack.com/)

## Your next read

[![Cover image for AI ROI comes from measuring engineering outcomes on day one](https://assets.linearb.io/image/upload/c_limit,w_2560/f_auto/q_auto/v1/Blog_AI_ROI_comes_from_measuring_engineering_software_security_2400x1256_2c5eae0862?_a=BAVMn6ID0)](https://linearb.io/blog/kraken-nik-sudan-measure-ai-roi-engineering-outcomes)

Product

[AI ROI comes from measuring engineering outcomes on day one](https://linearb.io/blog/kraken-nik-sudan-measure-ai-roi-engineering-outcomes)

Kraken Engineering Operations Lead Nik Sudan details how to establish day-one data infrastructure to accurately measure AI ROI. Discover why raw token adoption...

[![Cover image for Best Appfire Flow alternatives in 2026](https://assets.linearb.io/image/upload/c_limit,w_2560/f_auto/q_auto/v1/Blog_Moving_beyond_flow_88c071e703?_a=BAVMn6ID0)](https://linearb.io/blog/flow-alternatives-2026)

Product

[Best Appfire Flow alternatives in 2026](https://linearb.io/blog/flow-alternatives-2026)

Flow provides DORA metrics, workflow diagnostics, and useful dashboards for engineering leadership. But it has real limitations, and the market has moved...

[![Cover image for 8 million pull requests reveal where engineering productivity breaks down](https://assets.linearb.io/image/upload/c_limit,w_2560/f_auto/q_auto/v1/Blog_8_million_pull_requests_2400x1256_03724bfbb2?_a=BAVMn6ID0)](https://linearb.io/blog/8-million-prs-engineering-productivity)

Product

[8 million pull requests reveal where engineering productivity breaks down](https://linearb.io/blog/8-million-prs-engineering-productivity)

8.1M pull requests reveal the gap between AI adoption and engineering impact, and why code review is the bottleneck blocking real productivity gains.

## Structured data

_Machine-readable metadata (JSON-LD) embedded in the page for search/AI context — not content rendered on the page itself._

```json
{
  "@context": "https://schema.org",
  "@type": "Organization",
  "name": "LinearB",
  "url": "https://linearb.io",
  "logo": "https://assets.linearb.io/image/upload/v1715628027/logo-mark-lg.svg",
  "description": "LinearB is the engineering productivity platform that helps engineering leaders prove AI is improving throughput without sacrificing delivery confidence, flow efficiency, or developer experience.",
  "sameAs": [
    "https://www.linkedin.com/company/linearb"
  ],
  "award": [
    {
      "@type": "Award",
      "name": "LinearB is a Leader in the 2026 Gartner® Magic Quadrant™ for Developer Productivity Insight Platforms",
      "dateAwarded": "2026",
      "awardedBy": {
        "@type": "Organization",
        "name": "Gartner®"
      }
    },
    {
      "@type": "Award",
      "name": "Great Place to Work Certification",
      "dateAwarded": "2025-2027",
      "awardedBy": {
        "@type": "Organization",
        "name": "Great Place to Work"
      }
    },
    {
      "@type": "Award",
      "name": "America's Best Startup Employers 2025",
      "dateAwarded": "2025",
      "awardedBy": {
        "@type": "Organization",
        "name": "Forbes Magazine"
      }
    }
  ],
  "hasCertification": [
    {
      "@type": "Certification",
      "name": "SOC 1 Type 2"
    },
    {
      "@type": "Certification",
      "name": "SOC 2 Type 2"
    },
    {
      "@type": "Certification",
      "name": "GDPR Compliance certification"
    },
    {
      "@type": "Certification",
      "name": "ISO 27001"
    }
  ]
}
```

```json
{
  "@context": "https://schema.org",
  "@type": "Article",
  "headline": "Customize Your Engineering Metrics Dashboards in LinearB",
  "url": "https://linearb.io/blog/custom-metrics-dashboards",
  "author": {
    "@type": "Person",
    "name": "Nick Hodges"
  },
  "datePublished": "2021-05-07T14:32:54.000Z",
  "dateModified": "2021-05-07T14:32:54.000Z",
  "image": "https://assets.linearb.io/image/upload/v1720000000/Standup_93e1b3d552.png",
  "publisher": {
    "@type": "Organization",
    "name": "LinearB",
    "logo": "https://assets.linearb.io/image/upload/v1777485755/linearb-logo-2026.png"
  },
  "description": "Introducing Custom Engineering Metrics Dashboards 🚀 I’ve been a Software Development Manager without the right metrics.  Believe me, it’s a challenge. But you don’t have to be like I was anymore. Now you can not only have metrics to give you insight into what your development team is doing, but you can view those metrics […]\n"
}
```

## More on linearb.io

### Top navigation

- [Book a Demo](https://linearb.io/book-a-demo)
- [AI Code Reviews — Catch security risks, bugs, and spec mismatches](https://linearb.io/platform/ai-code-reviews)
- [AI & Productivity Insights — See how AI tools affect cycle time and delivery speed](https://linearb.io/platform/ai-developer-productivity-insights)
- [Measure AI Impact — Track AI adoption and tie it to delivery outcomes](https://linearb.io/use-case/measure-ai-impact)
- [MCP Server — Chat with your data to spot patterns and boost output](https://linearb.io/platform/mcp-server)
- [Resource Allocation — Cost initiatives and shape your investment strategy](https://linearb.io/platform/resource-allocation)
- [Cost Capitalization — Capitalize engineering costs with audit-ready reports](https://linearb.io/platform/cost-capitalization)
- [Dev Team Management — Set targets and tie throughput to business outcomes](https://linearb.io/platform/goals-and-reporting)
- [DevOps Workflow Automation — Policy-based PR routing, approvals, and tests](https://linearb.io/platform/ai-workflow-governance)
- [AI Powered Support — Unify AI and human code delivery in one clear view](https://linearb.io/use-case/ai-powered-support)
- [Optimization — Surface friction with feedback and MCP insights](https://linearb.io/platform/developer-experience)
- [Reporting — Spot what's working and what needs attention](https://linearb.io/use-case/measuring-developer-experience)
- [Surveys — Turn developer feedback into actionable signals](https://linearb.io/platform/developer-surveys)
- [Platform overview](https://linearb.io/platform/overview)
- [Register now](https://linearb.io/event/engineering-productivity-gap)
- [Customers](https://linearb.io/customers)
- [Pricing](https://linearb.io/pricing)
- [Why choose LinearB — Explore your data. Measure performance. Act to improve it.](https://linearb.io/why-linearb)
- [APEX framework — The operating model for AI-era engineering teams](https://linearb.io/resources/apex-framework)
- [Anti-FAQ — The questions other vendors won't answer](https://linearb.io/why-linearb/anti-faq)
- [Security — Enterprise-grade compliance and zero code access](https://linearb.io/security)
- [Build vs. buy — The hidden cost of building it yourself](https://linearb.io/resources/build-vs-buy)
- [Dev Interrupted Podcast — Conversations with engineering leaders](https://linearb.io/dev-interrupted/podcasts)
- [Reports & Guides — Deep dives on productivity and delivery](https://linearb.io/resources)
- [Webinars — Expert sessions on productivity and AI](https://linearb.io/resources?category=workshops)
- [Metrics Benchmarks — See how your engineering org stacks up](https://linearb.io/resources/software-engineering-benchmarks-report)
- [Blog — Product updates and practical insights](https://linearb.io/blog)
- [Help Center — Documentation, setup, and support](https://linearb.helpdocs.io)
- [API Docs](https://docs.linearb.io/api-overview)
- [Status](https://www.linearbstatus.com/)
- [Integrations](https://linearb.io/integrations)
- [LinearB is a Leader in the 2026 Gartner® Magic Quadrant™ for Developer Productivity Insight Platforms](https://linearb.io/resources/gartner-magic-quadrant-dpi-platforms-2026)
- [Sign in](https://app.linearb.io/login)
- [Enterprise](https://linearb.io/solutions/enterprise)
- [Contact](https://linearb.io/contact-us)
- [About us](https://linearb.io/about-us)
- [Careers](https://linearb.io/careers)
- [Service agreement](https://linearb.io/services-agreement)
- [Privacy policy](https://linearb.io/privacy-policy)
- [DPA](https://linearb.io/data-processing-agreement)
- [Security FAQ](https://linearb.io/security-faq)
- [Substack](https://devinterrupted.substack.com/)

### Footer

_Additional links from the site footer, not repeated from the top navigation above._

- [GitHub](https://github.com/linear-b)
- [LinkedIn](https://www.linkedin.com/company/linearb)
- [Twitter](https://twitter.com/LinearB_Inc)