

Your merge rate is up, your teams are shipping more than they did a year ago, and the same handful of engineers open every review that matters. AI raised the volume of code arriving, and the work of judging that code goes to whoever holds the most context about your systems.
That volume does not convert evenly. In LinearB's benchmark data, drawn from more than 8.1 million pull requests, AI-generated pull requests merge at 32.7% while human-written ones merge at 84.4%. Review capacity is what the volume runs into, and the reviewing itself is toil that's being created for a small number of people. Getting visibility into that is challenging with the metrics most engineering orgs track, because cycle time, deployment frequency and PR throughput describe how fast code moves rather than who absorbs the cost of the speed.
The engineering health dashboard in LinearB reports on that cost directly, and it's available now to every customer with metrics builder enabled.
See who absorbs your review volume
An average review count across your organization can look healthy while most of the reviewing sits with a handful of people. The average is the number that hides the problem, because the load that wears people down is the load that concentrates.
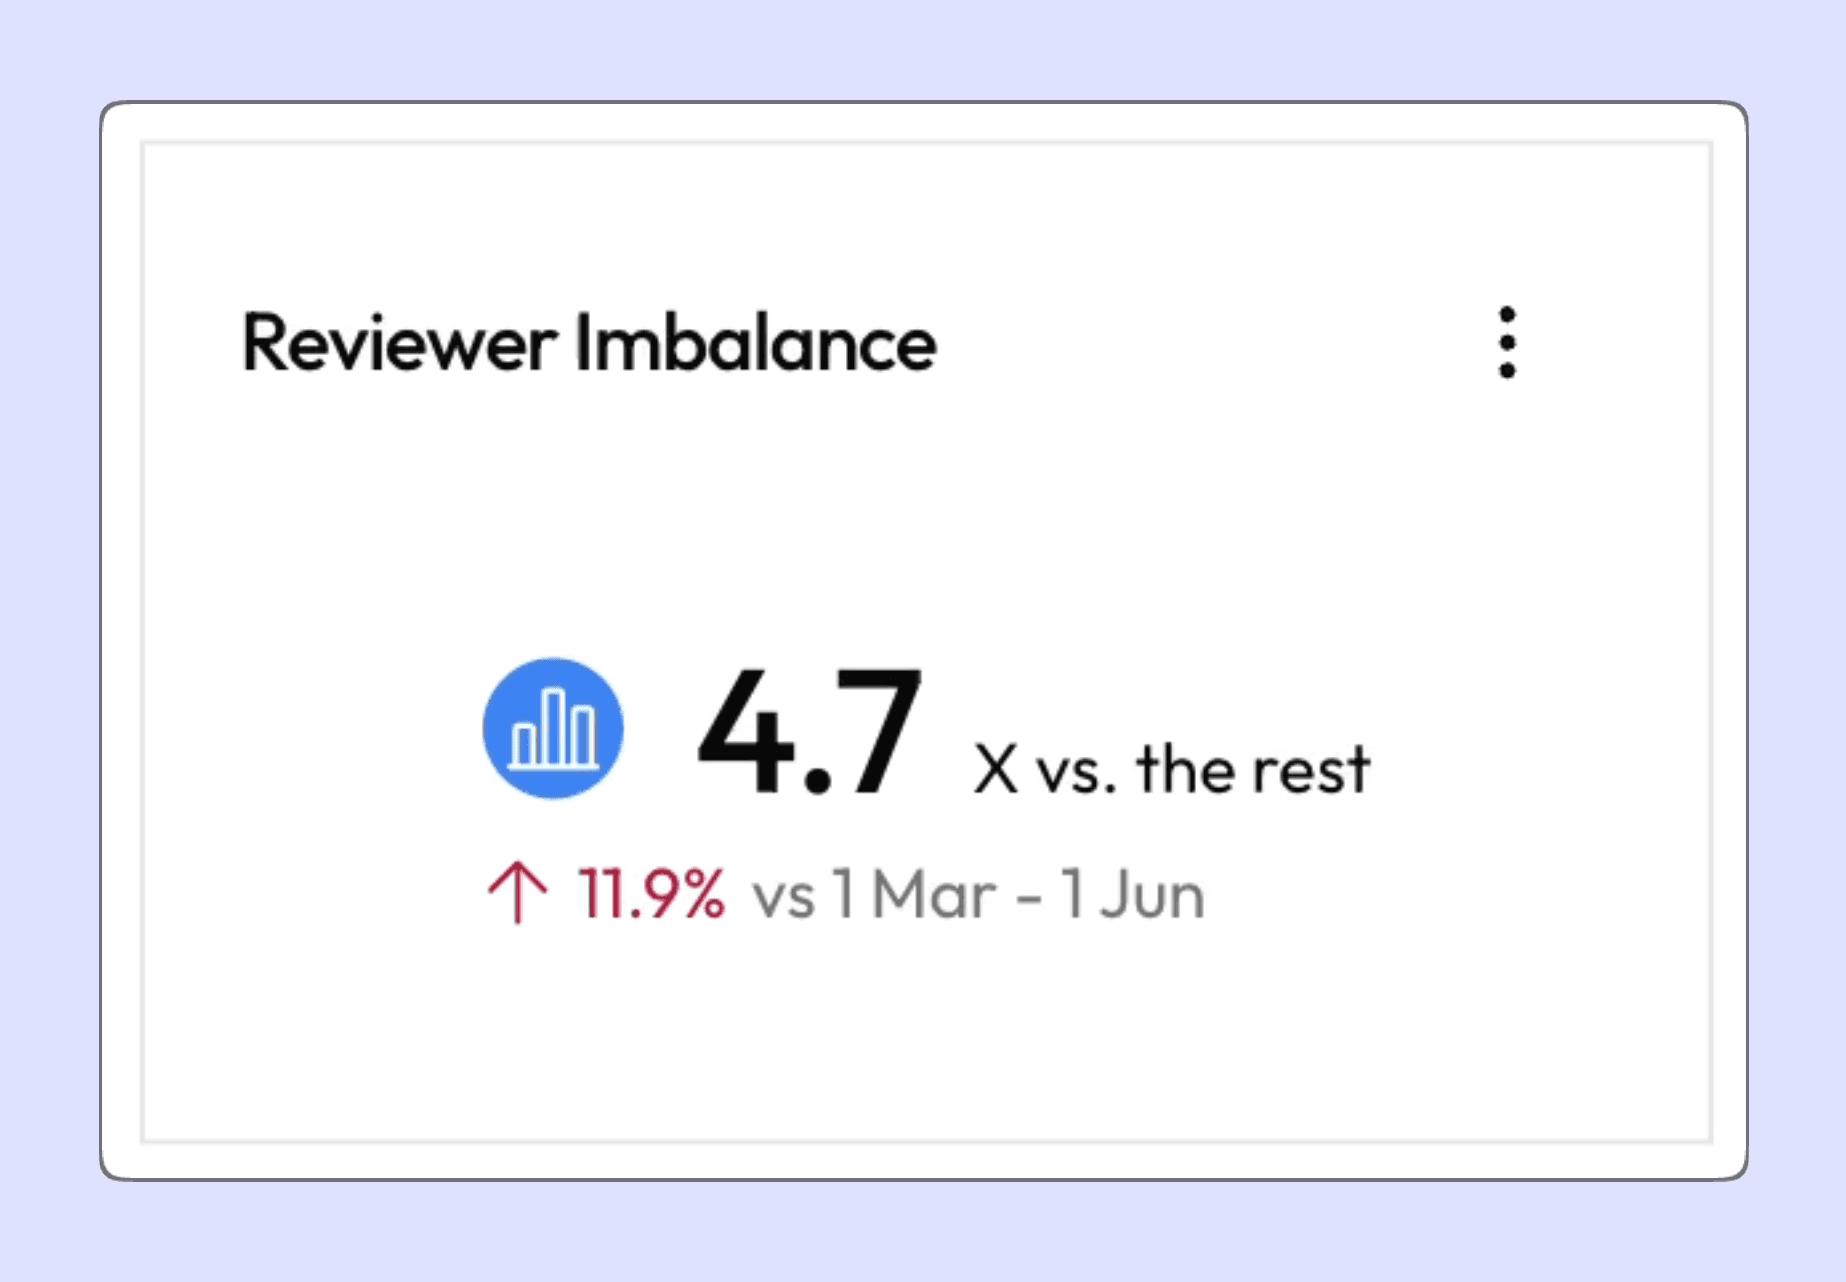
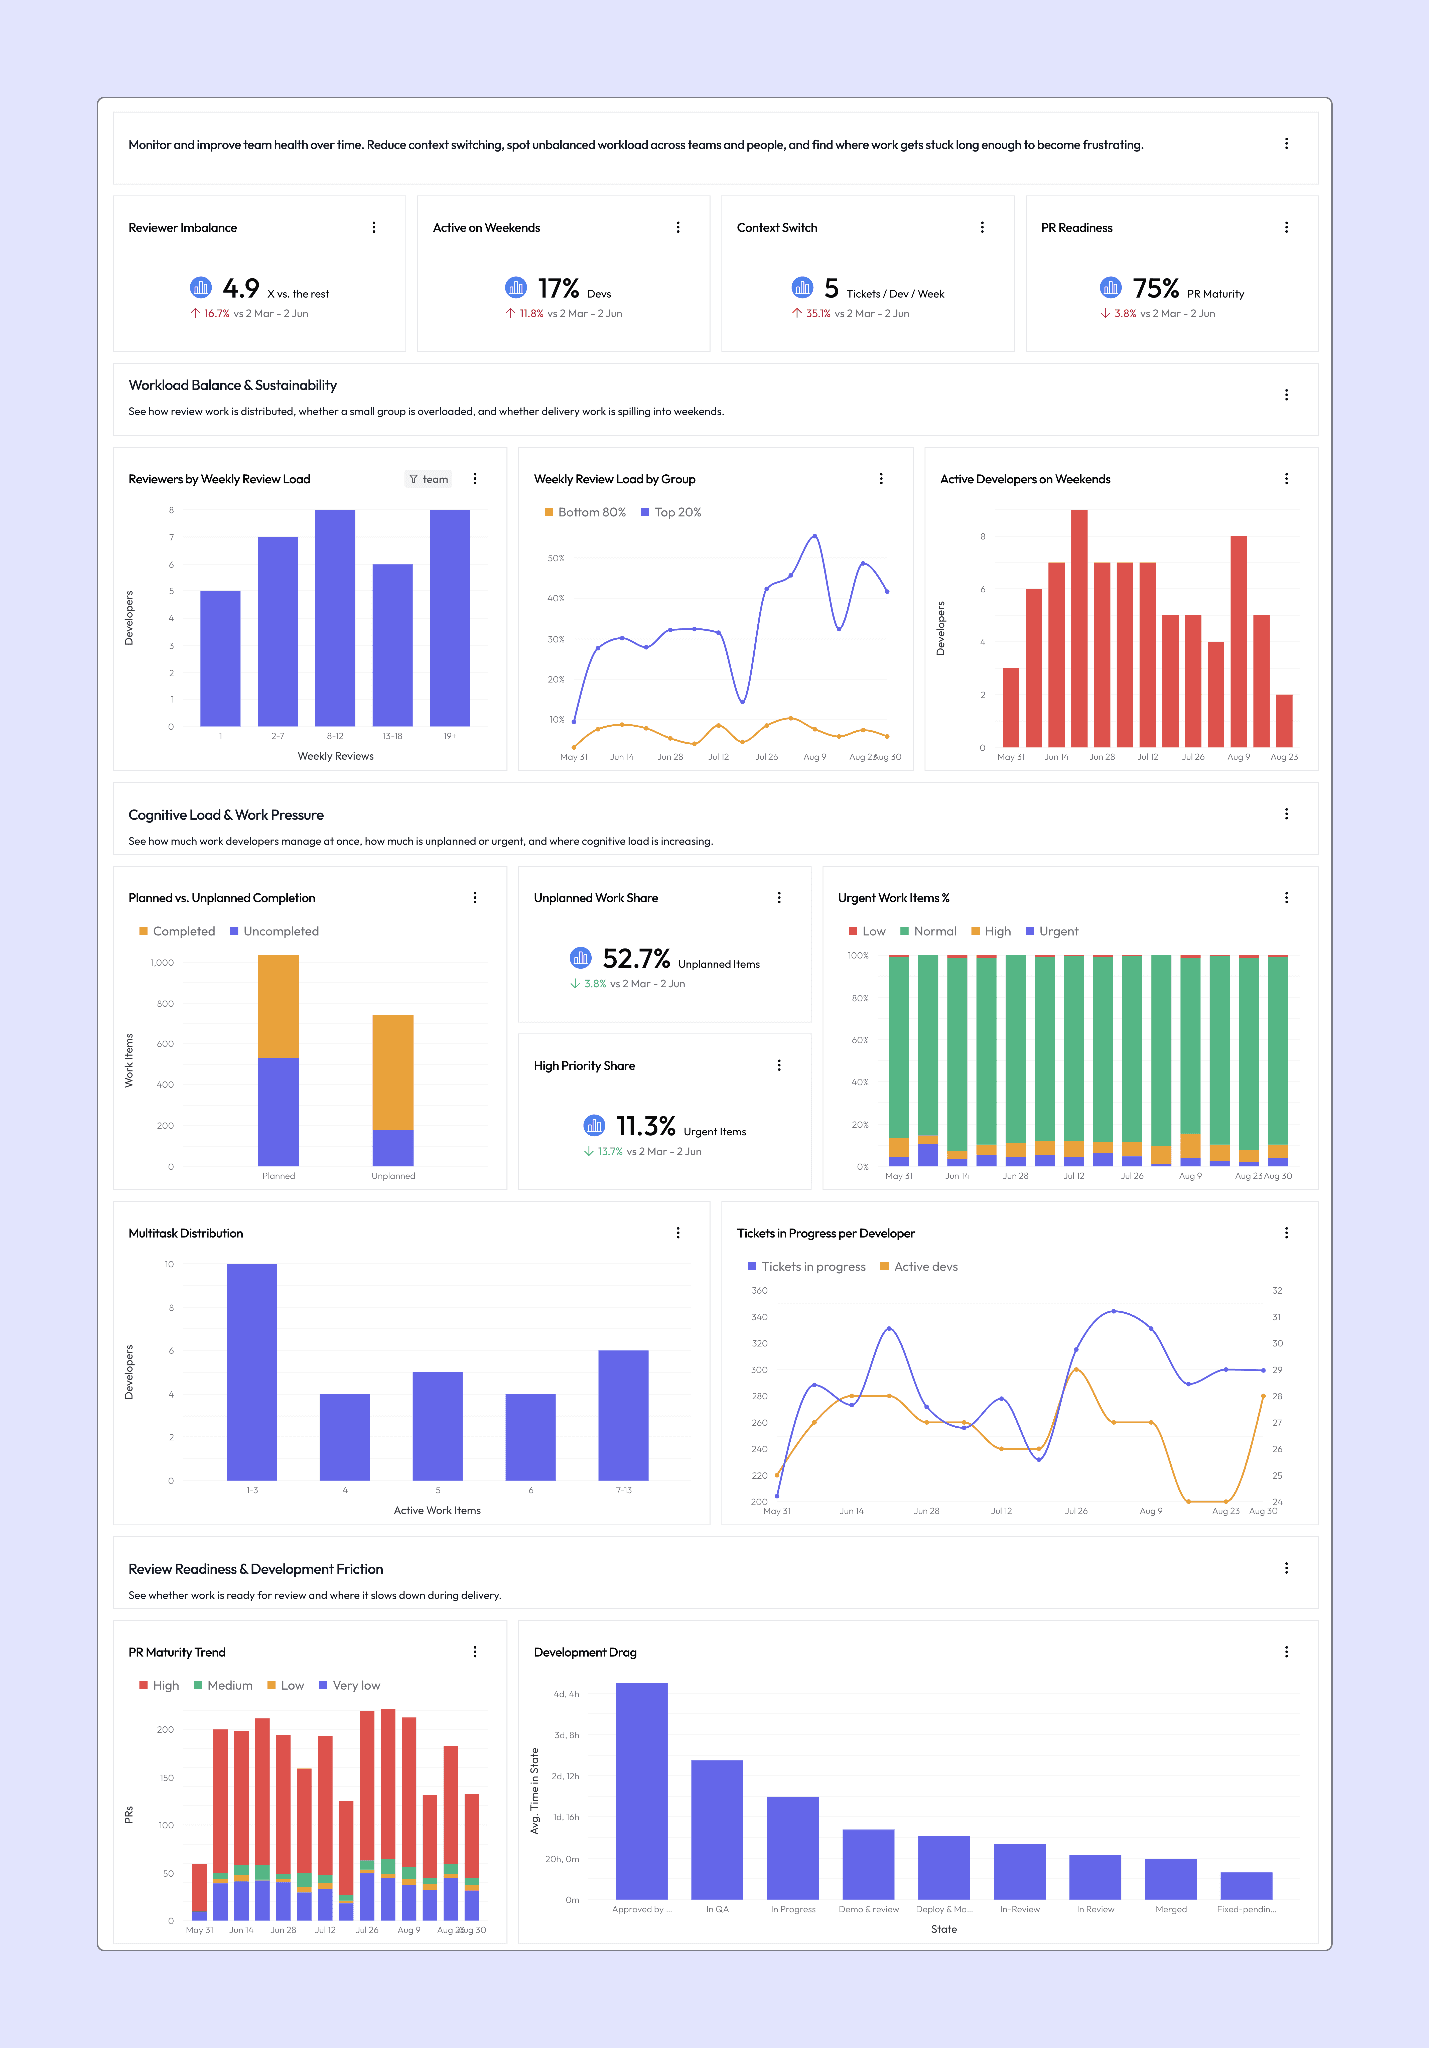
Reviewer imbalance in LinearB reports how many more reviews your top 20% of reviewers complete than everyone else, against the previous period.When that multiple climbs while your reviewer count stays flat, more of your delivery depends on fewer people.
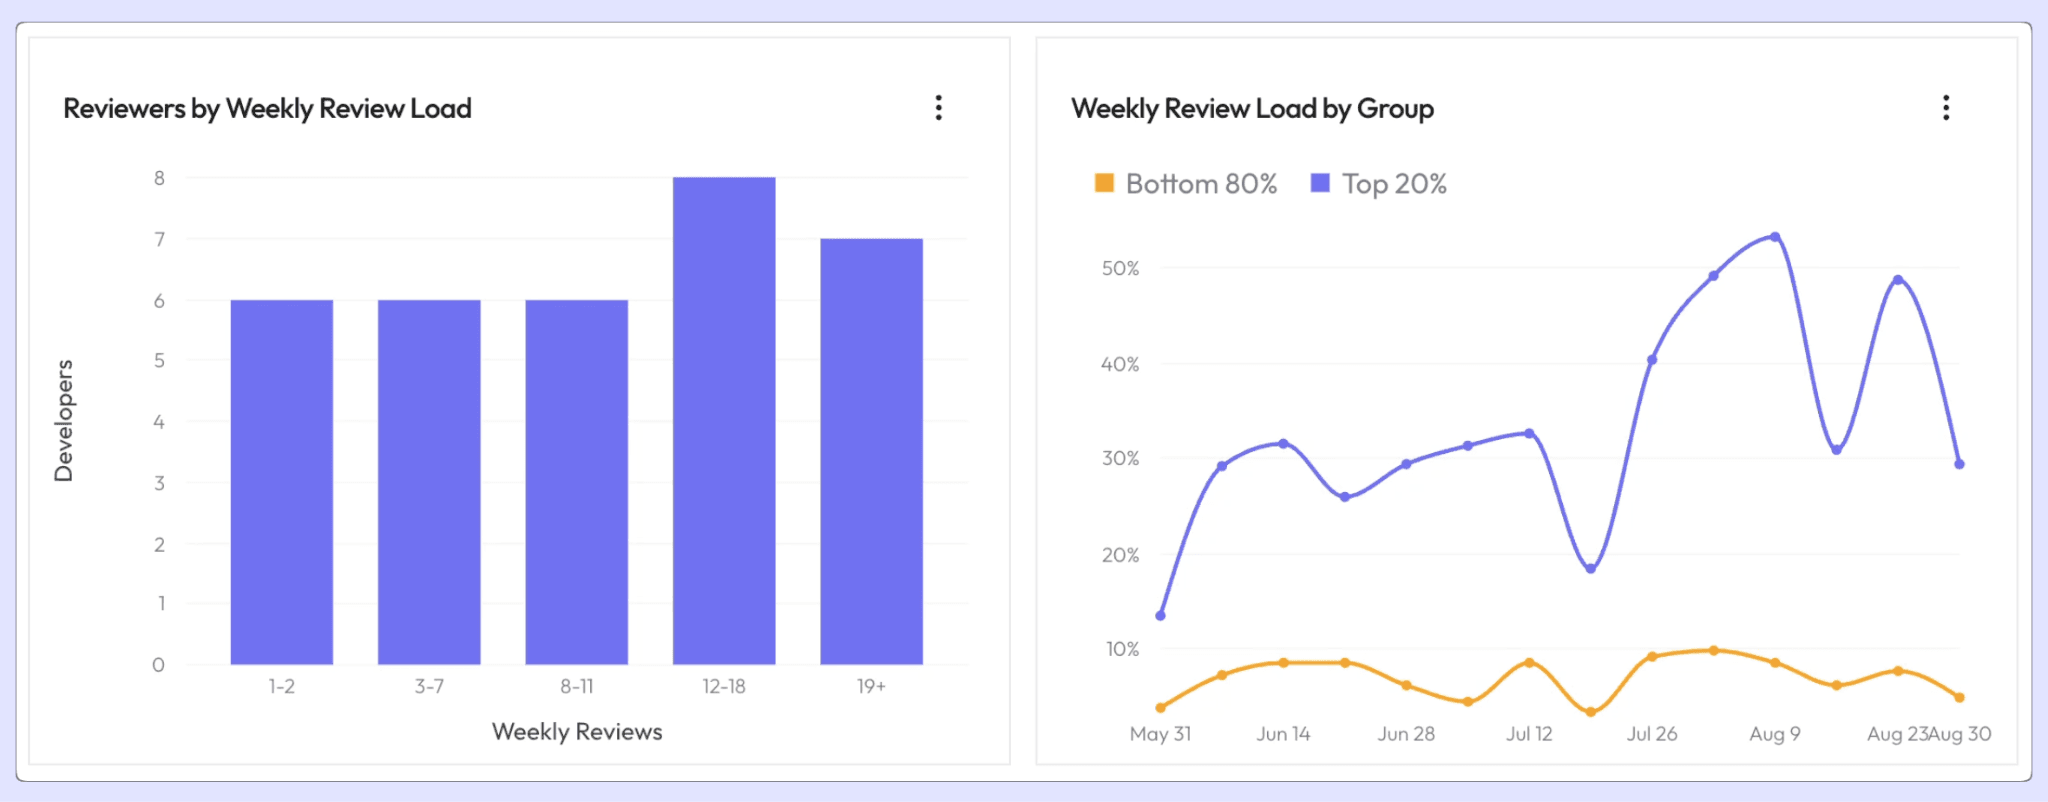
Underneath it, reviewers by weekly review load groups your reviewers by how many reviews each one completes per week, so you can see the shape of the distribution. Weekly review load by group tracks the same split over time, plotting the share carried by the top 20% against the bottom 80%.
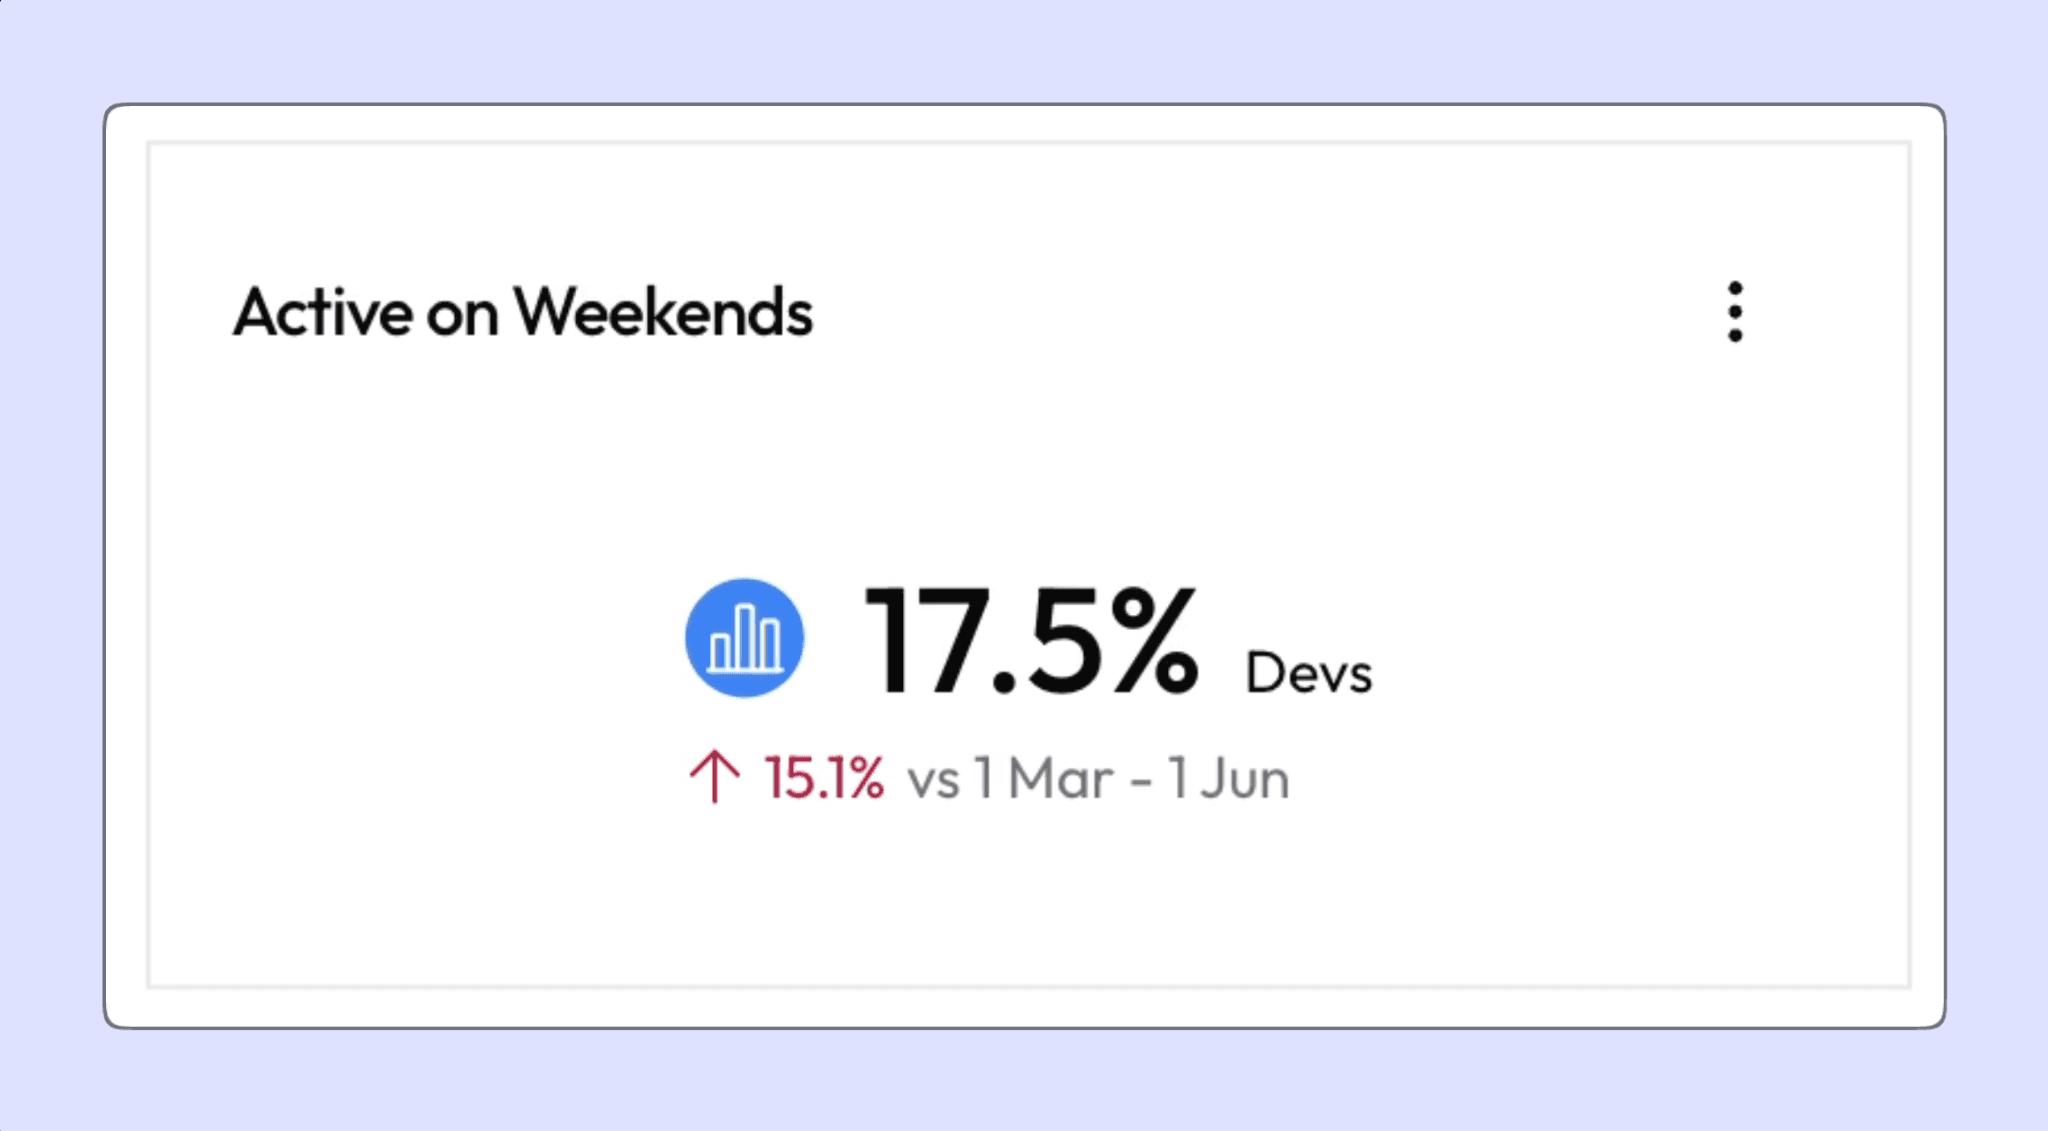
Active on weekends in LinearB reports the percentage of developers using their personal time to get through their workload.
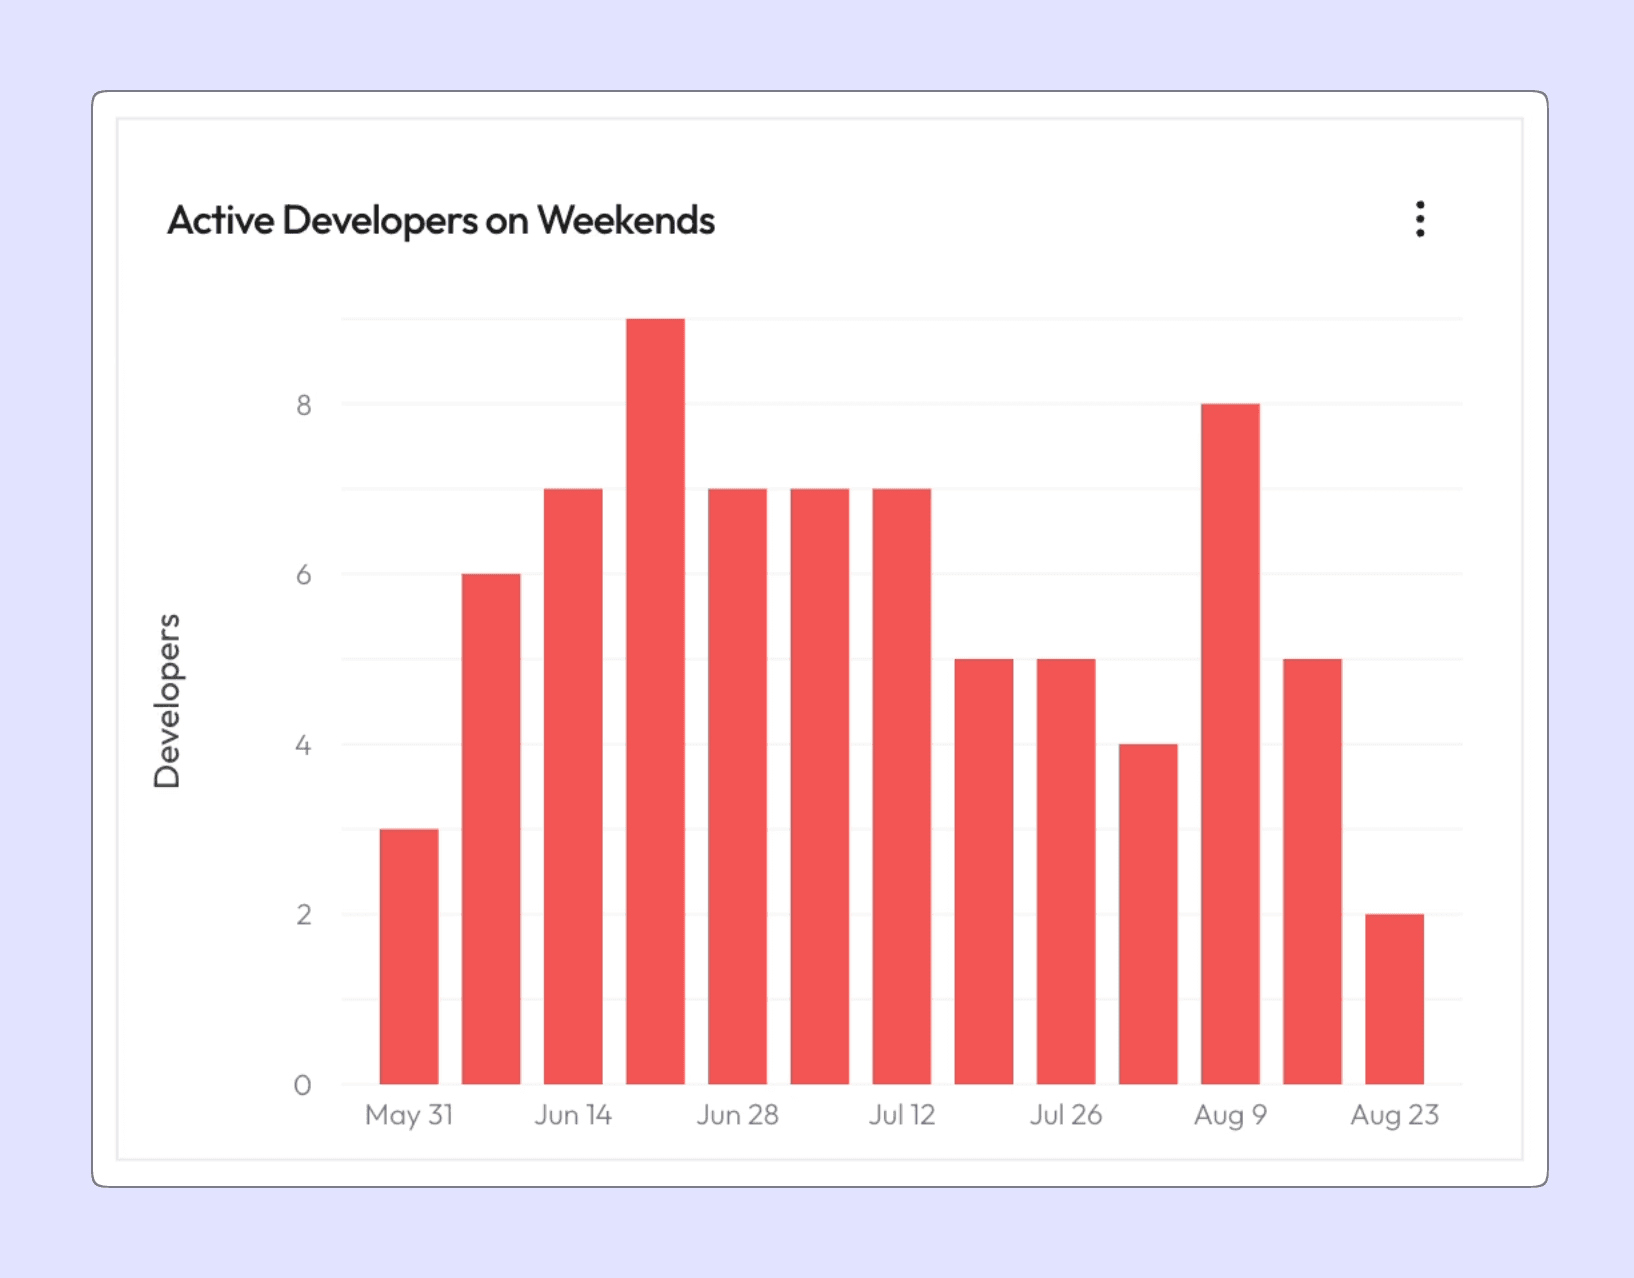
Active developers on weekends trends that week by week, so a sustained rise separates one hard release from a pattern your delivery has come to depend on.
When the distribution is skewed, the fix is usually routing rather than hiring. Kraken cut their review time by more than half in four months, from 2 days 15 hours to 1 day 3 hours at P90, after finding that 70 to 80% of their slowdown came from time zone differences, team silos and reviewer availability rather than from the size or complexity of the changes.
Parallel work is where cognitive load shows up first
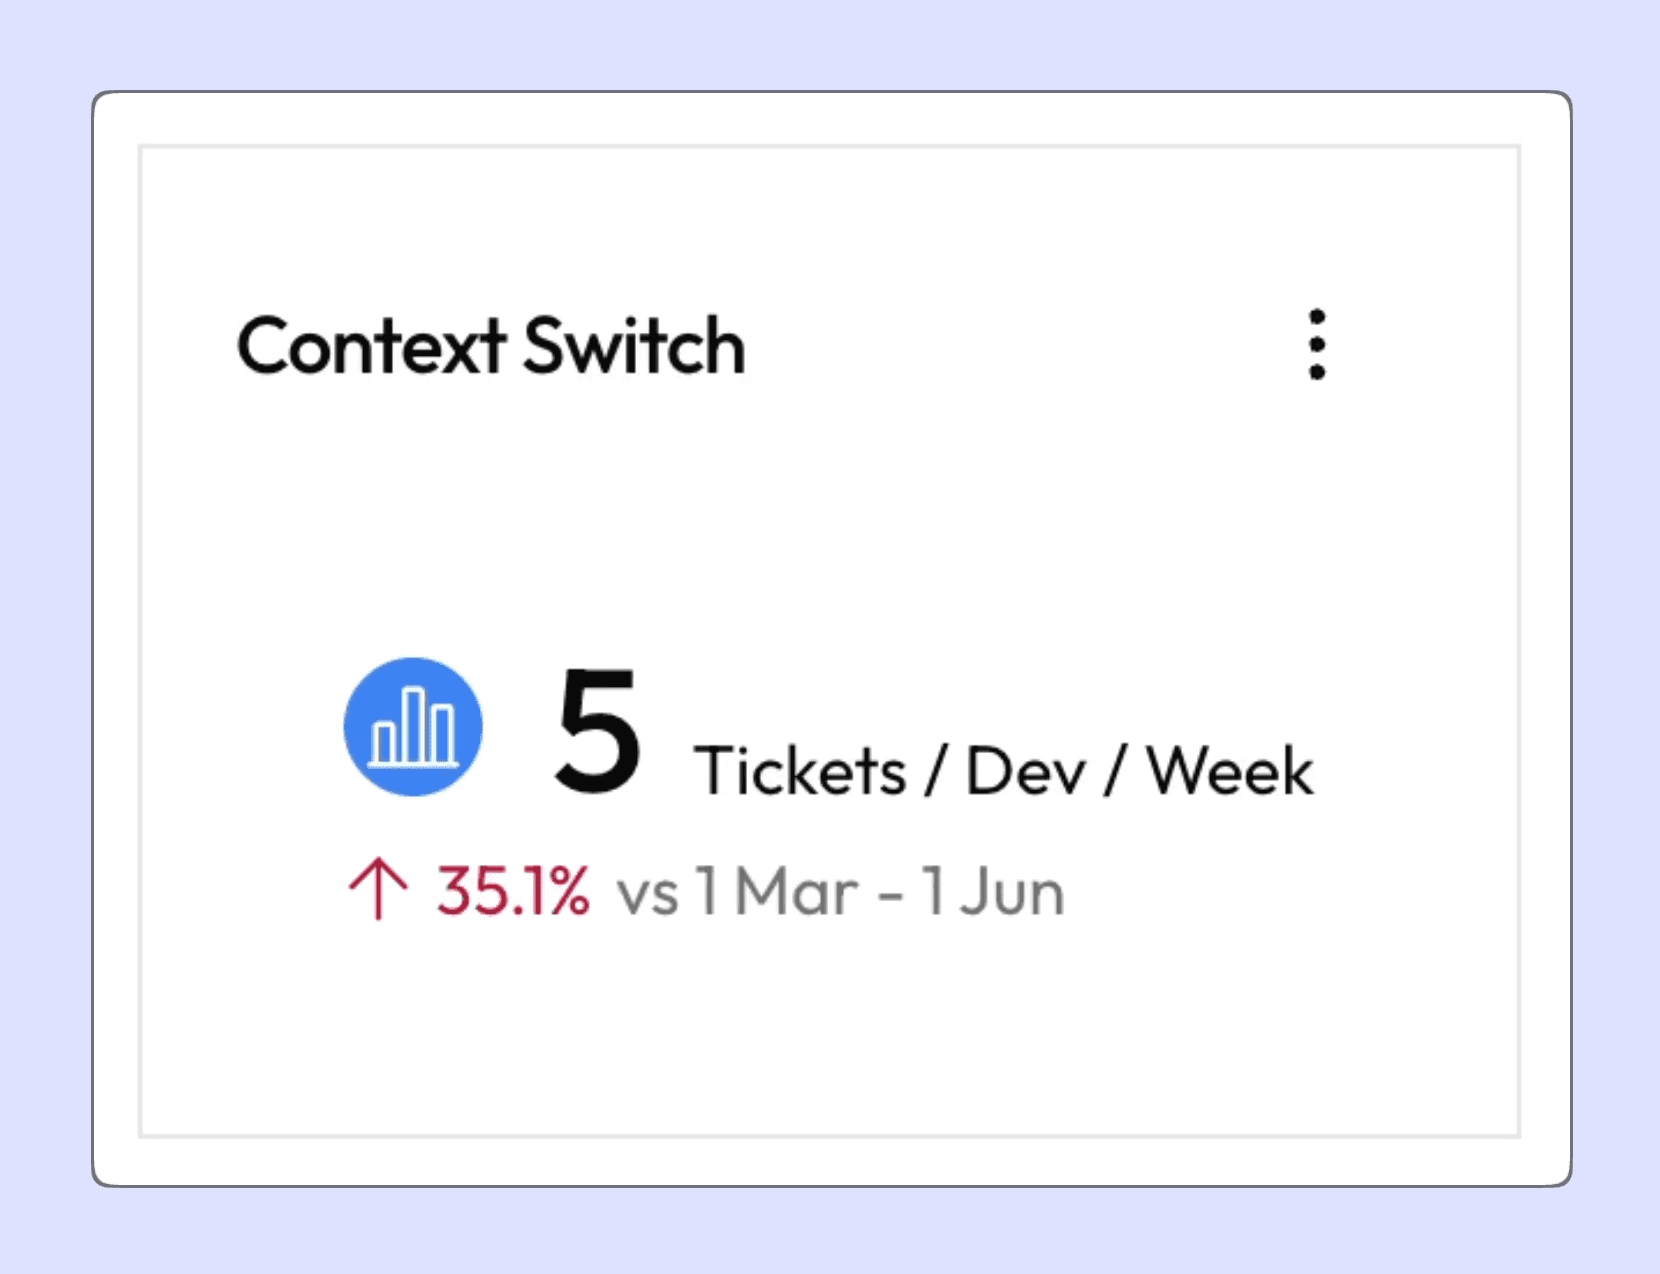
Reviewing is interrupt-driven and arrives on top of whatever a developer is already carrying. Context switch in LinearB reports the average number of work items a developer handles at once, indicating how much context switching your delivery currently requires. Multitask distribution groups your developers by how many tickets each juggles on their busiest day, so you can see whether the switching is spread across the team or sitting with a few people.
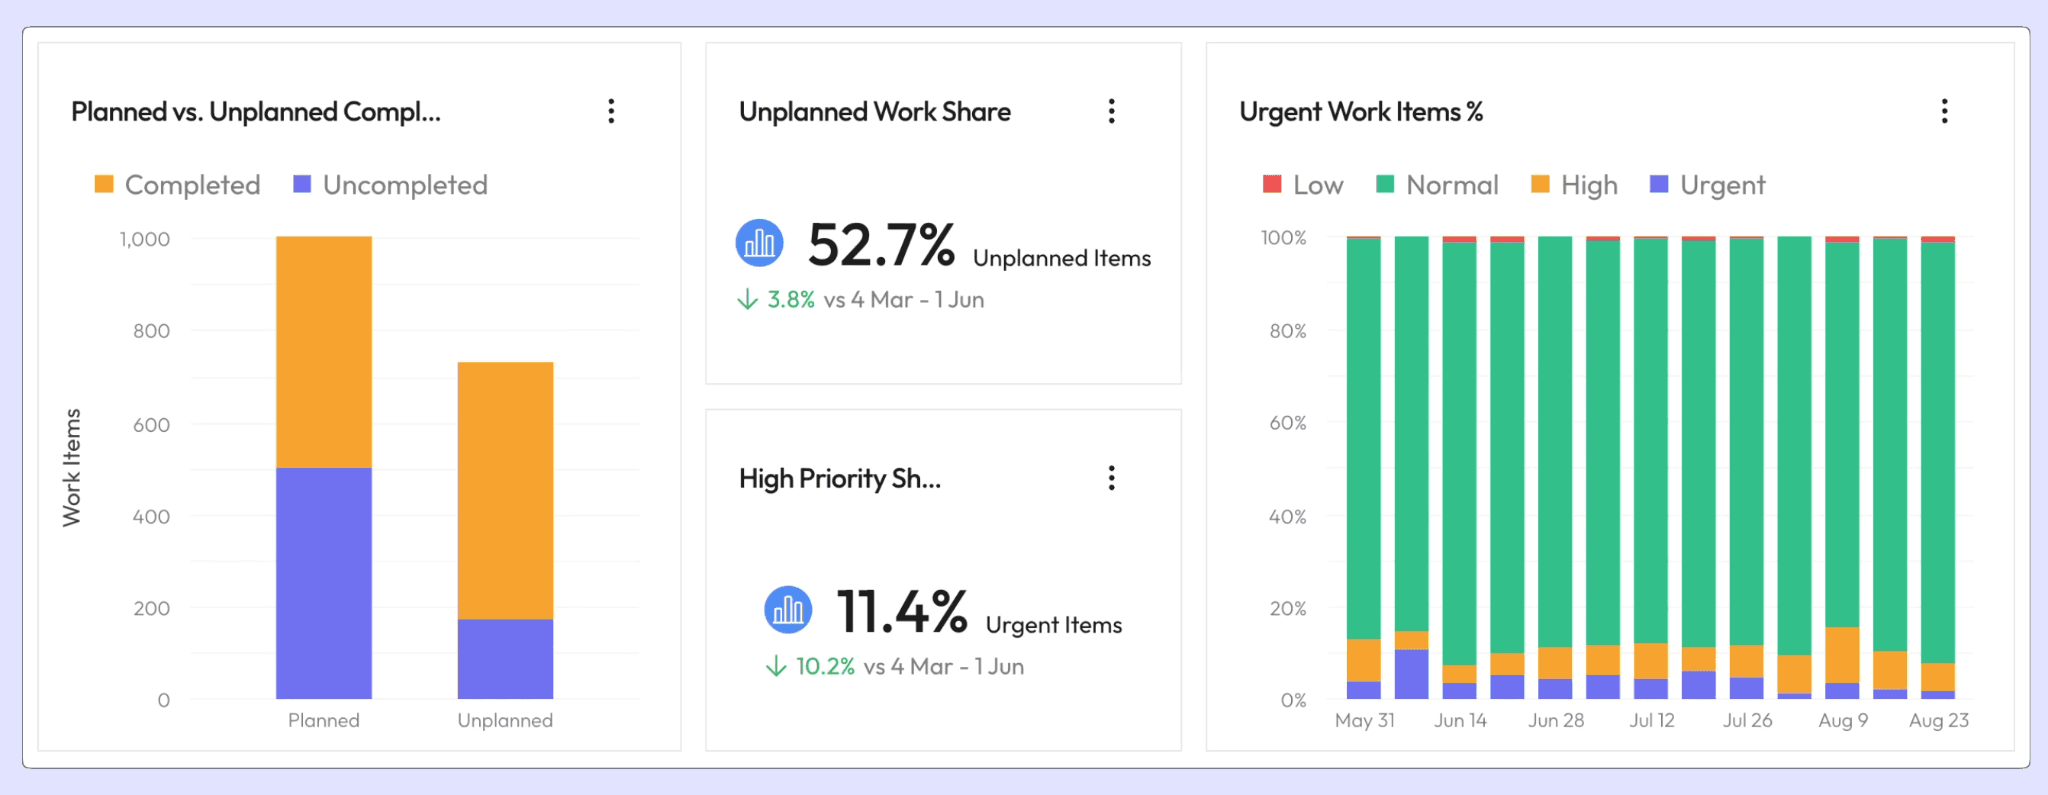
Planned vs. unplanned completion compares completed and uncompleted items across planned and unplanned work, and unplanned work share reports how much of your completed sprint work was added after the sprint started. Work items priority share shows the weekly share of items at each priority level, high priority share reports how much of your completed work carried a high or urgent label, and tickets in progress per developer trends the total in progress against your active developer count. When you read these together, they tell you whether a rise in parallel work came from more work entering or from the same work sitting longer.
Check whether the work reaching review is ready for it
Reviewers can clear a long queue when the work in it is finished. What eats the week is the work they have to send back, and queue length never tells you how much of that is coming.
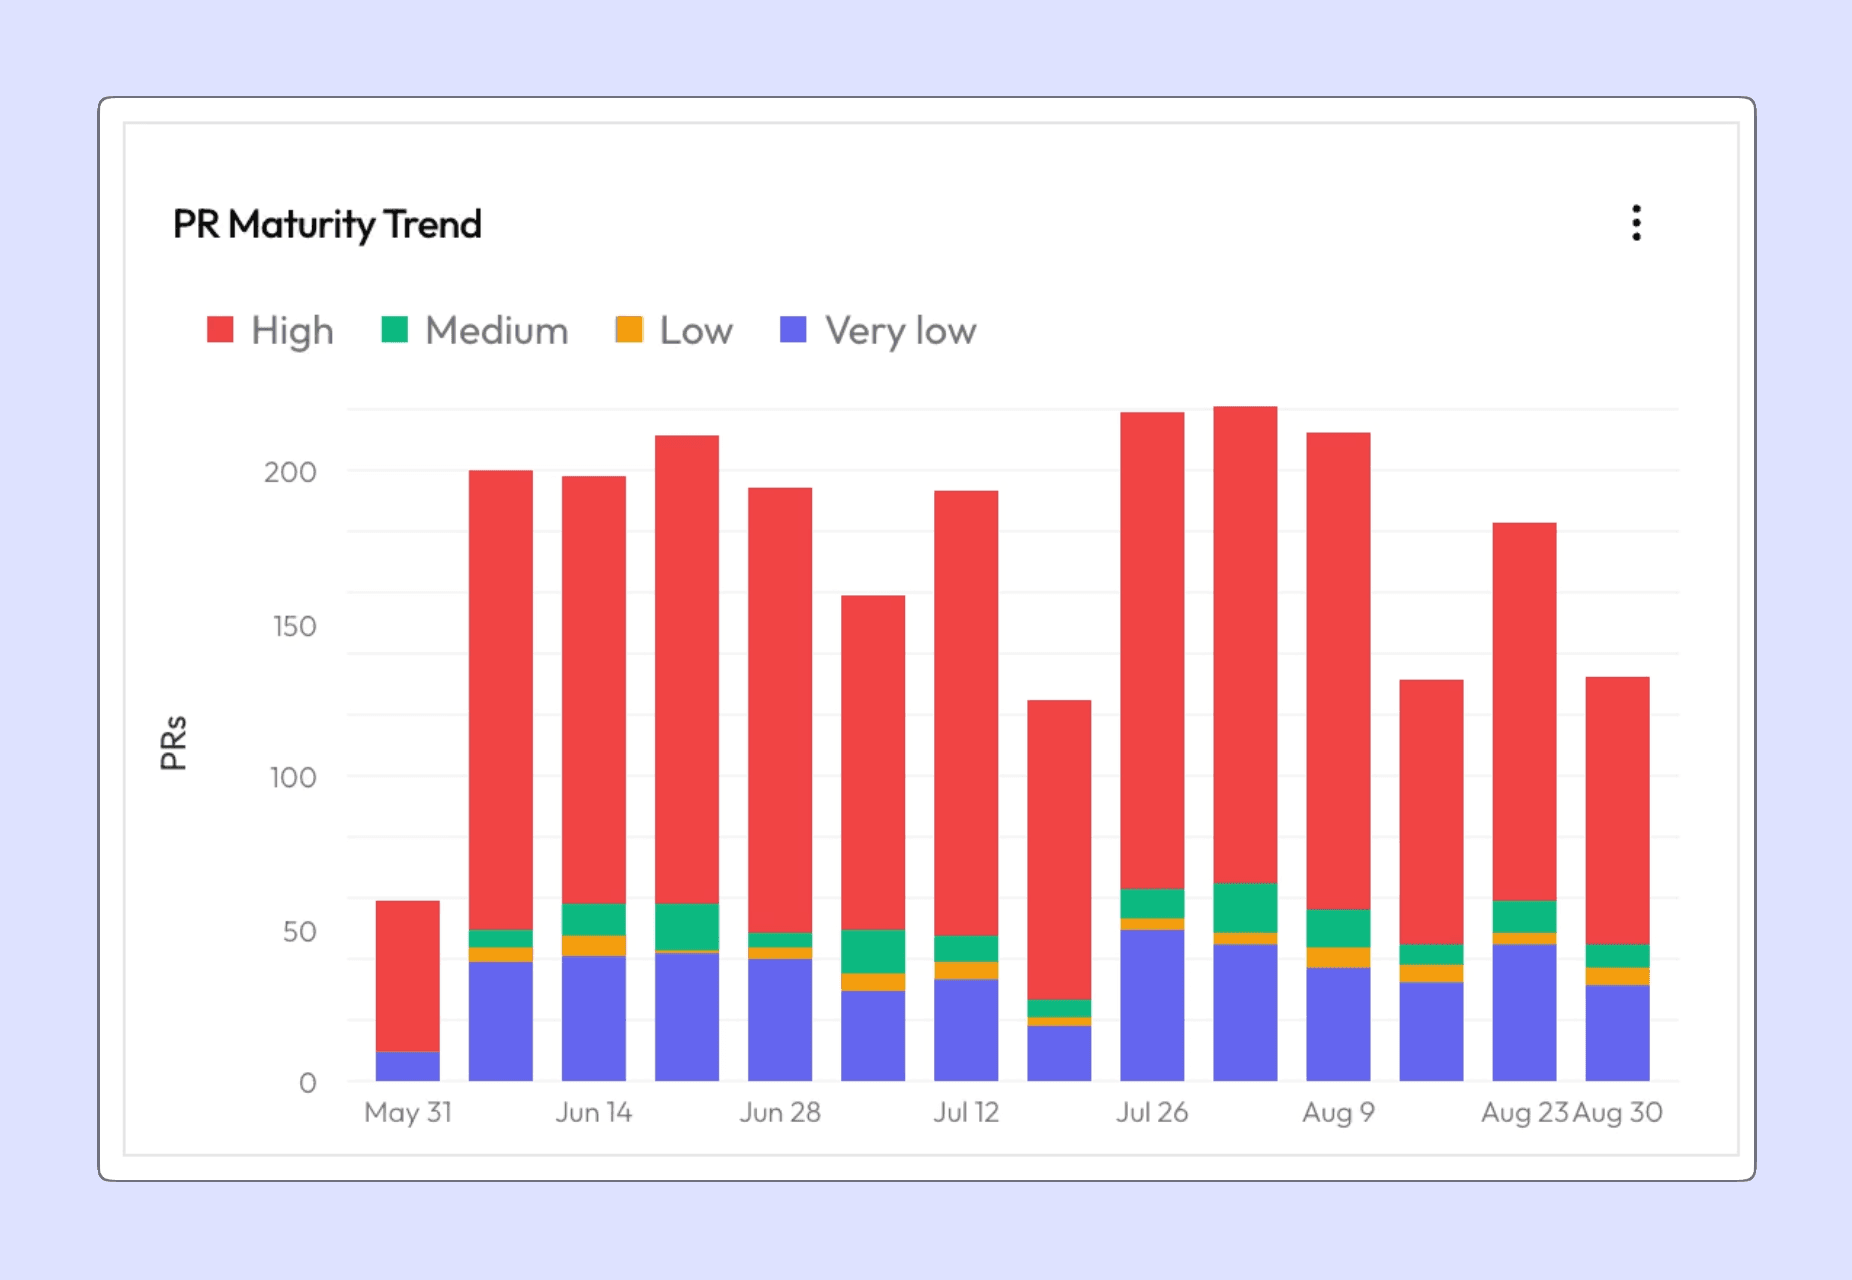
PR readiness in LinearB reports average PR maturity, which is how complete pull requests are when they are opened, and PR maturity trend breaks that down weekly across maturity bands.
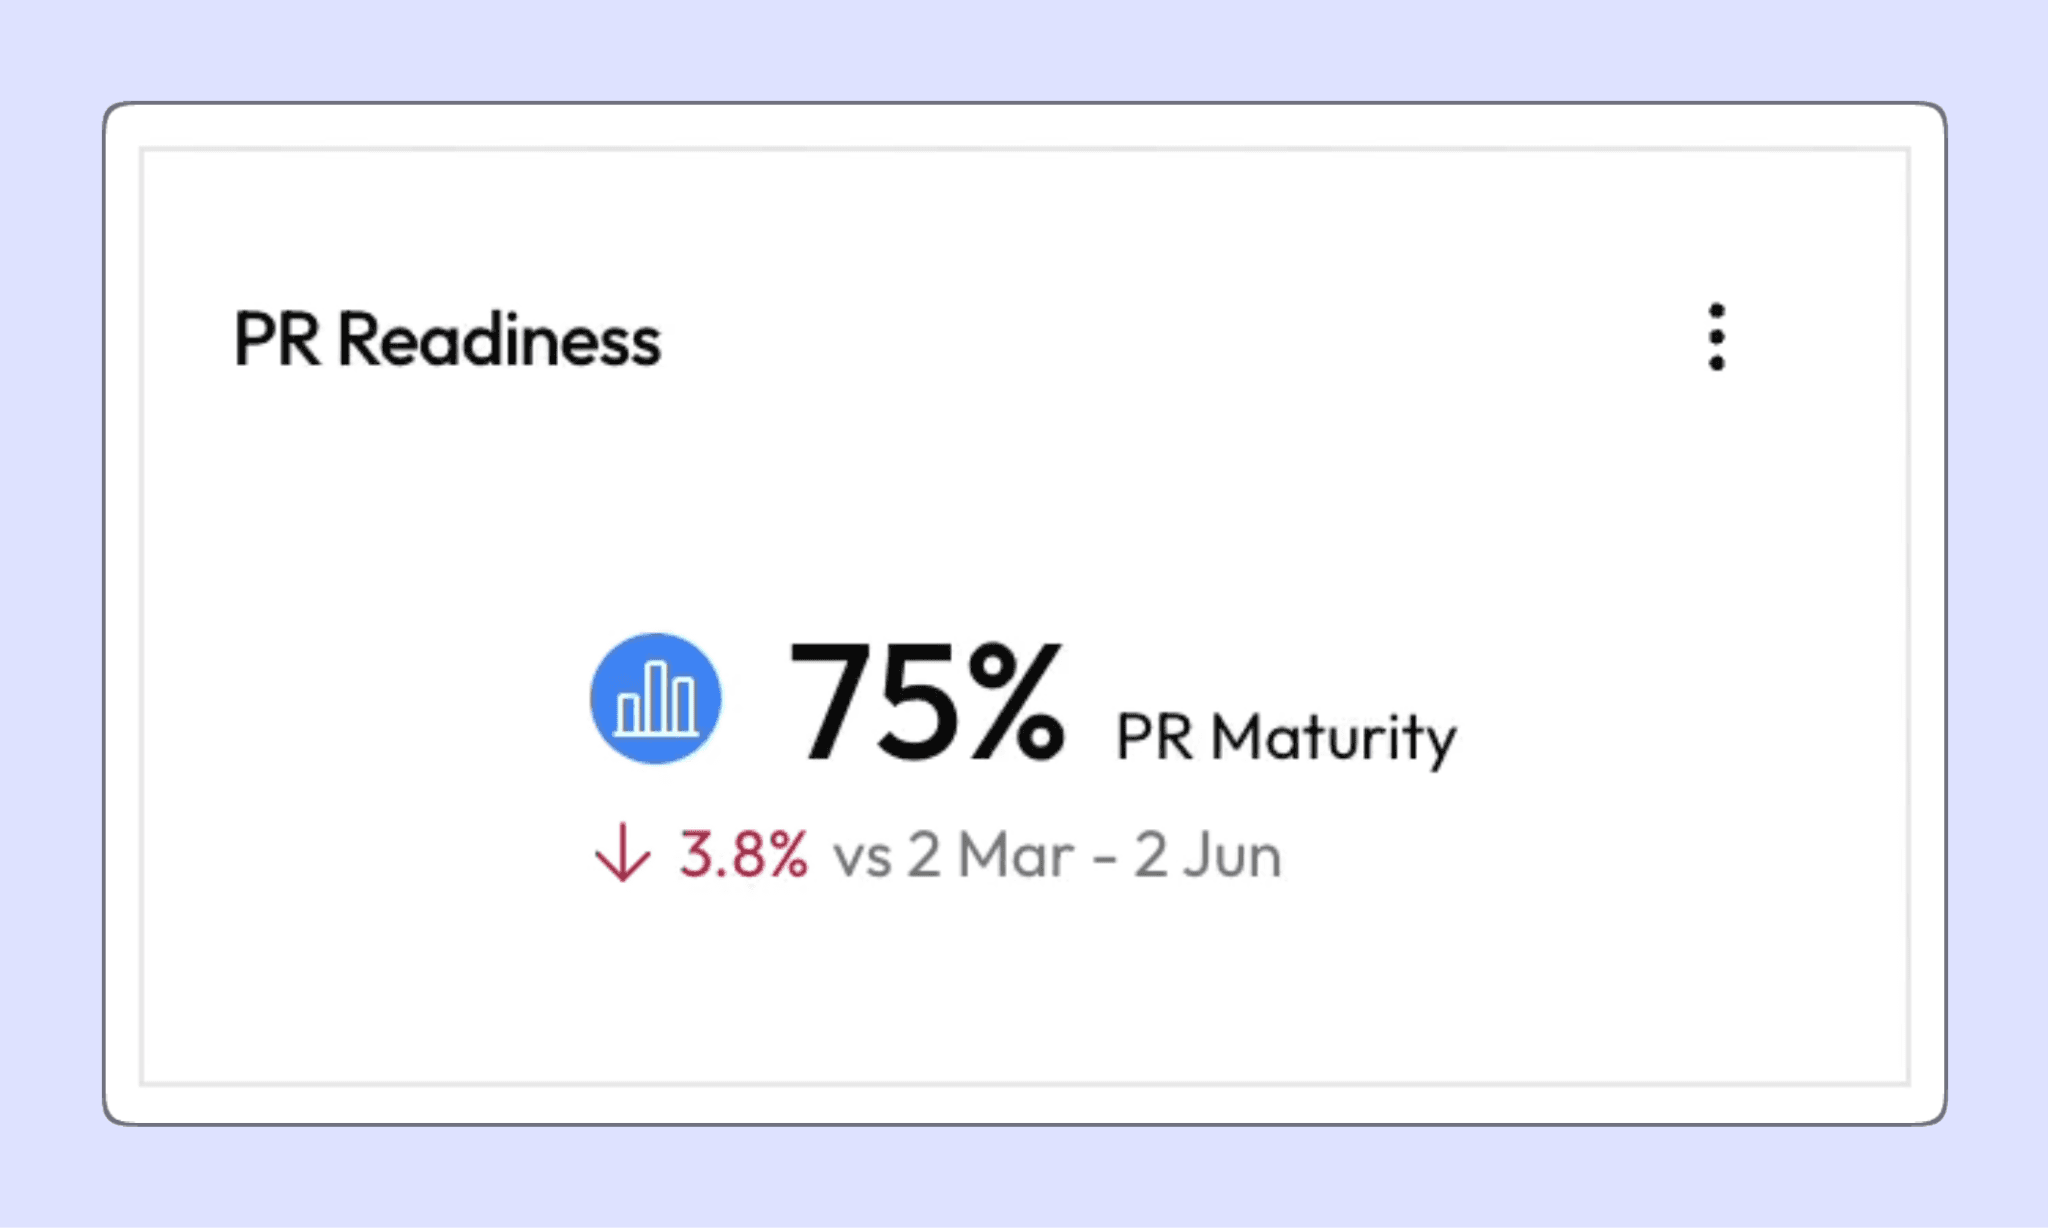
A falling score means more of what arrives needs rewriting once a reviewer looks at it properly.
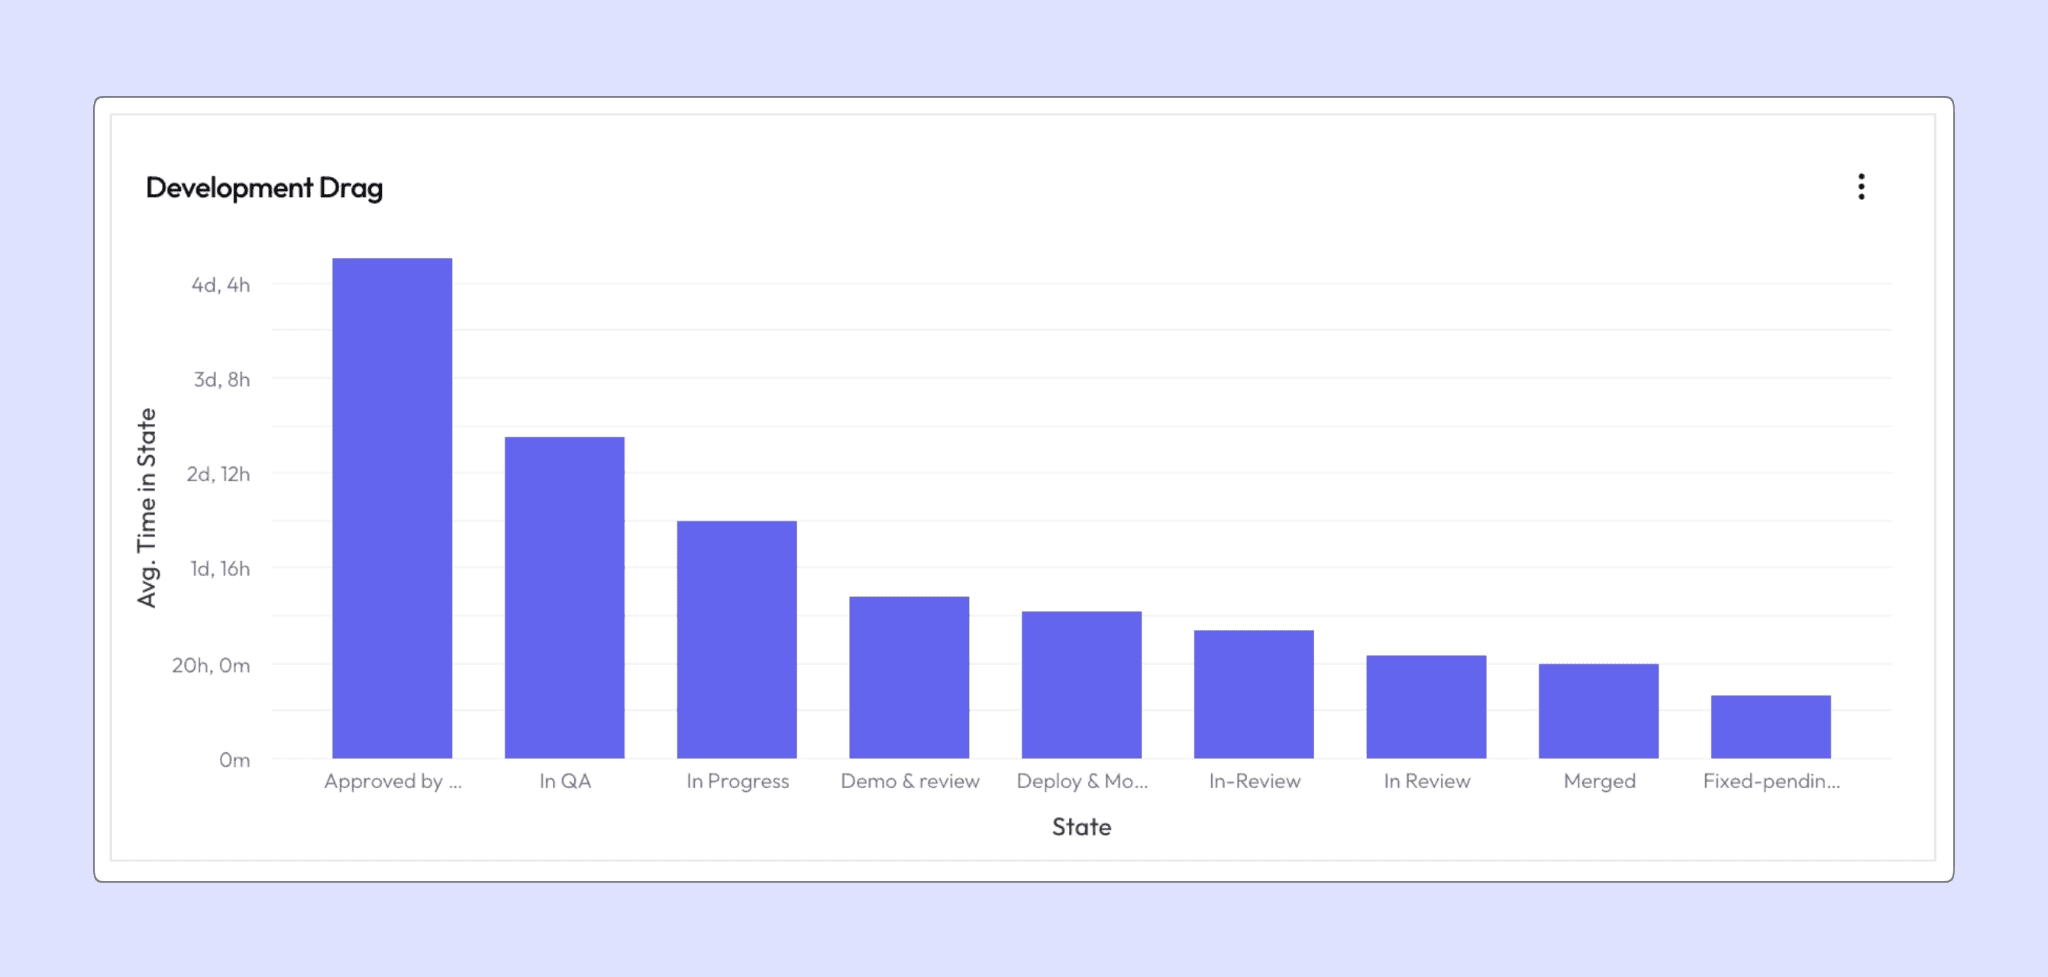
Development drag shows the average time work items wait at each workflow stage. The stage with the longest wait is where your delivery accumulates frustration, and it is rarely the stage your team assumes.
Get complete visibility into engineering health in LinearB
Each of these answers one piece of whether you're absorbing AI's output in a way your engineering organization can sustain, and together, on one dashboard, they answer the whole of it. You can see who carries the review load, how many tickets each developer juggles in a day, how much of the work arrives unplanned, and whether what reaches review is ready for it, cut by team and trended against the previous period.
If your delivery pace currently depends on a small group of people, this is where you find out which people and by how much. Book a demo, and we'll walk your own numbers with you.


