Introduction
LinearB has all sorts of engineering metrics for your software development pipeline. We can slice and dice those metrics from all kinds of angles and all sorts of ways. Your CTO will want to see very different views of LinearB data than will your developer leads. Whether you are trying to see into the health of your delivery pipeline, seeking out bottlenecks in your system, or worried about making sure only LinearB can help you gain those insights.
Since the presentation of data is critical to its effectiveness, LinearB allows you to create views into your data for different levels of your organization and your code. The three most interesting views into your data are:
- Organization Level Engineering Metrics
- Team Level Engineering Metrics
- Repository Level Engineering Metrics
Organization Level Engineering Metrics
The highest level view of your company’s engineering metrics is at the organizational level. This is the view that rolls up everything that every developer on all your teams does into one single view.
An organization-level view helps you align business priorities by visualizing your project investment at the 50,000-foot view. As an executive, you plot the course and fly the airliner. You need to make sure your team’s efforts are aligned with business goals and that you are doing everything in your power to ensure the success of crucial projects. By viewing things from the top, you will be able to get the proper glimpse into what and how your development team is doing.
Why look at the organization-level engineering metrics?
The organization-level engineering metrics view is usually most valuable for the CTO or VP of Software Engineering. It provides a complete, high-level look at everything happening in the software development realm. CTOs and VPs can get an executive summary of things like Cycle Time, Work Breakdown, and your Investment Profile.
They can get a high-level view answers questions like:
- What is the team working on?
- How fast are we delivering that value?
- Where is our investment going?
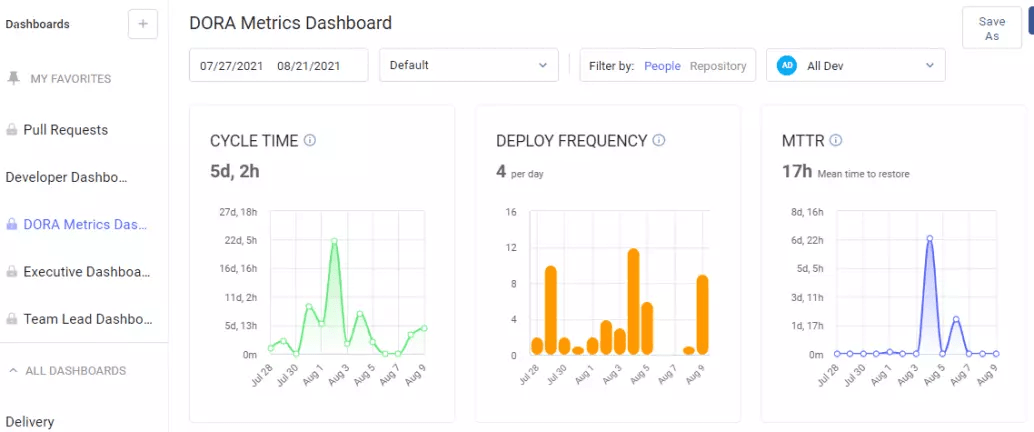
- What do my DORA metrics look like?
Let’s take a look at how LinearB can answer these questions.
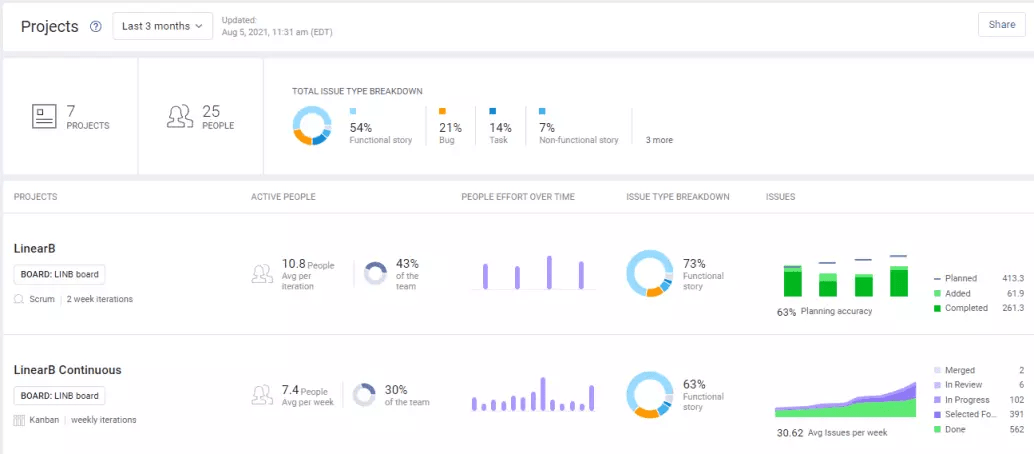
What is the team working on?
The Project View can show you exactly what projects your team is working on and the high-level status of each of those projects:
How fast are we delivering value?
Organization-level Cycle Time can tell you how well the team is delivering value. A lower cycle time means more value is arriving in the customer’s hands sooner. It also means that you are breaking your work into smaller, more manageable chunks, thus encouraging good Code Review practices. For instance, if you identify that your Coding Time is a problem (as below) then you can take action to correct it.

Where is our investment going?
You can see what the team is working on via the Investment Profile View. This view tells you the type of work and what percentage of each type is being done by the team. Perhaps you might notice that bug fixing is climbing. Perhaps that is on purpose. Perhaps not. Either way, you can see it happening and take action.
What do my DORA metrics look like?
DORA Metrics are easy to track in LinearB, again, via a custom dashboard:
Team Level Engineering Metrics
Just as executives need a view into their software development team’s engineering metrics, so, too, do Dev Managers and Dev Leads. They are interested in more day-to-day metrics that track how things are progressing with their specific development pipelines. Dev Leads and Dev Managers want to remove workflow blockers, set goals for workflow optimization, and keep code — and thus value — working its way through the development pipeline.
Why look at team-level engineering metrics?
Dev Leads and Dev Managers want to know the answers to questions like:
- Where are my bottlenecks?
- Are my developers aligned to business priorities?
- Is the team effectively working together?
Where are my bottlenecks?
Bottlenecks can be easily spotted by drilling down into Cycle Time:

It couldn’t be easier — anything that isn’t green is a bottleneck for the team. If you need to, you can drill down into the team and project level to see what is causing the bottlenecks.
Are my developers aligned to business priorities?
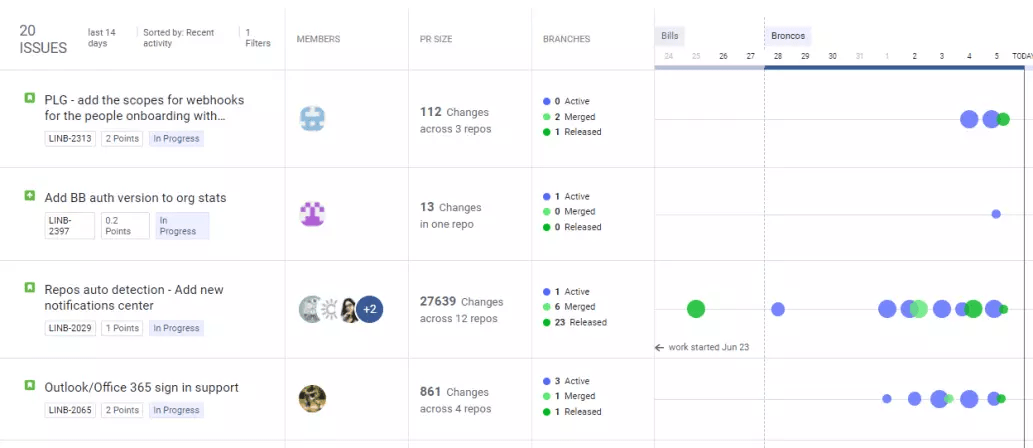
The Pulse View can tell a Dev Lead exactly what her team is working on. The Pulse View melds information from your git repository and your Project Management tool to provide valuable insights into what each team and team member is doing.
Below you can see four of the twenty issues that the entire team is currently working on. The view shows active, merged, and shipped work for each project. More and bigger dots mean more activity on a given issue.
Is the team effectively working together?
Ensuring that the team is working together and all rowing in the same direction is a large part of a Development Manager’s job. Out of the box, LinearB provides three team-level dashboards — they are called Quality, Delivery, and ThroughPut — that provide insights into the team-level engineering metrics that are useful for Development Managers.

A large part of the teamwork on a software development team is ensuring the smooth, steady flow of Pull Requests. Keeping an eye on Pull Requests and their corresponding Code Reviews is as easy as setting up a custom dashboard:
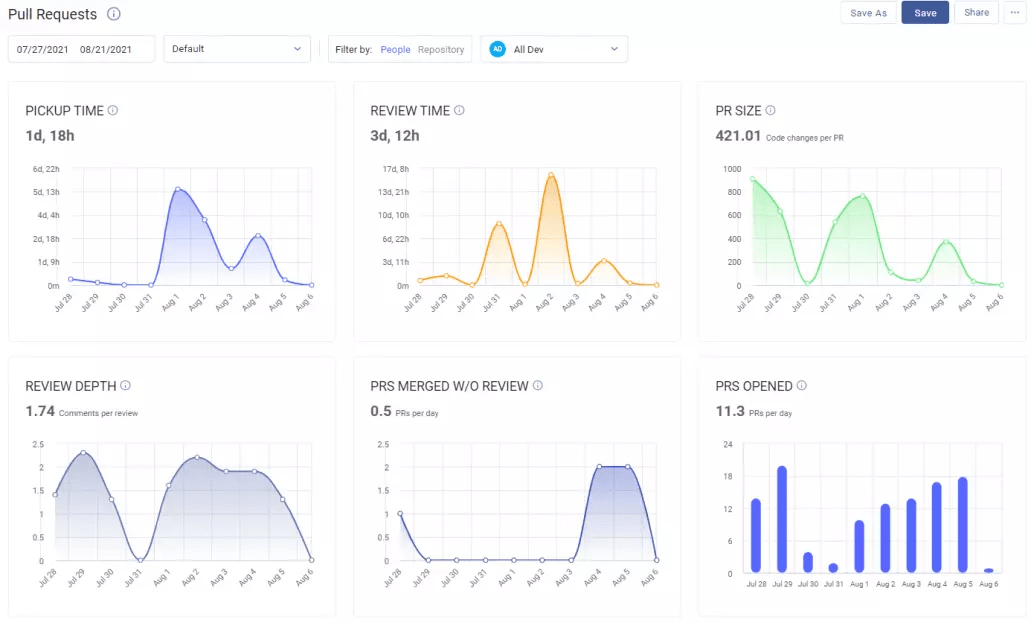
Here you can see things like how long it takes for a Pull Request to be picked up and a review started, how much time is being spent on reviews, the depth of those reviews, and more. All of this information can be used to find bottlenecks in your coding pipeline.
Repo Level Engineering Metrics
LinearB’s newest view is the Repository Level view into your codebase. This is best seen via pre-built and custom dashboards. You can create a specific dashboard and then choose to look at it with either the “People” or “Repository” view. This enables you to quickly and easily peer into a specific repository from any dashboard.
Why look at the Repo level metrics?
It is quite common for a larger project to be broken down into multiple repositories. While a view into what a team is doing, sometimes multiple teams are working together on a repository and the status of that repository can become a concern.
Or perhaps your project is based on the microservices model, and you have a repository for each service. With the Repository Level View, you can see what is going on inside the repository for any of the services that may need your attention
Now, with LinearB’s new Repository Level View, you can easily check the health of a given repository.
Here’s a thorough example of a dashboard that will give you insight into a repository as opposed to what your team or organization is up to.
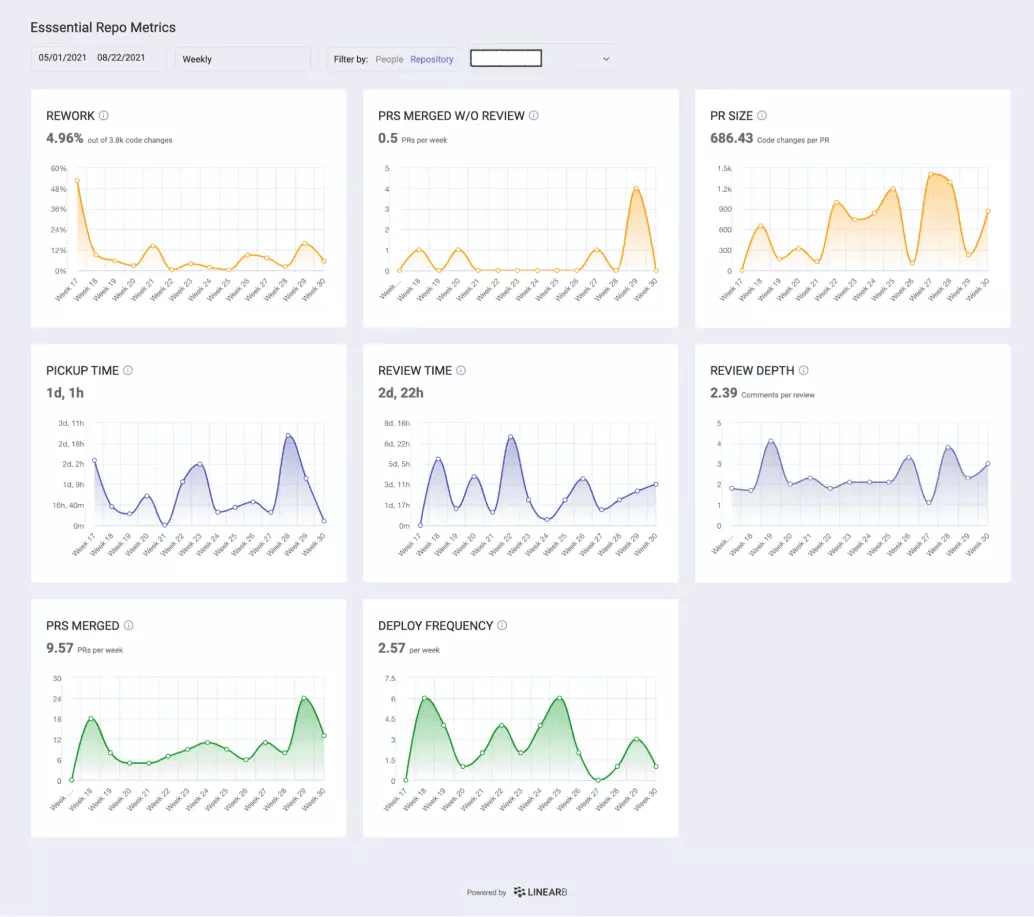
This view has been broken down into three areas of interest by the row of the dashboard:
- Quality metrics in Orange
- Review success in Purple
- Code throughput in Green
The three quality metrics are:
- Code Rework — This measures the amount of committed code that are changes to existing code created less than 21 days ago. LinearB recommends that you keep Code Rework to under 3% for any given repository. If you see it going above that, you will know that you have code quality issues or that requirements are changing or not well defined.
- PRS Merged without Review — This number should be zero — a flat line across the bottom. There should never be a merge (above a configurable minimum size) that isn’t reviewed. A lack of code review could mean low-quality code has been merged into the repository.
- PR Size — Large Pull Requests cause all kinds of problems, including low Pickup Time, Long Reviews, and Pull Requests with low Review Depth. Pull requests should be small and easily digestible. LinearB recommends that Pull Requests average less than one hundred changes. We also recommend that if they get above two hundred changes, then it could indicate problems discussed above.
The three review success metrics are:
- Pull Request Pickup Time — PR Pickup TIme is the amount of time between the Pull Request being submitted and the first comment is made on the Pull Request. LinearB recommends that you keep this to less than one day so changes are fresh in everyone’s mind. If the Pull Request Pickup Time starts rising, it likely indicates that other developers are hesitant to start reviewing code, perhaps because they are too busy with Work in Progress or because the Pull Request is large and complex.
- Review Time — This is the amount of time spent reviewing the code. If it is too little, say less than a day, it could indicate that reviews are superficial. If it is too high, more than four or five days, it likely means that the code is complex and difficult to understand, and thus difficult to approve.
- Review Depth — This is the average number of comments per review. If it is below two, it indicates superficial reviews. More than five, it could indicate complex or hard to understand code needing attention from leadership as the pipeline might be slowed down.
The two code throughput metrics are:
- Pull Requests Merged — Here, there is no prescriptive measure. Rather, it is a trend that should be monitored. If it starts lowering, perhaps the development team is stuck or has too big of a project. If it starts rising, that is generally considered a good thing, as Pull Requests are likely small and easy to process.
- Deployment Frequency — This is a DORA Metric (which are usually tracked at the executive level) but the measure can also be useful at the repository level. If a repository is being released less weekly, then it indicates features building up that increase the feedback loop for the development team. It also indicates that deployments can get large, and failures become harder to track.
A dashboard such as this one provides a clear look into an individual repository, allowing you to ensure that the code therein is of high quality, being properly reviewed, and moving along quickly into the hands of customers.
Leveling Up Your Development Pipeline
Whether you are a Development Lead or a CTO/VP of Engineering, or if you are concerned with high-level, team-level, or repo-level metrics, LinearB can provide you with the information and insight you need to make sound decisions about your software development process.
Our tool lets you recognize that there is a problem, dig in to find where the problem originates, and take the necessary steps to correct things. If you are not already using LinearB and want to do things like see exactly what is going on in your organization, team, or repository, sign up for a free demo of the product today! Our produce is free to use for teams of eight or less, so get started with a demo today!


