In a world of self-driving cars and A.I., insurance is probably the last industry you think about when someone says “modern technology.” But as a newly minted unicorn in the startup world, Hippo is changing the old narrative by not just focusing on software engineering expertise and customer service to impress their customers. Instead, they’ve also intentionally focused on customer experience: you can buy a policy online in just five minutes. They also use their platform to make sure customers get the right amount of coverage year after year. Their “total home protection” offering combines smart home device tech with a proactive home care app to help homeowners prevent problems before they start.
Pushing an entire industry into the modern world is no easy task, though; it takes a significant development effort and a robust technology stack to make sure everything runs smoothly. That’s where Mike Gordon, the VP of Engineering at Hippo Insurance, comes in. We spoke to him about how he’s been using LinearB for a data-driven approach to driving productivity within his engineering organization.
Give teams planning insights
“You have to crack Jira reports like a riddle to gain insights.”
– Team Leader, Rapid7
Having the right data about how much time you spend on projects is vital if you want to make sure everything gets done. That means individual teams need access to this information if they’re going to improve. That’s why Hippo focuses on giving those teams the key “story points” that’ll help them figure out how much capacity they have for the next sprint.
“Let’s just assume a day is a story point: plan seven of them and leave three unplanned. Because those three unplanned always happen,” Mike explains. “They’re either tech debt, or product is asking for something new, or you’re spending a whole extra day debugging something that should take two hours. That’s another thing our teams look at.”
Having the ability to see historic sprint planning accuracy, your teams will be able to more accurately estimate how many story points a specific task should take. And this means that your teams get a much more accurate picture around their productivity and areas for improvement.
Help leaders predict their productivity
On the other hand, team leaders and upper management need to see an overview of all their teams. With this information, you can find specific trends to see whether it’s an underlying issue with your process or whether a specific team is struggling.
“I’m mostly looking at these metrics for our overall productivity,” Mike says. “What is our OKR completion? What are our scores over time? And also, what is our PR merge productivity on our entire team and then different groups and areas over time?”
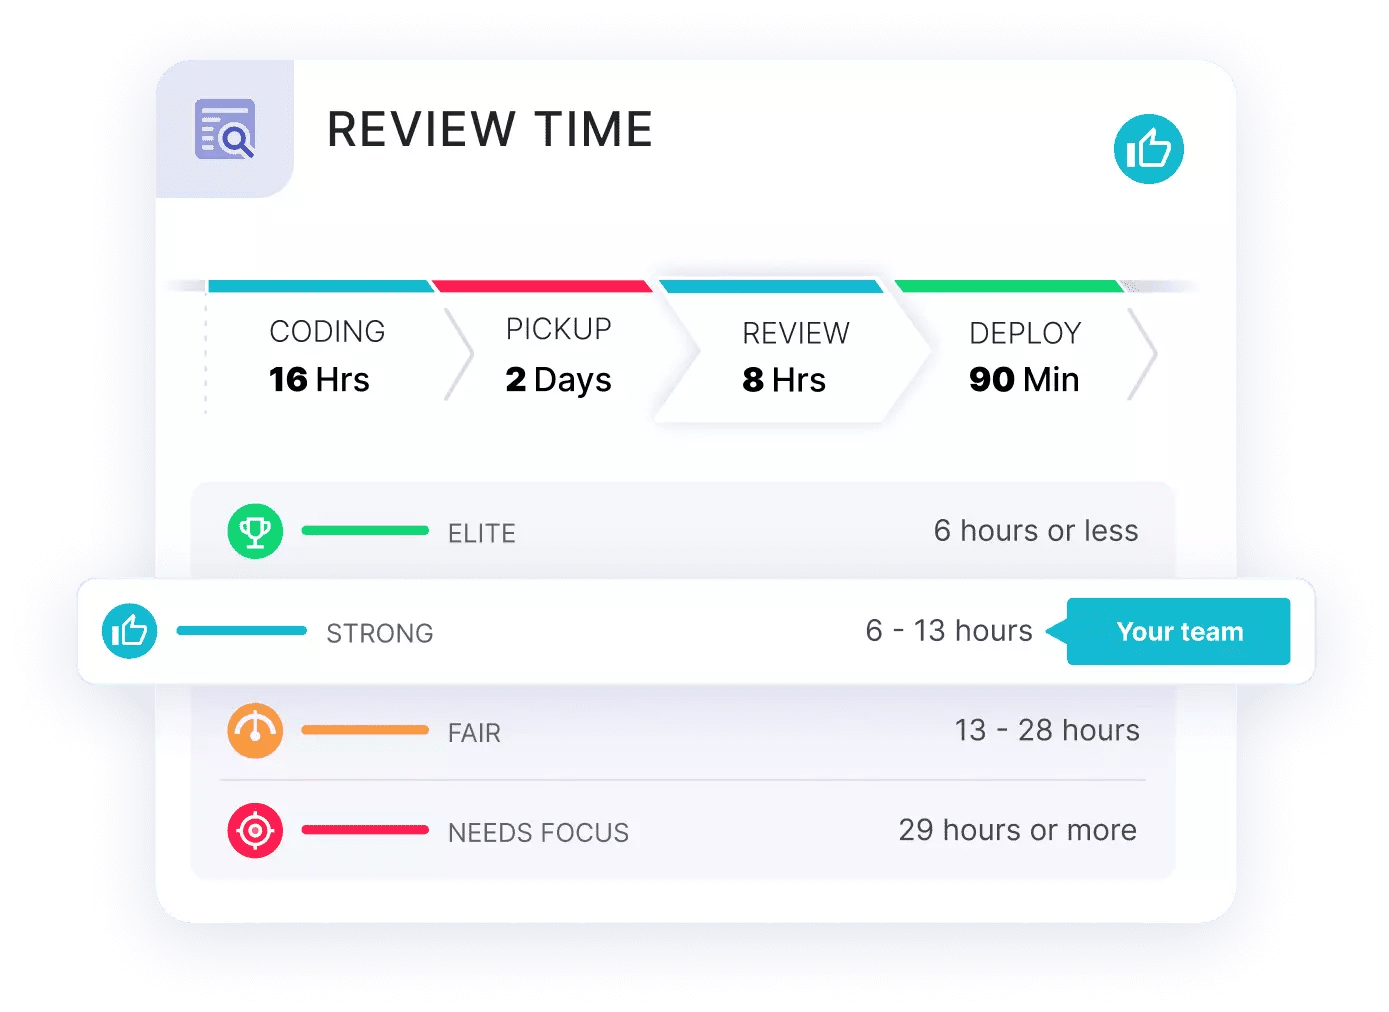
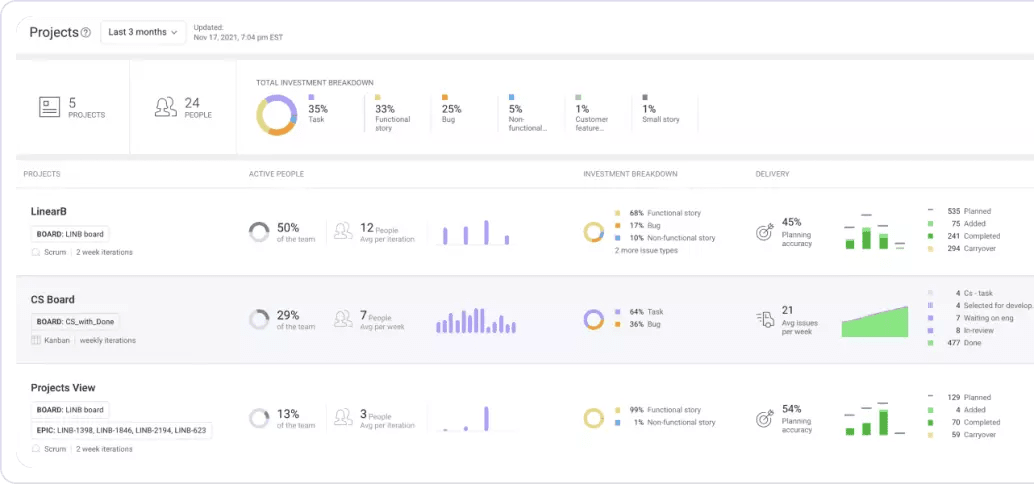
Those higher-level metrics, like cycle time, review time, and pickup time, help upper management make more accurate predictions on a sprint by sprint basis. Hippo integrated LinearB’s Project Delivery Tracker directly into their platform project review to see how they’re doing against their sprint plans. They then look at the results every two weeks to see whether they need to make any adjustments or push back any deadlines. This even helps Hippo scale the business by seeing when they need to add new team members.
“It gives us an indicator of how we’re distributing our people and work and teams. And to understand where we might need to add someone to a team or to take someone away,” Mike says.
Learn from your best teams
Productivity isn’t just about day-to-day planning. If you have one team that’s doing particularly well, you want all your teams to follow suit. Using LinearB, you can spot those high-performing teams, look into their success and improvement, and encourage other teams to model that behavior.
“I’m going to use that in a variety of ways. One is to figure out how do I form teams, maybe get that team to share some of their methods with other teams,” Mike explains. “You can really see that show through in the metrics.”
It can also help you form an investment profile. Where should you be investing your time and efforts? Using the Project Delivery Tracker’s investment profile breakdown, you can figure out how much time you’re spending on tech debt and bugs vs. developing your product and delivering features. This breakdown helps teams prioritize their work and focus on what matters most.
“By using some of the metrics in LinearB to classify our work a little bit better, I’ll be able to get some idea of how we’re doing there and where we might need to change,” Mike adds.
Improve your own productivity
If you’d like to see the same sort of successes as Hippo by optimizing where you’re investing time and resources, identifying process bottlenecks, and finding elite team behavior to model check out LinearB and Project Delivery Tracker.