# 3 Useful JIRA Analytics Integrations | LinearB Blog

> Jira analytics tell you how well your development team is doing. Here are three of the best integrations, and the metrics you should for.

_This is a markdown rendering of a live HTML page on linearb.io, generated for AI/LLM consumption — it is not a markdown-only site. To get the full HTML page instead, request this URL with an explicit `Accept: text/html` header (no wildcard, no markdown preference)._


```json
{
  "@context": "https://schema.org",
  "@type": "BreadcrumbList",
  "itemListElement": [
    {
      "@type": "ListItem",
      "position": 1,
      "name": "Home",
      "item": "https://linearb.io/"
    },
    {
      "@type": "ListItem",
      "position": 2,
      "name": "Blog",
      "item": "https://linearb.io/blog"
    },
    {
      "@type": "ListItem",
      "position": 3,
      "name": "3 Useful JIRA Analytics Integrations",
      "item": "https://linearb.io/blog/jira-analytics"
    }
  ]
}
```

[Home](https://linearb.io/)

/

[Blog](https://linearb.io/blog)

/

3 Useful JIRA Analytics Integrations

# 3 Useful JIRA Analytics Integrations

![Photo of Eric Goebelbecker](https://assets.linearb.io/image/upload/c_limit,w_2560/f_auto/q_auto/v1/logo-mark-lg?_a=BAVMn6ID0)

By [Eric Goebelbecker](https://linearb.io/blog/jira-analytics#eric-goebelbecker)

|

April 16, 2021

![jira_integration_1e7d61d123](https://assets.linearb.io/image/upload/c_limit,w_2560/f_auto/q_auto/v1/jira_integration_1e7d61d123?_a=BAVMn6ID0)

Without metrics, you don’t have a handle on your software development team. Insight into what your team is working on, what the team has completed, and how your code performs in testing and production is critical to your team’s success. With the right data, you can evaluate your performance and make adjustments. Without it, you can’t improve since you don’t know where to start.

Getting valuable metrics and putting them to work isn’t always easy, though. First, you need to select the right ones. Then, you need to find the right tools for collecting analytic information and turning it into useful reports. If your team is using Jira, you’re looking for Jira analytics integrations.

In this post, we’ll discuss three of the best Jira analytic integrations. These integrations work with your Jira data and present you with metrics you can use to monitor your team’s progress and make the adjustments you need to help it improve.

Then, we’ll talk about [a few key Jira metrics](https://linearb.io/linear-b-jira-metrics) and how they can help you. Finally, we’ll wrap up with how LinearB can help you with your development metrics.

## Jira Integrations

Jira is a project management tool with a broad set of [reporting features](https://linearb.io/blog/improve-your-iterations-with-better-jira-reporting). It has built graphs, a powerful query language, and features that help you tag, sort, and categorize project artifacts. But it’s a project management system that tries to be everything to everyone. So, it’s no surprise that to get advanced Jira analytics, you’ll need to look at integrations.

![Jira is a project management tool with a broad set of reporting features. jira analytics](https://assets.linearb.io/uploads/LinearB-PQ01.png)

### Arsenale Dataplane

![Screenshot of Arsenale Dataplane](https://assets.linearb.io/uploads/arsenale_dataplane.png)

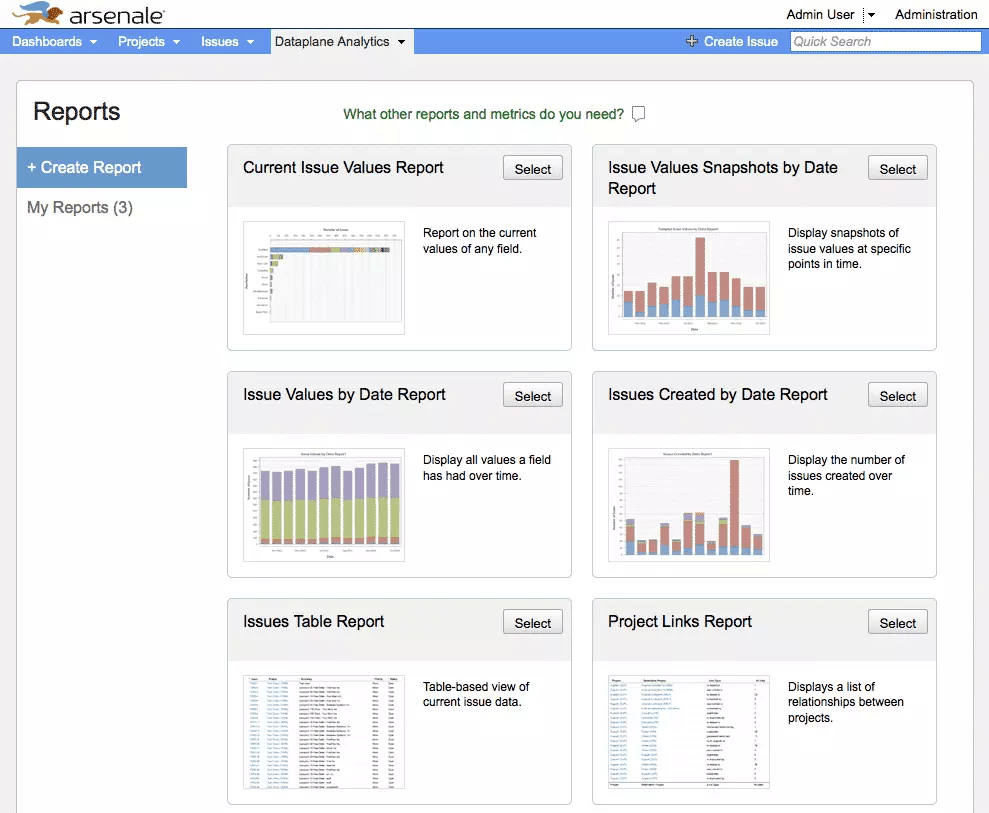
Arsenale Dataplane is a Jira plugin that adds advanced data reporting to your Jira Data Center or on-premises server. It’s not compatible with Jira Cloud. Since Dataplane integrates directly with your Jira server, it integrates well with Jira’s user security and query capabilities. Also, its reports update in real time since they operate directly on the Jira database.

Dataplane comes with an extensive set of configurable reports. They’re available “out of the box” with no configuration required, but you can adjust some simple options to suit your needs. Dataplane’s reports boast a much broader set of options than Jira’s. Dataplabne also works with Jira’s built-in filters so that the reports will integrate well with your projects and issue schemas.

### eazyBI

![Screenshot of EazyBI](https://assets.linearb.io/uploads/Jira-custom-agile-reports-dashboard.png)

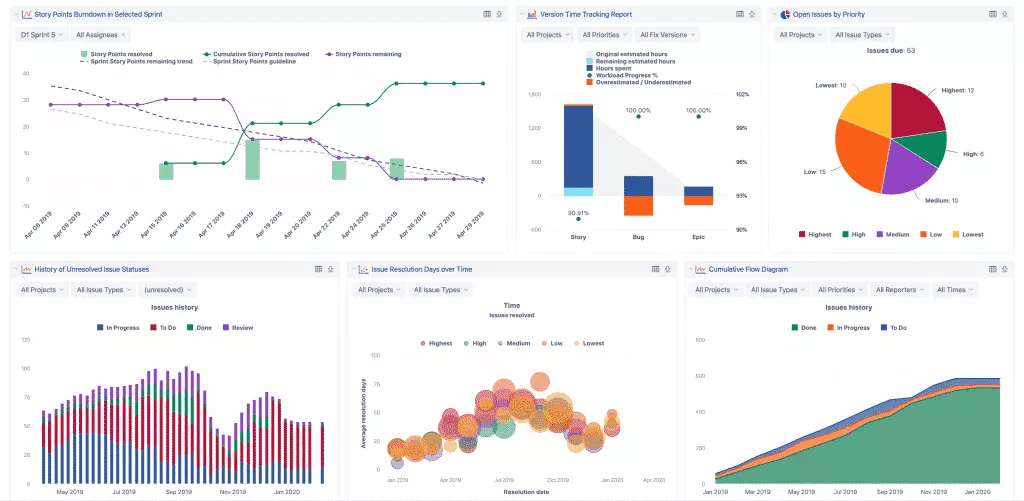
EazyBI is a Jira analytics tool for creating custom reports with data imported from a variety of sources. You can use it to work with data from Jira, Confluence, SQL, REST APIs, and many other applications. With eazyBI, you can build custom reports with an intuitive drag-and-drop interface and a powerful query language. Unlike Dataplane, eazyBI works with imported Jira data, so the reports are not live. However, eazyBI supports cloud Jira and allows you to integrate data from multiple sources into your reports.

The drag-and-drop interface makes it easy to create comprehensive reports, dashboards, and charts. You can also make gadgets to embed back onto Jira and Confluence. EazyBI comes with a large library of drop-in reports to get you started. You can customize eazyBI’s graphs and charts, or create your own, with the [MDX query language](https://mondrian.pentaho.com/documentation/mdx.php). EazyBI uses the MDX language to write their library charts, and their editor makes it easy to customize them yourself.

### Simple Reports and Timesheets for Jira
![Screenshot of Report and Timesheets](https://assets.linearb.io/uploads/simple-1024x501-1.png)

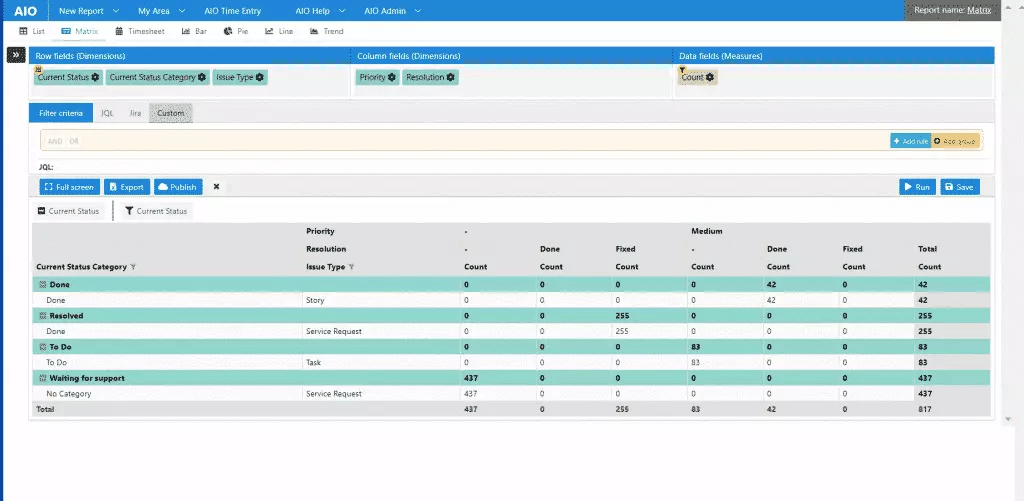
Report and Timesheets (formerly AIO Reports and Timesheets) is another drag-and-drop reporting tool for Jira. Like Dataplane, it’s a plugin that integrates directly with your Jira server. But, it works with both cloud and self-hosted Jira servers. Similar to eazyBI, you can build custom reports with its drag-and-drop interface. However, since Report and Timesheets runs on your Jira server, the reports update in real time.

This Jira analytics integration is focused on building reports for project managers and daily operations. It has specific reporting and data entry features for time reporting, including time entry and approval tools. It also includes Jira gadgets for displaying report information on your Jira dashboards. Like Dataplane, Simple Reports and Timesheets integrates tightly with Jira and works with JQL queries.

## Jira Metrics

So, there are [several options for extracting information from Jira](https://linearb.io/blog/jira-metrics). But what should you be looking for? What information is there inside your Jira system that helps you see how well your team is performing and how you can help it perform better?

### Velocity

![Screenshot of velocity](https://assets.linearb.io/uploads/Velocitychart-1024x941-1.png)

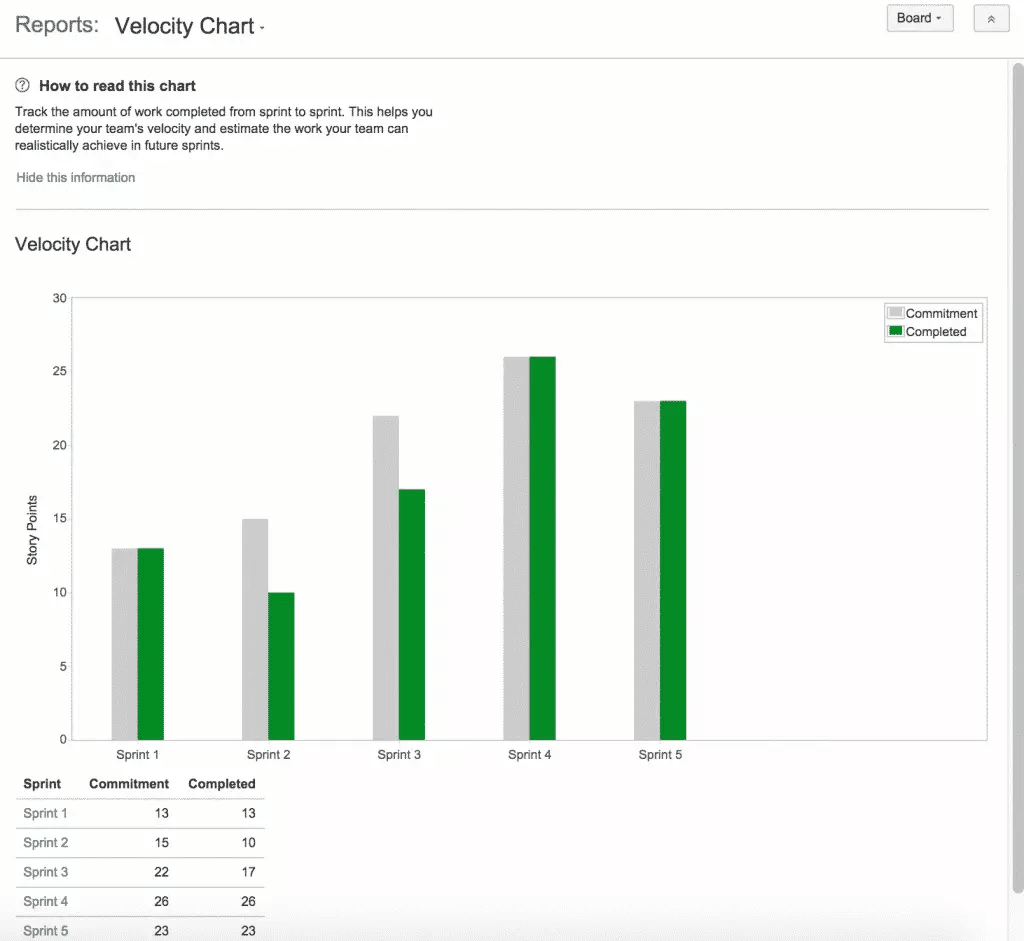
Velocity is often the first metric people talk about when they talk about Agile analytics. It’s the amount of work your team completes during a sprint or, if you’re looking at a longer horizon, an iteration. It’s the number of story points completed over a period of time.

Engineering managers often use velocity to estimate how much time is left in an iteration. For example, if there are 55 points left and the team’s velocity is 10, the project needs six more sprints. But story points are, by definition, a subjective measure of complexity.

While velocity is a popular metric, it’s [not a very good one](https://linearb.io/blog/why-agile-velocity-is-the-most-dangerous-metric-for-software-development-teams). It’s easy to misunderstand, misapply, and outright abuse velocity as a way to compare teams and measure productivity.

### Epic and Release Burndown

![Screenshot of Epic and Release Burndown](https://assets.linearb.io/uploads/screenshot_JSW_Classic_Epic-Burndown_Final-1024x540-1.png)

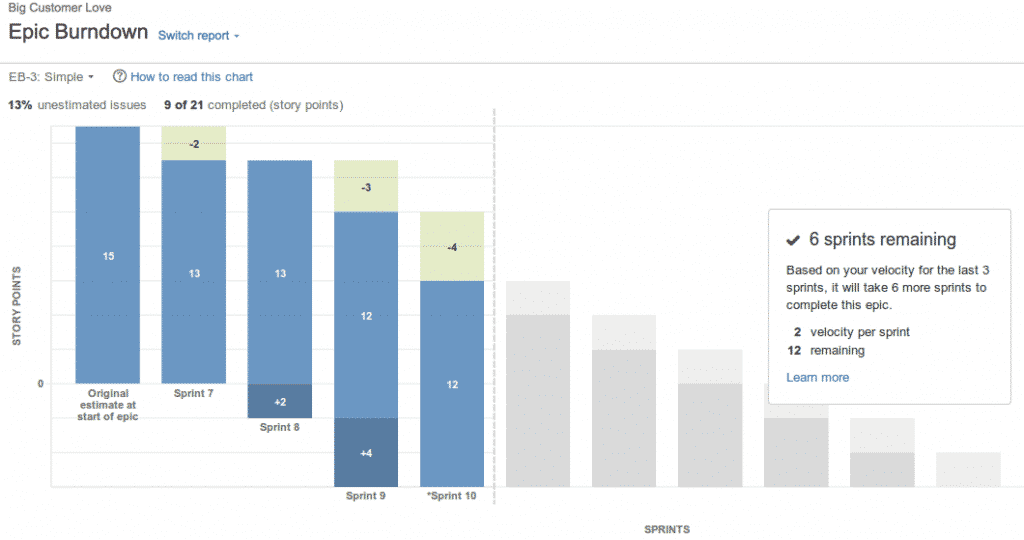
If you’ve been using Jira to run agile projects, you’ve problem seen a burndown chart. Similar to velocity, burndown measures story points against time, and it comes with the same caveats. Story points are subjective and not a good basis for comparing teams to each other.

But burndown can still be an effective way to measure an individual team’s progress on a project, especially when you look at epics and releases instead of sprints. As time goes by, the number of open story points should decrease. If they don’t, your team has a problem. Maybe day-to-day tasks are getting in the way of productivity. Or, maybe scope creep is adding story points faster than the team can address them.

### Defects

How many defects does your team have open? Is the count growing with each release? Is it decreasing or remaining constant? Defects are an important measure. They don’t just tell you how much work your team has to get done—they’re a measure of quality and process, too. If your team isn’t able to capture and execute on requirements, defects will grow. Moreover, if your team members are working too fast, they’ll create new defects with each release.

### Release and Deployment Frequency

How often your team ships code is a fundamental data point for your team’s success and productivity. If your team isn’t delivering value on a regular basis, it’s not successful. A drop in frequency for deployments or releases can be a valuable leading indicator if your team is having problems.

![A drop in frequency for deployments or releases can be a valuable leading indicator if your team is having problems. jira analytics](https://assets.linearb.io/uploads/LinearB-PQ02.png)

## LinearB and Development Team Metrics

The three Jira analytics integrations we discussed are powerful tools that make Jira better they aren’t the only options. [LinearB has a way to get better metrics from your engineering team.](https://linearb.io/dev-team-metrics) It integrates with developers where they work instead of forcing them to provide your project management tools with asynchronous updates.

Engineering analytics should incorporate data from engineering tools, like source control, not solely rely on project management tools like Jira. LinearB can tell you about cycle time, which is a measure of how long it takes your team to produce a release after the first commit is made. It can tell you what your team’s rework ratio is, too. That’s a measure of how much of your code needs to be rewritten within a few weeks of being merged.

Get started with [LinearB](https://app.blog.linearb.io/register). It’s a tool designed to help development teams continuously improve their software delivery process.

## Improve developer productivity with LinearB

Find us on

[](https://www.linkedin.com/company/linearb)
[](https://devinterrupted.substack.com/)

## Your next read

[![Cover image for Your software factory needs a context layer](https://assets.linearb.io/image/upload/c_limit,w_2560/f_auto/q_auto/v1/unnamed_4_b35455ae7a?_a=BAVMn6ID0)](https://linearb.io/blog/software-factory-2026-ai-benchmarks-code-review-roi)

Eng. Metrics

[Your software factory needs a context layer](https://linearb.io/blog/software-factory-2026-ai-benchmarks-code-review-roi)

Data from 2.7 million pull requests across 253 engineering organizations shows a widening gap between developers using AI deeply and everyone else. An adoption...

[![Cover image for AI agents are killing the pull request and reinventing CI/CD](https://assets.linearb.io/image/upload/c_limit,w_2560/f_auto/q_auto/v1/Blog_Post_Name_2400x1256_5_496cdfde2d?_a=BAVMn6ID0)](https://linearb.io/blog/circleci-rob-zuber-ai-agents-pull-request-cicd-sdlc)

Eng. Metrics

[AI agents are killing the pull request and reinventing CI/CD](https://linearb.io/blog/circleci-rob-zuber-ai-agents-pull-request-cicd-sdlc)

CircleCI CTO Rob Zuber explains why AI adoption is killing the pull request and forcing engineering teams to completely reimagine the software development...

[![Cover image for AI ROI comes from measuring engineering outcomes on day one](https://assets.linearb.io/image/upload/c_limit,w_2560/f_auto/q_auto/v1/Blog_AI_ROI_comes_from_measuring_engineering_software_security_2400x1256_2c5eae0862?_a=BAVMn6ID0)](https://linearb.io/blog/kraken-nik-sudan-measure-ai-roi-engineering-outcomes)

Eng. Metrics

[AI ROI comes from measuring engineering outcomes on day one](https://linearb.io/blog/kraken-nik-sudan-measure-ai-roi-engineering-outcomes)

Kraken Engineering Operations Lead Nik Sudan details how to establish day-one data infrastructure to accurately measure AI ROI. Discover why raw token adoption...

## Structured data

_Machine-readable metadata (JSON-LD) embedded in the page for search/AI context — not content rendered on the page itself._

```json
{
  "@context": "https://schema.org",
  "@type": "Organization",
  "name": "LinearB",
  "url": "https://linearb.io/",
  "logo": "https://assets.linearb.io/image/upload/v1715628027/logo-mark-lg.svg",
  "description": "LinearB is the engineering productivity platform that helps engineering leaders prove AI is improving throughput without sacrificing delivery confidence, flow efficiency, or developer experience.",
  "sameAs": [
    "https://www.linkedin.com/company/linearb"
  ],
  "award": [
    {
      "@type": "Award",
      "name": "LinearB is a Leader in the 2026 Gartner® Magic Quadrant™ for Developer Productivity Insight Platforms",
      "dateAwarded": "2026",
      "awardedBy": {
        "@type": "Organization",
        "name": "Gartner®"
      }
    },
    {
      "@type": "Award",
      "name": "Great Place to Work Certification",
      "dateAwarded": "2025-2027",
      "awardedBy": {
        "@type": "Organization",
        "name": "Great Place to Work"
      }
    },
    {
      "@type": "Award",
      "name": "America's Best Startup Employers 2025",
      "dateAwarded": "2025",
      "awardedBy": {
        "@type": "Organization",
        "name": "Forbes Magazine"
      }
    }
  ],
  "hasCertification": [
    {
      "@type": "Certification",
      "name": "SOC 1 Type 2"
    },
    {
      "@type": "Certification",
      "name": "SOC 2 Type 2"
    },
    {
      "@type": "Certification",
      "name": "GDPR Compliance certification"
    },
    {
      "@type": "Certification",
      "name": "ISO 27001"
    }
  ]
}
```

```json
{
  "@context": "https://schema.org",
  "@type": "Article",
  "headline": "3 Useful JIRA Analytics Integrations",
  "url": "https://linearb.io/blog/jira-analytics",
  "author": {
    "@type": "Person",
    "name": "Eric Goebelbecker"
  },
  "datePublished": "2021-04-16T18:47:00.000Z",
  "dateModified": "2021-04-16T18:47:00.000Z",
  "image": "https://assets.linearb.io/image/upload/v1720000000/jira_integration_1e7d61d123.jpeg",
  "publisher": {
    "@type": "Organization",
    "name": "LinearB",
    "logo": "https://assets.linearb.io/image/upload/v1777485755/linearb-logo-2026.png"
  },
  "description": "Jira analytics tell you how well your development team is doing. Here are three of the best integrations, and the metrics you should for.\n"
}
```

## More on linearb.io

### Top navigation

- [Book a Demo](https://linearb.io/book-a-demo)
- [AI Code Reviews — Catch security risks, bugs, and spec mismatches](https://linearb.io/platform/ai-code-reviews)
- [AI & Productivity Insights — See how AI tools affect cycle time and delivery speed](https://linearb.io/platform/ai-developer-productivity-insights)
- [Measure AI Impact — Track AI adoption and tie it to delivery outcomes](https://linearb.io/use-case/measure-ai-impact)
- [MCP Server — Chat with your data to spot patterns and boost output](https://linearb.io/platform/mcp-server)
- [Resource Allocation — Cost initiatives and shape your investment strategy](https://linearb.io/platform/resource-allocation)
- [Cost Capitalization — Capitalize engineering costs with audit-ready reports](https://linearb.io/platform/cost-capitalization)
- [Dev Team Management — Set targets and tie throughput to business outcomes](https://linearb.io/platform/goals-and-reporting)
- [DevOps Workflow Automation — Policy-based PR routing, approvals, and tests](https://linearb.io/platform/ai-workflow-governance)
- [AI Powered Support — Unify AI and human code delivery in one clear view](https://linearb.io/use-case/ai-powered-support)
- [Optimization — Surface friction with feedback and MCP insights](https://linearb.io/platform/developer-experience)
- [Reporting — Spot what's working and what needs attention](https://linearb.io/use-case/measuring-developer-experience)
- [Surveys — Turn developer feedback into actionable signals](https://linearb.io/platform/developer-surveys)
- [Platform overview](https://linearb.io/platform/overview)
- [Watch now](https://linearb.io/resources/engineering-productivity-gap)
- [Customers](https://linearb.io/customers)
- [Pricing](https://linearb.io/pricing)
- [Why choose LinearB — Explore your data. Measure performance. Act to improve it.](https://linearb.io/why-linearb)
- [APEX framework — The operating model for AI-era engineering teams](https://linearb.io/resources/apex-framework)
- [Anti-FAQ — The questions other vendors won't answer](https://linearb.io/why-linearb/anti-faq)
- [Security — Enterprise-grade compliance and zero code access](https://linearb.io/security)
- [Build vs. buy — The hidden cost of building it yourself](https://linearb.io/resources/build-vs-buy)
- [Dev Interrupted Podcast — Conversations with engineering leaders](https://linearb.io/dev-interrupted/podcasts)
- [Reports & Guides — Deep dives on productivity and delivery](https://linearb.io/resources)
- [Webinars — Expert sessions on productivity and AI](https://linearb.io/resources?category=workshops)
- [Metrics Benchmarks — See how your engineering org stacks up](https://linearb.io/resources/software-engineering-benchmarks-report)
- [Blog — Product updates and practical insights](https://linearb.io/blog)
- [Help Center — Documentation, setup, and support](https://linearb.helpdocs.io)
- [API Docs](https://docs.linearb.io/api-overview)
- [Status](https://www.linearbstatus.com/)
- [Integrations](https://linearb.io/integrations)
- [LinearB Library](https://linearb.io/library)
- [Engineering metrics](https://linearb.io/library/engineering-metrics)
- [Platform engineering](https://linearb.io/library/platform-engineering)
- [Engineering glossary](https://linearb.io/library/engineering-glossary)
- [Developer productivity](https://linearb.io/library/developer-productivity)
- [AI in software development](https://linearb.io/library/ai-in-software-development)
- [Engineering management](https://linearb.io/library/engineering-management)
- [Developer experience](https://linearb.io/library/developer-experience)
- [DevOps](https://linearb.io/library/devops)
- [Engineering operations and the context layer](https://linearb.io/library/engineering-operations)
- [Engineering efficiency](https://linearb.io/library/engineering-efficiency)
- [Software delivery](https://linearb.io/library/software-delivery)
- [Research and data](https://linearb.io/library/engineering-benchmarks-and-research)
- [LinearB is a Leader in the 2026 Gartner® Magic Quadrant™ for Developer Productivity Insight Platforms](https://linearb.io/resources/gartner-magic-quadrant-dpi-platforms-2026)
- [Sign in](https://app.linearb.io/login)
- [Enterprise](https://linearb.io/solutions/enterprise)
- [Contact](https://linearb.io/contact-us)
- [About us](https://linearb.io/about-us)
- [Careers](https://linearb.io/careers)
- [Service agreement](https://linearb.io/services-agreement)
- [Privacy policy](https://linearb.io/privacy-policy)
- [DPA](https://linearb.io/data-processing-agreement)
- [Security FAQ](https://linearb.io/security-faq)
- [Substack](https://devinterrupted.substack.com/)

### Footer

_Additional links from the site footer, not repeated from the top navigation above._

- [GitHub](https://github.com/linear-b)
- [LinkedIn](https://www.linkedin.com/company/linearb)
- [Twitter](https://twitter.com/LinearB_Inc)