For engineering leaders striving to optimize Agile processes, tracking the right Jira metrics is key. These metrics provide insights into productivity, quality, and project predictability. In addition to empirically measuring and benchmarking engineering KPIs, the insight a holistic metrics program provides leads to better decision-making, resulting in more team productivity, better quality, and higher customer satisfaction.
But how do you choose the right metrics to focus on? There are lots of them, and they aren’t equally valuable–looking at you Velocity and Lines of Code. This is very true of one of the most popular tools in the R&D ecosystem: Jira. It’s chalked full of metrics and data, but not necessarily utility. As an example, let’s look at story points. It’s probably the most common metric in Jira, but not the most helpful at face value. Why? Because it’s easily gamed: One team’s 10 is another team’s 3.
What Are Agile Metrics?
In addition to many software engineering metrics, there are also several ways to categorize them.
So, what metrics should Agile teams use? Keep in mind that the term “Agile” usually refers to a large number of similar yet unique development methodologies.
The answer to which approach is best depends entirely on your team’s maturity, working style, collaboration skills, and other factors–like industry/vertical. As an example, a team that primarily handles bugs and/or customer RFEs will likely gravitate toward Kanban–the work always fills the queue, and they can constantly triage and prioritize accordingly.
Here are some other examples using common agile metrics:
- A Scrum team will likely find value in planning and execution metrics known as Accuracy Scores. These two metrics tell a story about a team’s ability to scope work, prioritize planned tasks, and adjust to the ebb and flow of engineering.
- A Kanban team will likely find more value in Flow and Throughput metrics as there isn’t a time-boxed iteration to plan and measure execution against. Instead working to maintain Flow consistency week-over-week and increasing gradually over time.
In this post, we’ll explore essential Jira performance metrics that can help engineering teams enhance performance and efficiency. These metrics span both Scrum and Kanban approaches to Agile.
What Are Jira Metrics?
Jira metrics leverage data from Jira Software, which is likely one of the most widely used pieces of software for development teams. These metrics help teams better understand the software development lifecycle by providing visibility into, such as software velocity and defect tracking. By monitoring these metrics, engineering leaders can improve workflows, predict delivery times, and maintain high code quality standards.
Key Jira Metrics to Track for Team Efficiency
1. Velocity
Velocity refers to how many story points a team completes over a specified time frame (like a sprint), and as the name suggests, measures how fast your team is going. Velocity is arguably the most well-known metric, not only in Jira but for Agile in general.
Software velocity is an effective metric when used in the context of a single team. By continuously measuring velocity, you get better at setting goals and sprint capacity planning. Unfortunately, many software teams routinely abuse this metric and suffer the consequences. A common mistake is using velocity to compare teams and as a performance indicator–which can damage team morale and (incorrectly) motivate developers to game the metric.
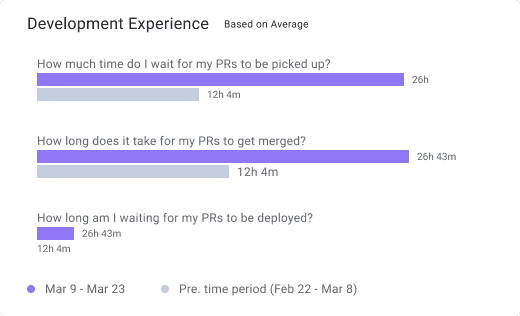
2. Cycle Time
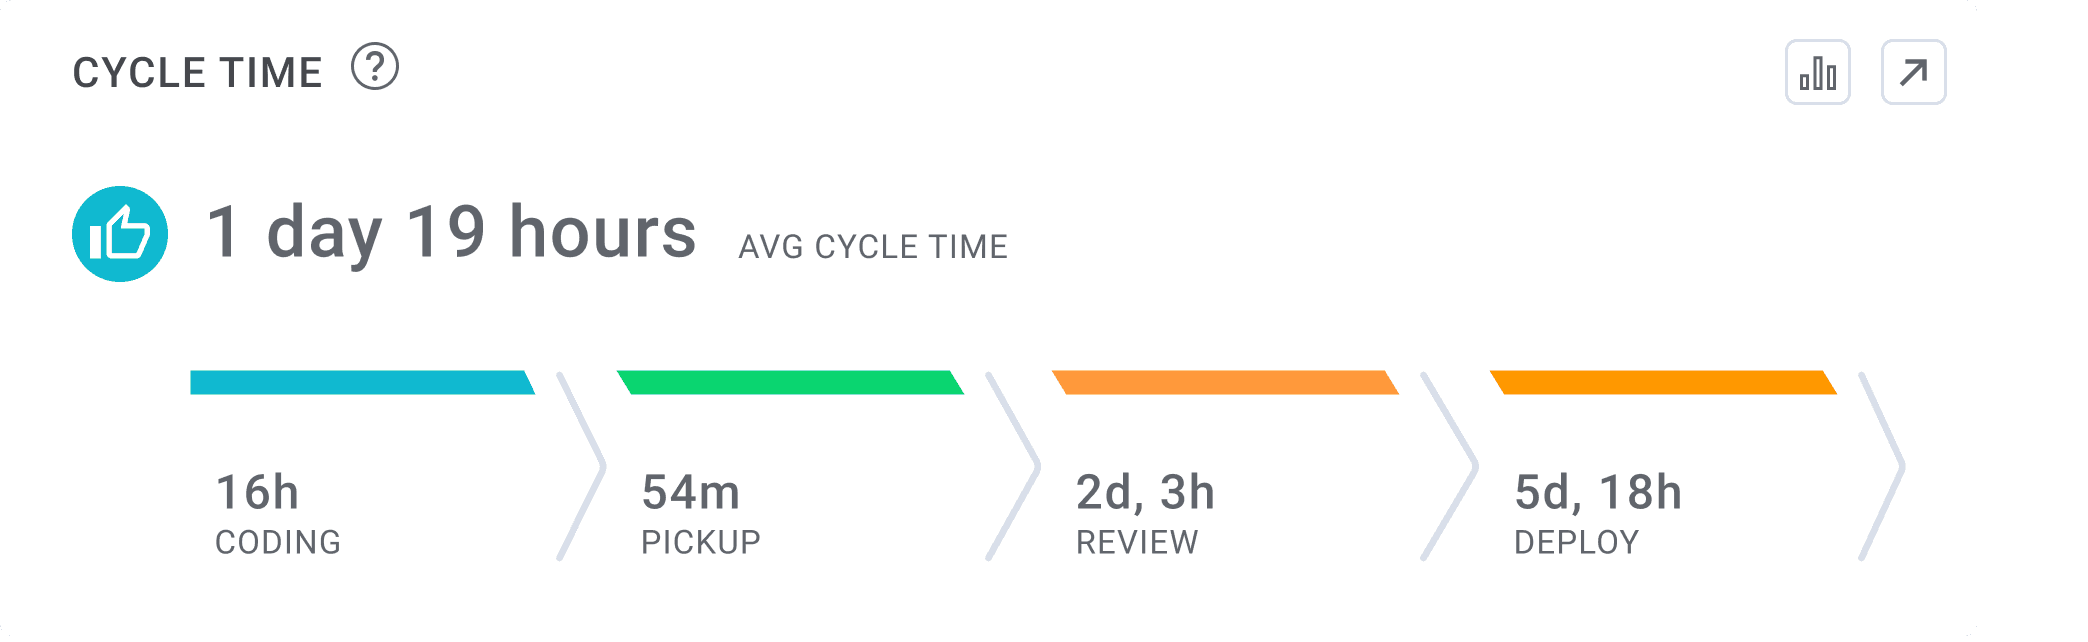
Cycle Time is the amount of time the team spends working on issues, from the start of work until the feature reaches the end-users.
Cycle time is an incredibly valuable metric because it can help you discover inefficiencies in the whole software development process. Here’s a fairly common scenario:
- A large pull request (>250 lines of code changes) is issued
- It takes longer to be picked up and reviewed because it requires dedicated time to do so
- It sits idle, and the issuer and reviewer move on to other priorities
- The cognitive load for both parties increases as time goes on as they have to reorient themselves to the work
- This all has a compounding effect on total cycle time, steadily increasing.
- This all drives efficiency and quality down, leading to higher rates of rework and code churn.
Our data science team studied the cycle time and other KPIs of over 2,000 teams and discovered the average cycle time for the developers studied was 6 days + 5 hours.
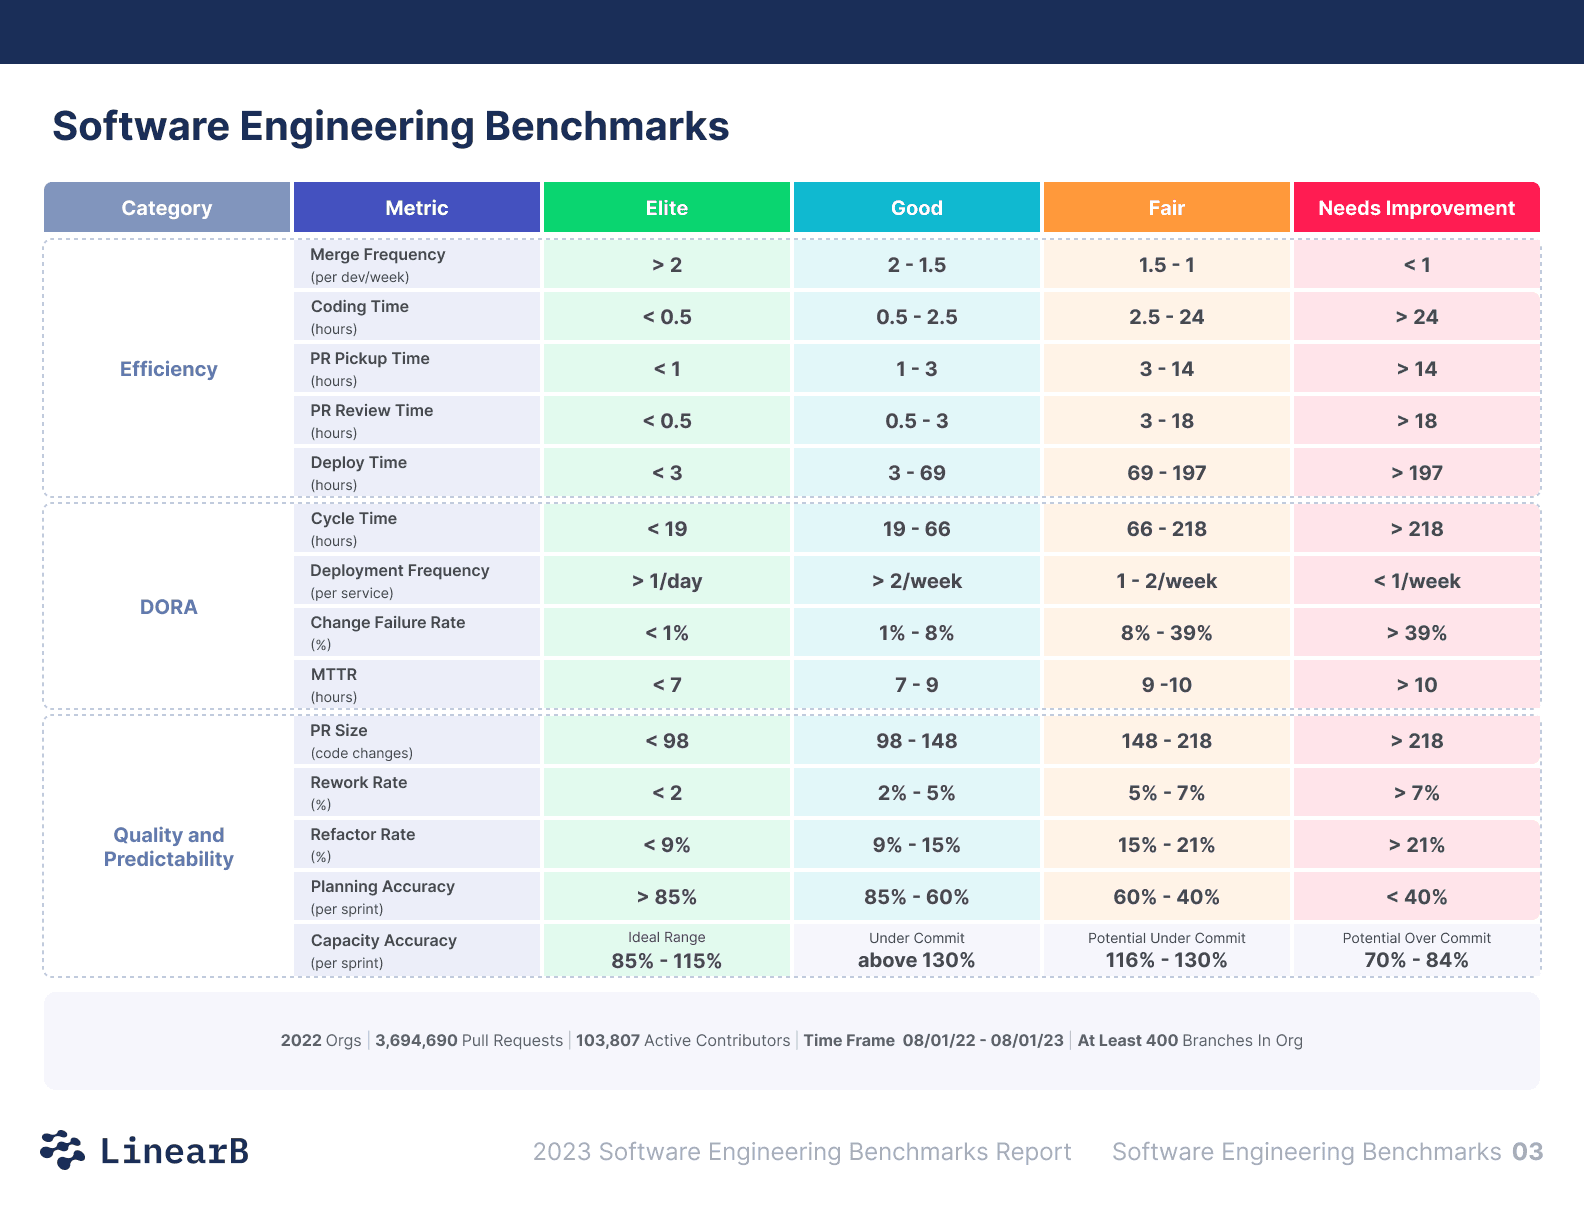
Want to learn more about being an elite engineering team? Check out our engineering benchmarks study and methodology.
A great way to reduce the burden of the PR review process, increase quality, and lower cycle time is to automate the process using programmable workflows.
3. Defect Ratio
Defect Ratio calculates the number of defects relative to completed tasks, highlighting areas where quality improvements are needed. A lower defect ratio signals a healthier code base. Using Jira capabilities, such as filters and dashboards, you can create sprint reports to depict the defect ratio of a given sprint, epic, or version.
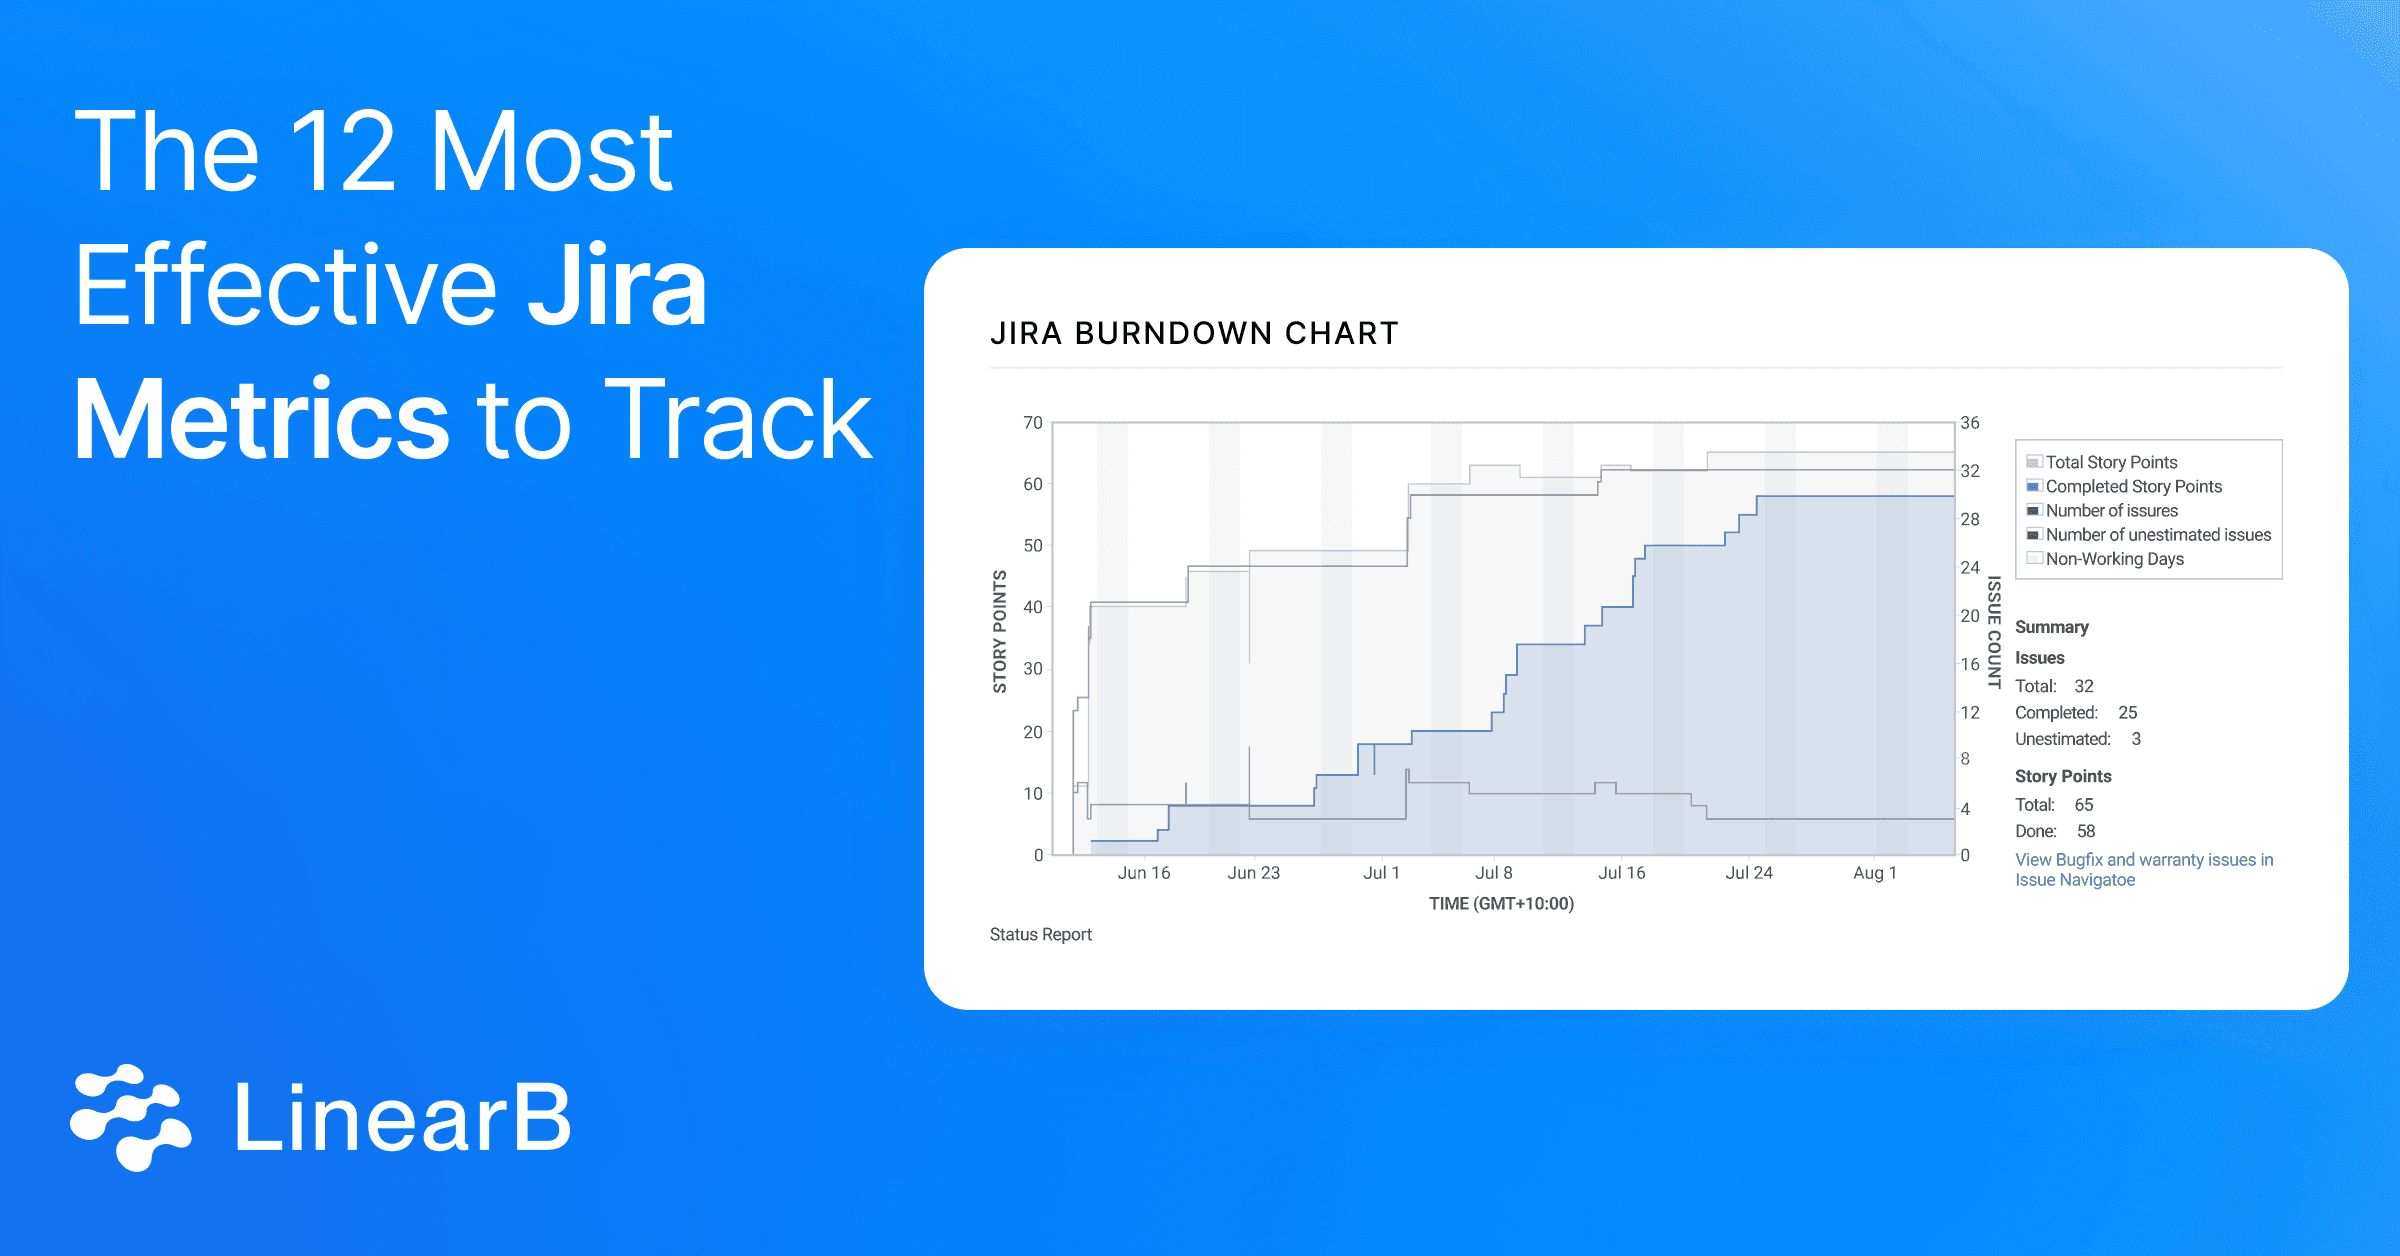
4. Sprint Burndown
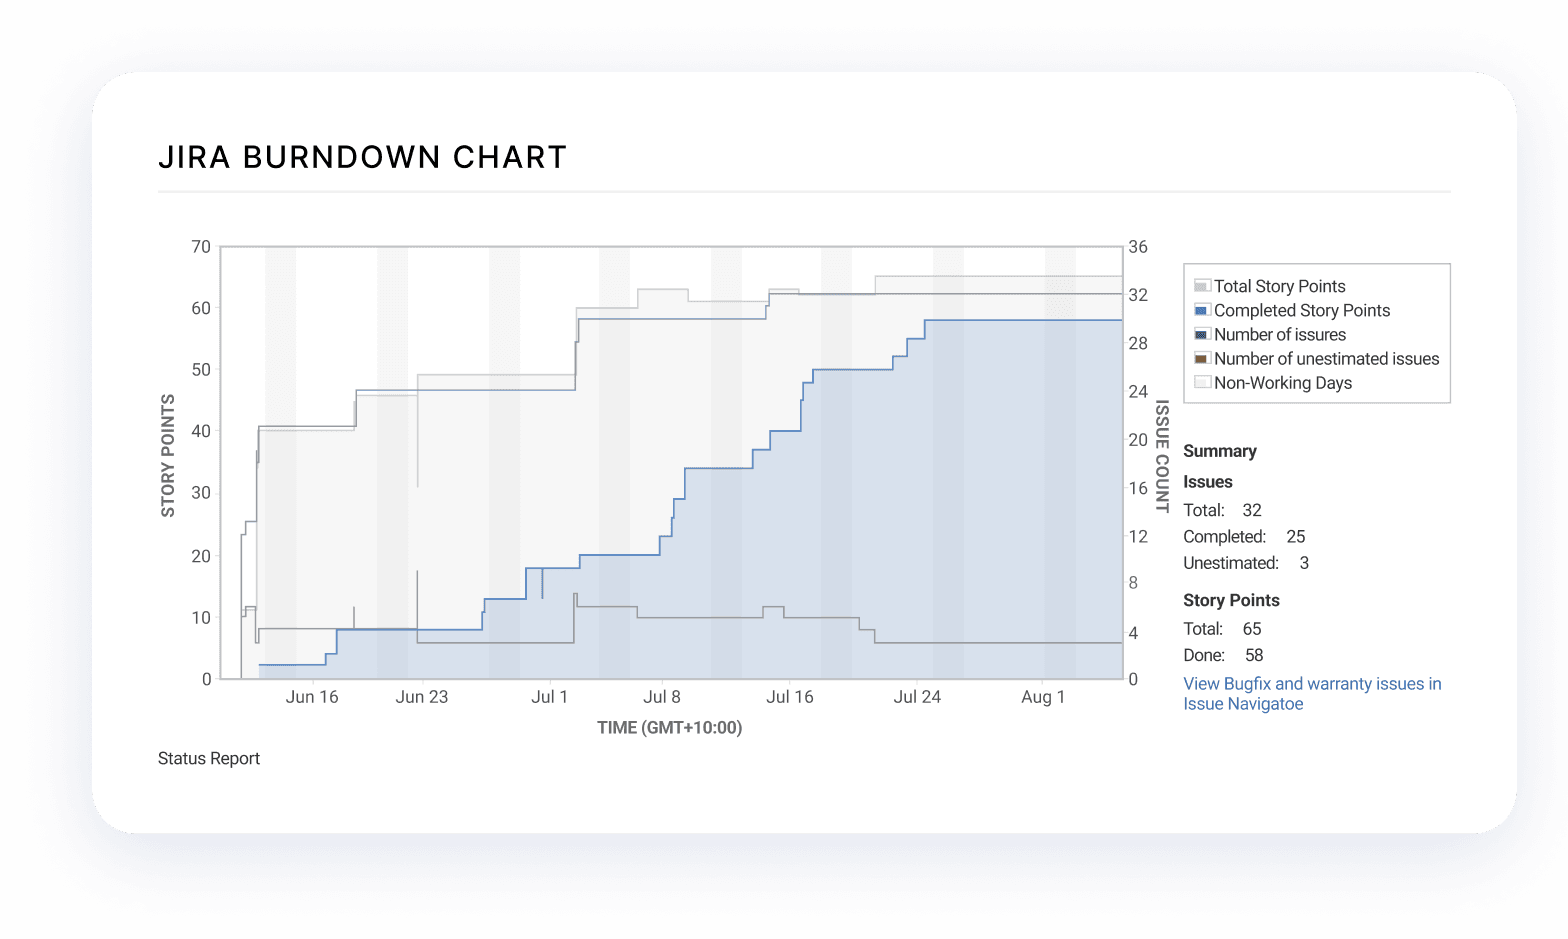
Sprint Burndown visualizes the remaining work in a sprint, enabling teams to track progress and make adjustments to stay on target. Ideally, the team should be able to finish all the work–or come very close–it has committed to finishing during the sprint.
Keeping track of the sprint burndown chart, along with other Jira sprint metrics, can help you learn important things about the team’s health and developer productivity. You might find out that the team is committing to more work than it can handle–or not taking on enough work.
Pro Tip: Be sure your teams are taking on the right amount of work. Always hitting 100% of your sprint commitments may indicate that a team needs to increase their scope of work.
In short, tracking the sprint burndown chart and evaluating how close the team was to delivering the expected work can help you diagnose and fix anti-patterns in your organization.
5. Epic Burndown
Epic Burndown tracks progress on larger, multi-sprint projects, helping teams stay aligned with long-term goals. By viewing the epic burndown chart, you can see the progress your team is making toward completing a bigger project. You can then extrapolate their speed over a longer timeline to estimate how many more sprints they’ll need to complete the epic, which assists in your planning.
6. Throughput
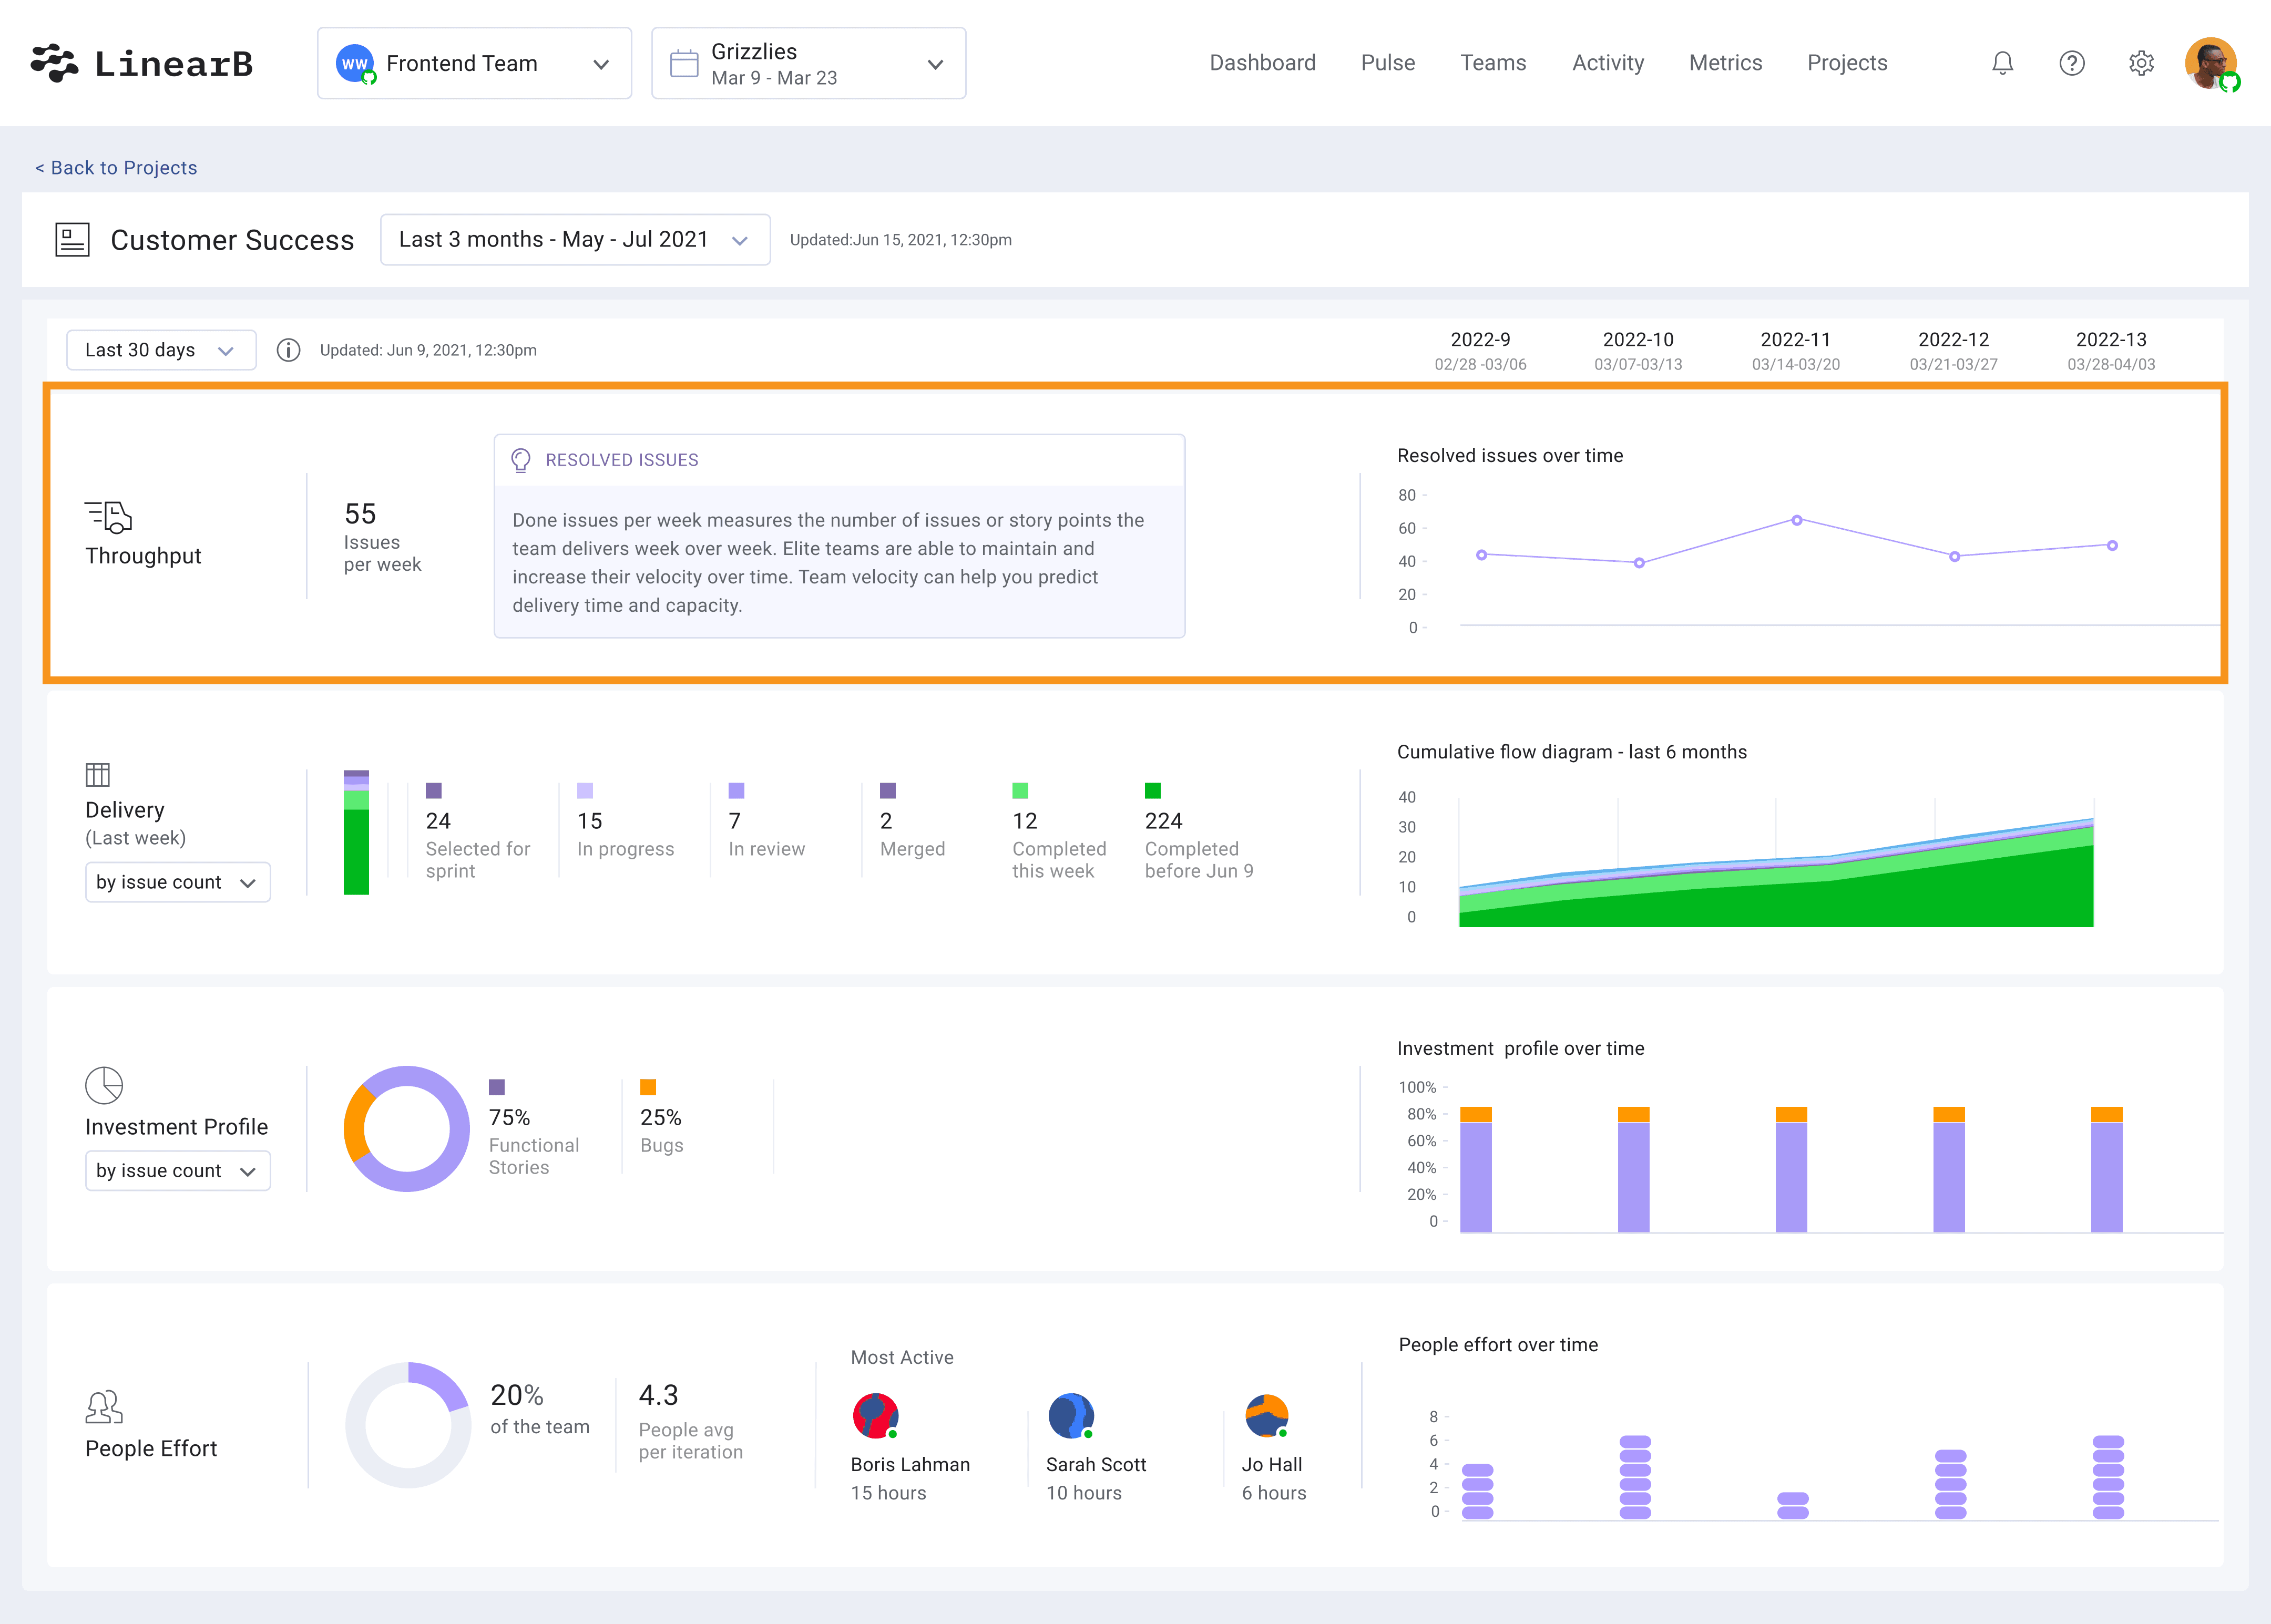
Throughput measures the number of tasks completed in a given timeframe. By monitoring throughput, leaders can gauge productivity trends and allocate resources effectively.
7. Cumulative Flow Diagram (CFD)
Cumulative Flow Diagram (CFD) is a Kanban-specific visualization that helps teams pinpoint operational inefficiencies by breaking down the flow of work through various stages. It illustrates how much time your issues spend in each phase of development/project management–like “To-do,” “In process,” and “Done.”
Organized by issue count or story points, whichever works best for you–it really answers one key question: How well is our work moving through the development pipeline? Success looks like maximizing “Done” issues and keeping “In-Progress” in check.
8. Blocked Time
Blocked time tracks the time tasks are held up due to dependencies or obstacles. Blocked Time is the result of friction in the development pipeline or issues with team collaboration. Maybe it’s too much WIP across the team, developers assigned to too many unrelated issues and tasks, or it could be as simple as things falling through the cracks. Reducing blocked time can enhance overall efficiency and improve DevEx.
Strategies for optimizing this metric include developers establishing a habit of:
- Reviewing their personal PR pipeline consistently (like every morning)
- Adopting automation to help move things along–like automatically assigning reviewers based on knowledge area/skills or adopting bot assistance for notifications
- Sharing wins and efficiency gains with the team and scaling adoption of these workflow enhancements
9. Bug Count
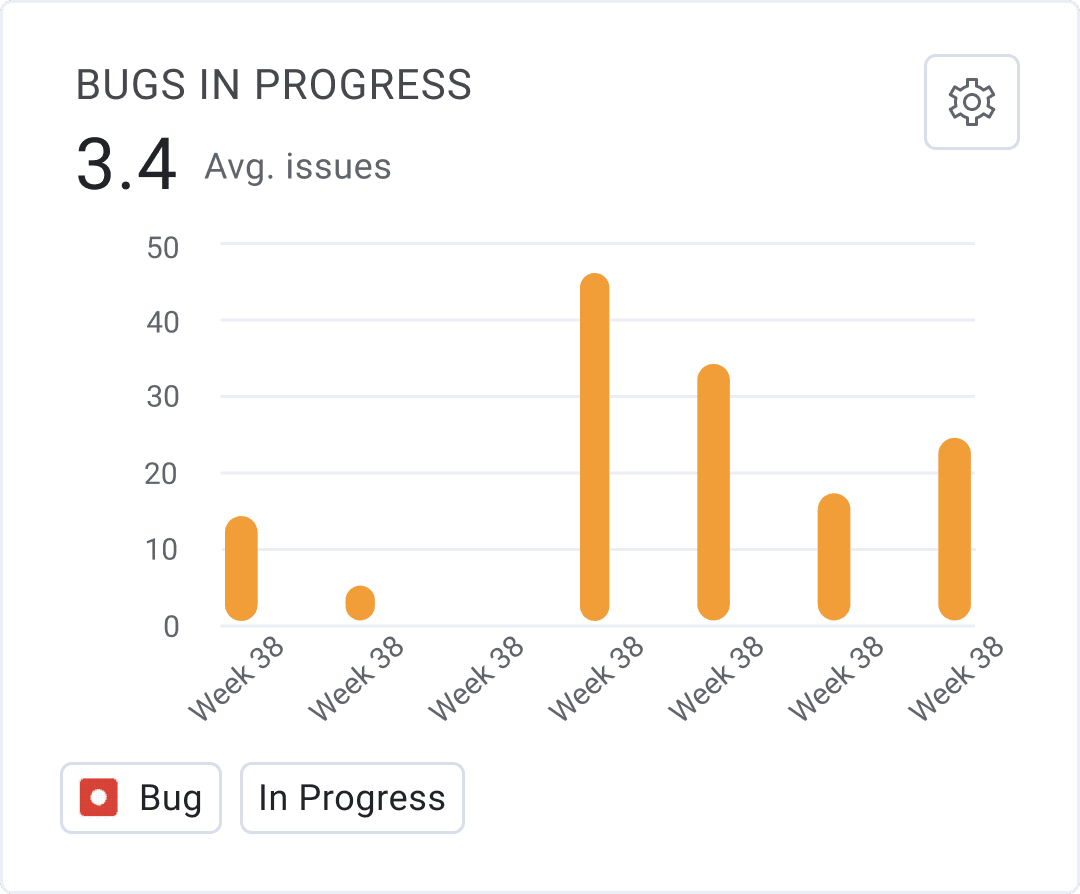
Bug count measures the total number of bugs logged over time. Closely monitoring this metric helps the team identify patterns in overall code quality, testing design, and effectiveness. If Bug Count is consistently high, teams know that corrective action needs to be taken, including redesigning tests, evaluating new tools, and adopting automation that can help with code quality.
10. Work In Progress (WIP)
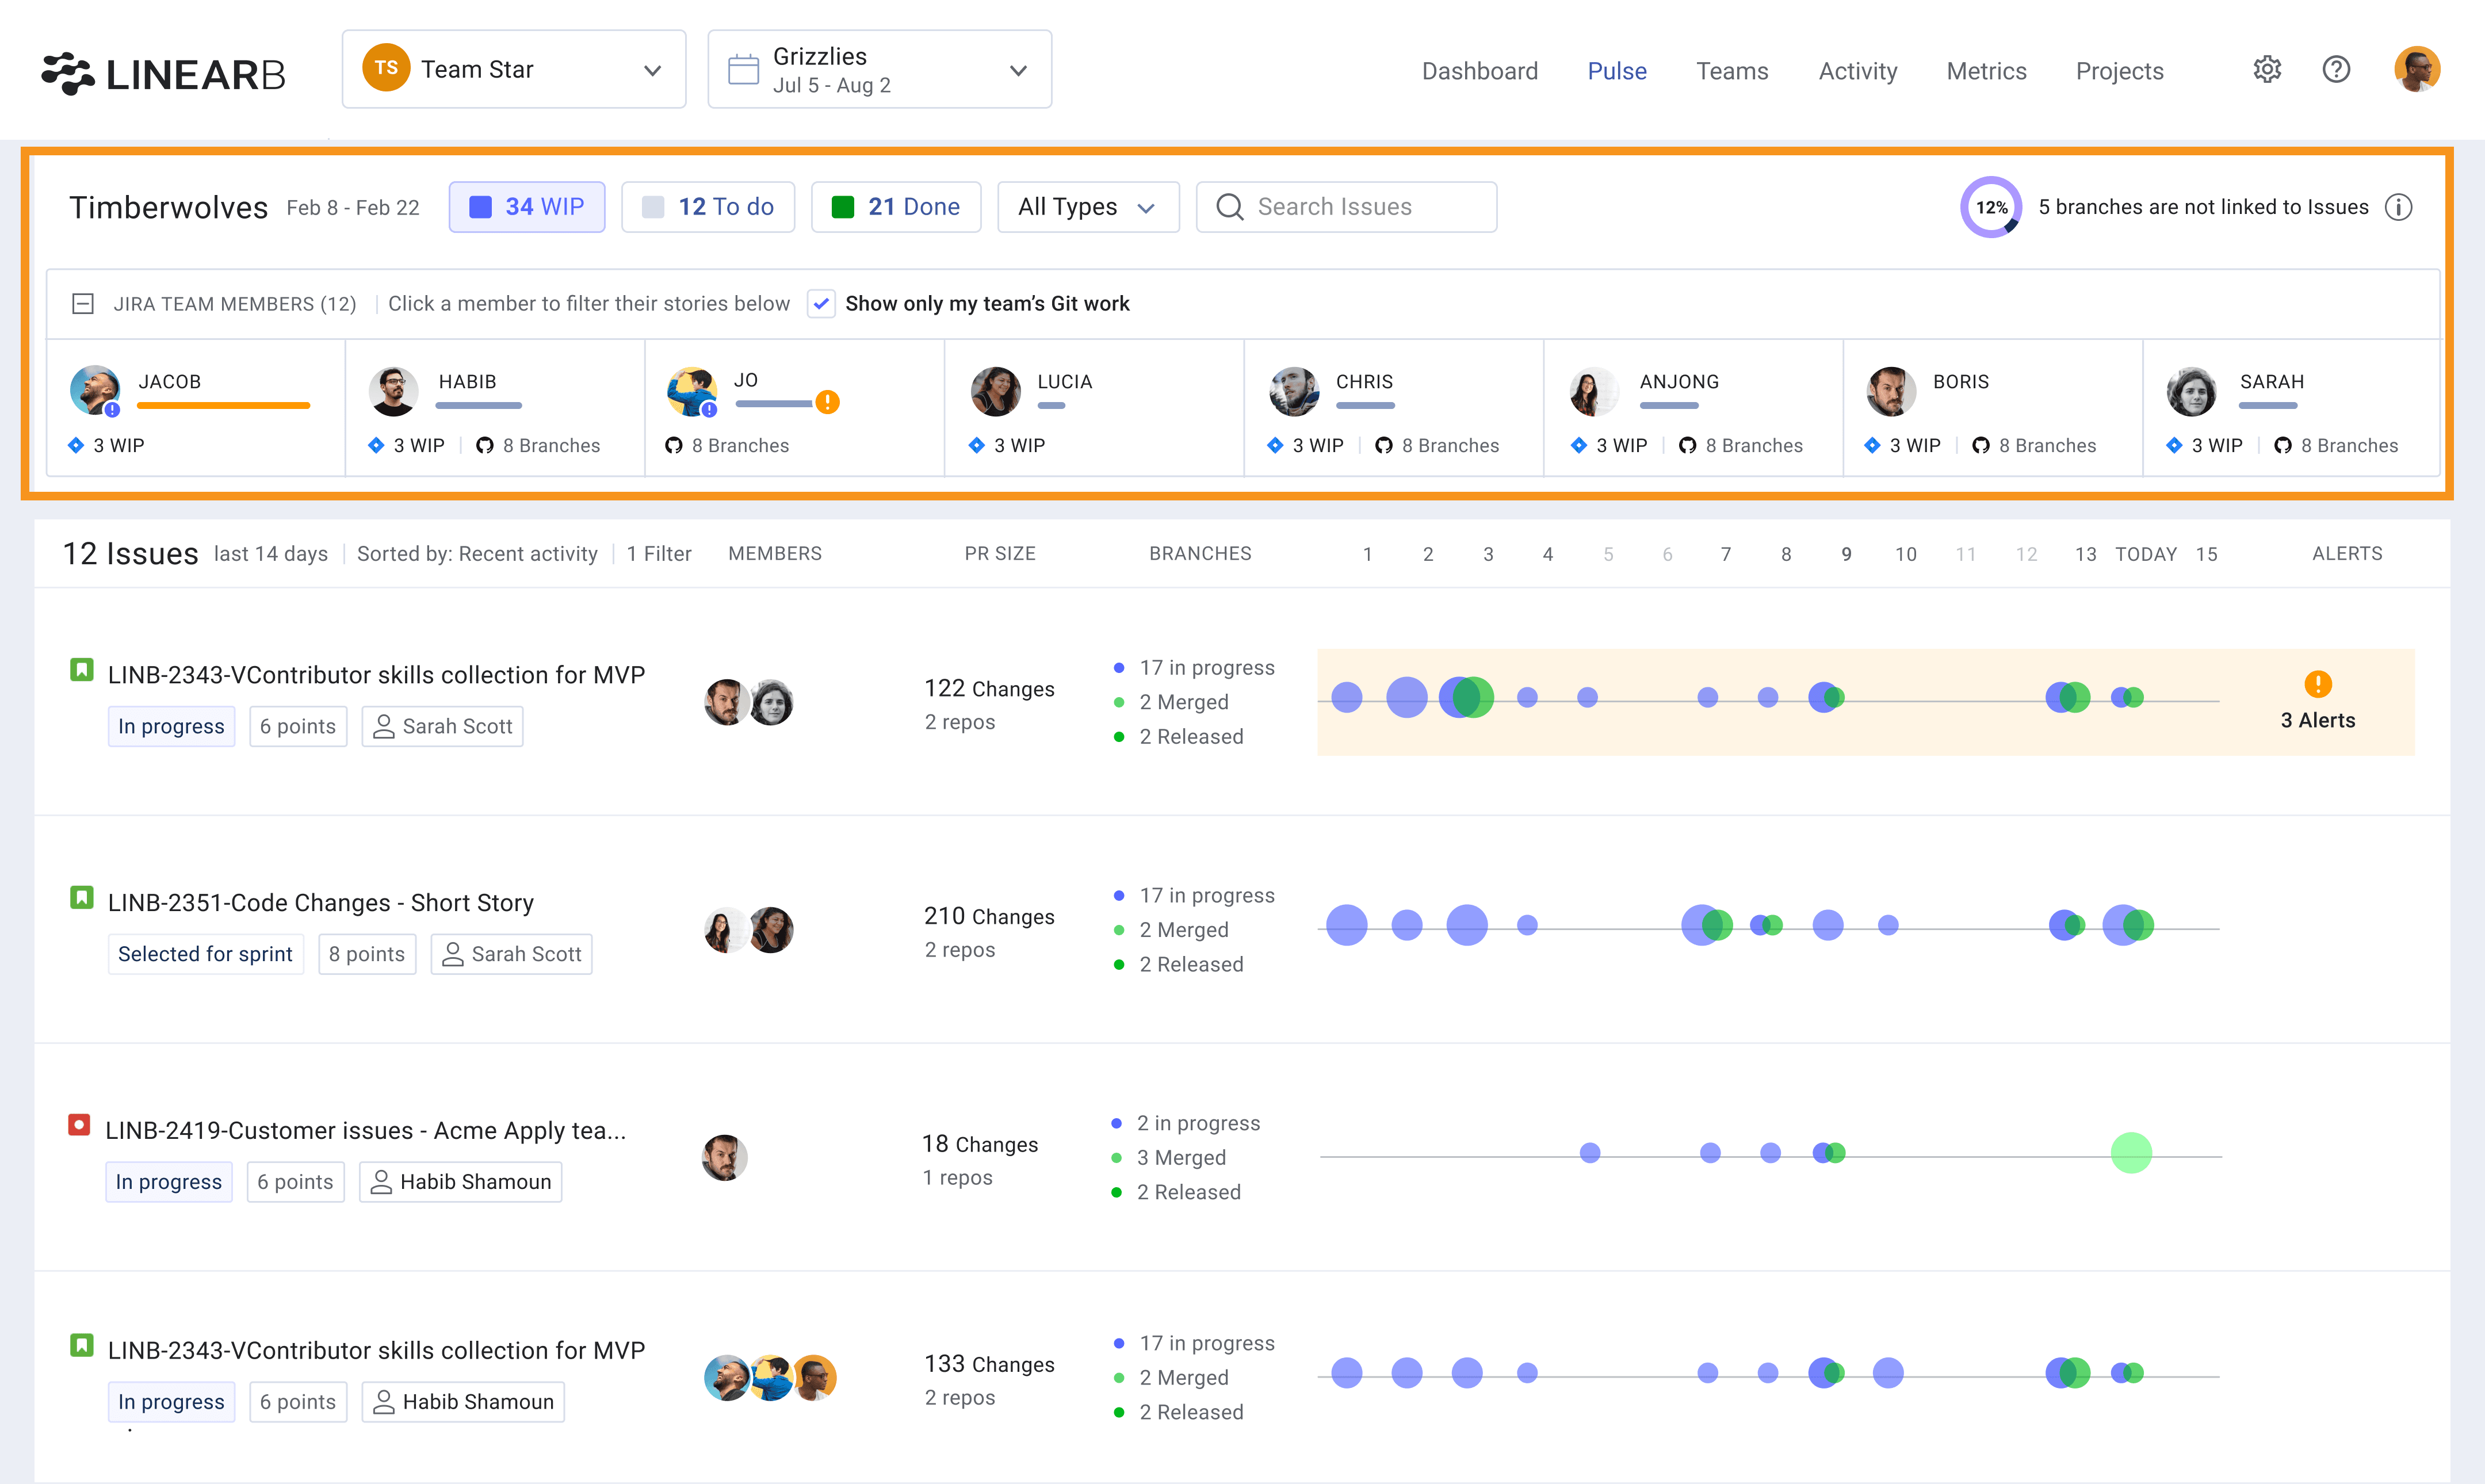
Work In Progress (WIP) counts tasks currently in progress, giving insight into capacity and potential overloading. Keeping WIP manageable helps maintain productivity and focus. Whether you operate in Scrum or Kanban, WIP should be kept in check as it is one of the main causes of cognitive overload and context switching–draining efficiency, code quality, and stability.
11. Mean Time to Resolution (MTTR)
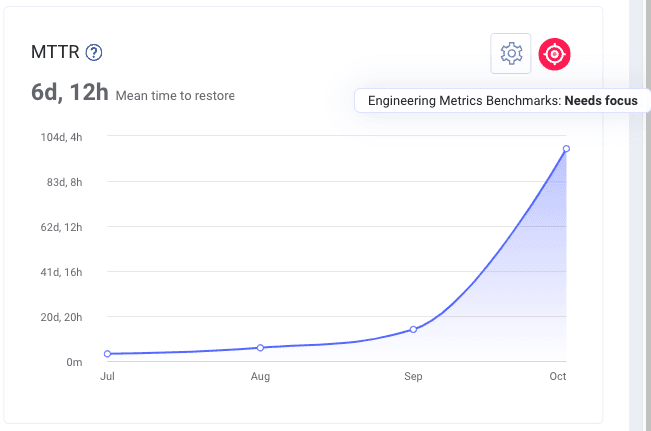
Mean Time to Resolution (MTTR) reflects the average time taken to resolve issues and restore service. A lower MTTR indicates that the team can address problems quickly, which is crucial for customer satisfaction and operational efficiency. Low MTTR also indicates a team that follows best practices–like keeping pull requests (PRs) small and limited to a single “job.”
MTTR is a lagging indicator of code stability and quality. If you want to fix a lagging indicator, you need to address the leading indicator, PR size.
Smaller PRs = Less code = Fewer chances of introducing a bug = Less service disruptions
BUT if something does go wrong…
Smaller PRs = Less code = Easier/Faster process of finding the error = Lower MTTR
12. Change Failure Rate (CFR)
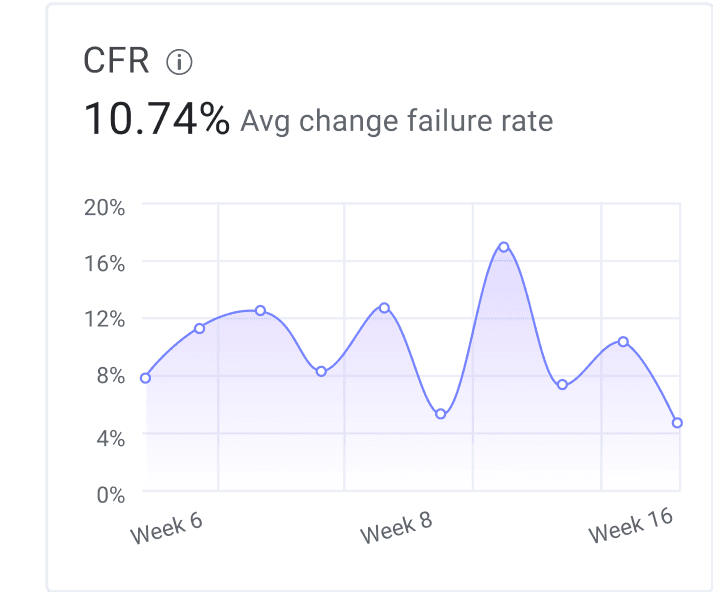
Change Failure Rate (CFR) tracks the percentage of releases that result in failures. While there isn’t an out-of-the-box Jira metric for CFR–as opposed to LinearB–a good substitute is to look at the % of tickets in a sprint that are in “Production” or “Done” states that are later moved to the “Reopened” state. By minimizing CFR, teams can improve deployment reliability and reduce rework.
How to Use Jira Metrics for Enhanced Developer Productivity
Using a combination of these Jira metrics enables engineering teams to identify areas for process improvement. Metrics like cycle time, lead time for changes, and CFR offer actionable insights to streamline development and deliver high-quality code faster. These Agile software development metrics are invaluable for leaders who aim to make data-driven decisions and ensure predictable project delivery.
However, it’s important to keep in mind that Jira metrics aren’t a panacea when it comes to measuring and working to improve your team’s performance. As you’ve seen, managers and even developers often misuse some metrics. That, in turn, might encourage developers to game the metrics, hurting team culture in the process.
Also, data from project management software like Jira can be inaccurate, and the picture you get from it might be lying to you.
Do you know what doesn’t lie? Your commits. Combining project data with statistics from your repository is a great way to maximize the benefits of your metrics–which is the inspiration for DevOps Research and Assessment (DORA) metrics. These four metrics are the closest the software development community has come to quantifying productivity.
Conclusion
For engineering leaders focused on improving team efficiency, tracking the right Jira metrics is essential. Each of these metrics provides unique insights into team performance and productivity, helping teams deliver software predictably and with higher quality. LinearB’s SEI+ platform offers tools for integrating and automating these processes to streamline and enhance metric tracking, making it easier to maintain scalable and resilient engineering operations.