The software development field is somewhat riddled with best practices that stem from no other sources than guesswork, opinions, or intuition. Which is weird for a field whose roots trace back to mathematics and the exact sciences. Because of that, software engineers and teams are always searching for objective ways to assess and improve the quality of their projects. Many would argue that there’s no better place to extract such measurements than the code itself. And since Git has become the de facto standard tool for source code management, it follows that Git statistics might be a great source of insights into the health of a software project. Right?
As it turns out, things are more complicated than that. Not all metrics or statistics bring equal value to an organization. Collecting and tracking a large number of metrics across the lifetime of a project can become an overwhelming task. Especially if you don’t know precisely why you’re doing it. It’s essential to separate the wheat from the chaff.
This post is here to help you. We’ll start by giving a general definition of Git statistics. After that, you’ll see the main reasons why Git statistics might pay off. Finally, we get to the main part of the post. You’ll learn about the seven Git stats that can give you the best bang for your buck. Before wrapping up, we offer some additional thoughts on how you can improve your Git statistics approach.
Let’s get started.
Table of Contents
- What Are Git Statistics?
- The Benefits of Tracking Git Statistics
- Git Stats: The 7 That Matter the Most
- Spice Up Your Git Statistics With Project Data
What Are Git Statistics?
Git is a version control tool first developed by Linus Torvalds, of Linux kernel fame. Due to factors like its decentralized design, its powerful branching and merging capabilities, and the success of the GitHub platform, Git quickly rose to the top and became the industry standard.
We could define Git statistics as the measurements that can be extracted from a Git repository. That wouldn’t typically include metrics about pull requests (PRs), for example, since they aren’t native features of Git but come from repository management services such as GitHub or GitLab. However, we’re talking about teams and organizations here. Therefore, services like GitHub and GitLab are important in our context since many teams adopt workflows centered around pull requests.
So the Git statistics we’ll cover here will include metrics related to pull requests because they matter in a team context.
The Benefits of Tracking Git Statistics
What are the benefits of measuring Git statistics? How do they compare to, for instance, obtaining statistics from Jira?
First, keep in mind that, all else being equal, more information is better than less information. So having metrics from different sources and being able to correlate them using a value stream management solution allows you to have a high-level view of your project.
That being said, the advantage of Git statistics compared to most other types of statistics is the fact that commits don’t lie. Version control shows the real work that has been done, by whom, and when, in a way that’s much more accurate and harder to game than tickets in a bug tracking system.

Git Stats: The 7 That Matter the Most
We’re now on the same page regarding the definition and importance of Git statistics. The next step is actually showing you examples of Git stats that really matter from the perspective of a team. Let’s get to it.
Cycle Time
Cycle time refers to how long it takes for work to be released, starting from the first Git commit.
A high cycle time value might be a red flag. It can indicate the organization’s software development pipeline isn’t as efficient as it could be. Alternatively, it could be a sign of poor communication in the organization. Engineers might be struggling to develop the features they need due to not knowing or understanding the customer’s requirements.
Cycle time can also be broken down into four phases, two of which we’ll look at more closely below.
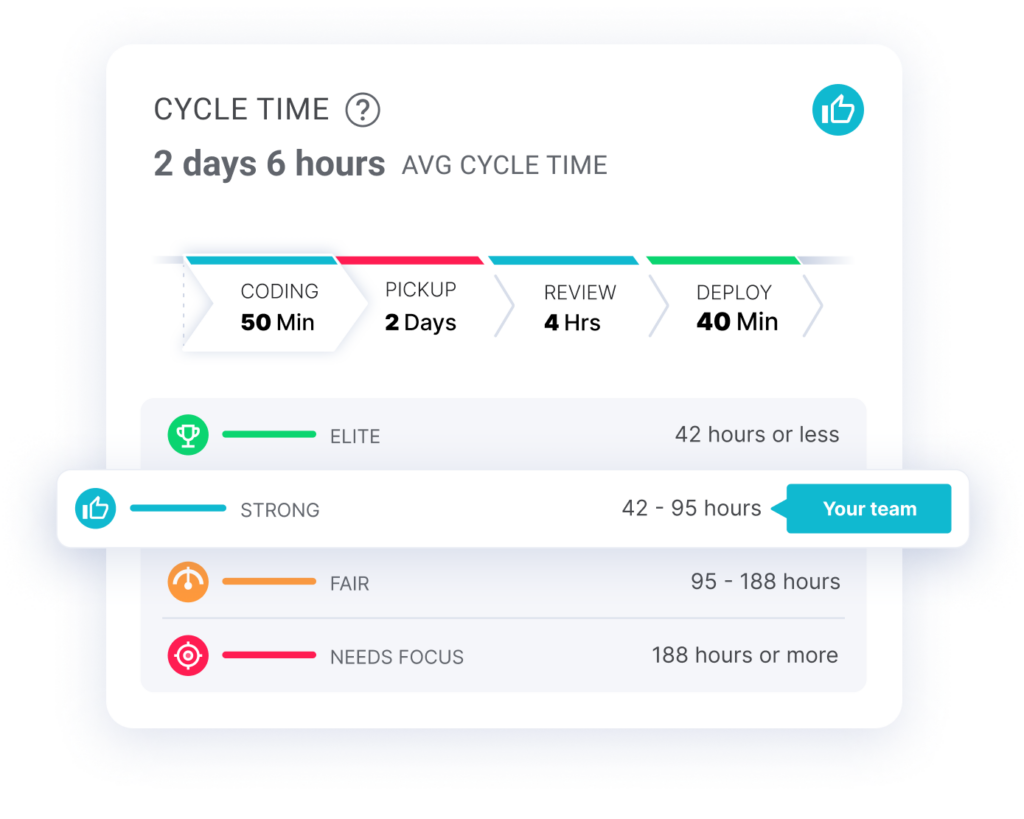
Coding Time
The time frame between ‘First Commit‘ to ‘PR Issued‘. It will show the average time it takes for a single engineering task (usually mapped to a branch) to go from First Commit to PR Issued.
Coding time is one of the most interesting engineering execution metrics to track over time. Since you want your PR Sizes to be small and your deployment frequency to be high, you want to make sure coding time isn’t increasing by a significant margin. If your coding time does spike, that is likely an indicator of larger issues down the pipeline.
PR Review Time
This statistic refers to the average time it takes for pull requests to be reviewed. The more time it takes for the team to review and merge pull requests, the longer it takes for them to reach production. A high PR review time can also increase the risk of merge and logical conflicts due to the increased isolation time of branches.
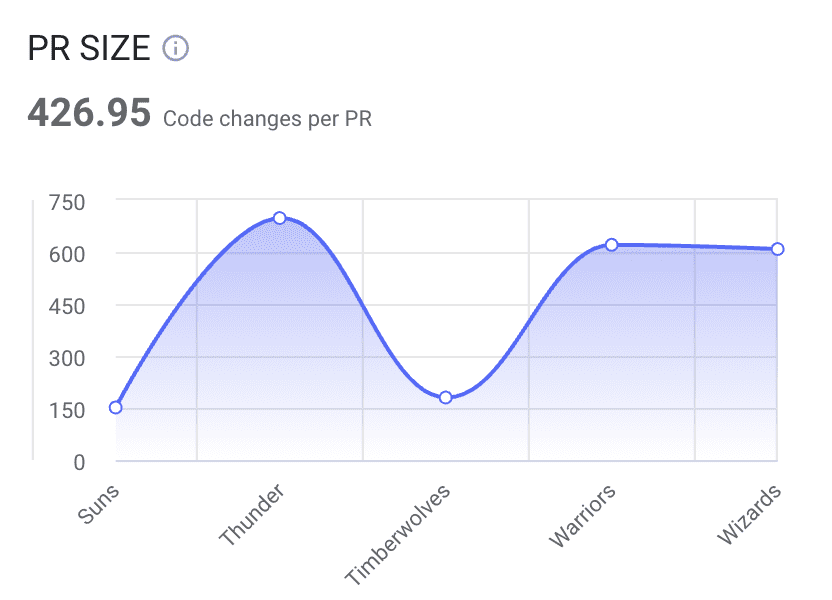
PR Size
If you subscribe to the notion that code is a liability instead of an asset, the value of this statistic should be easy to grasp. In short, large changes are riskier than smaller ones. The more code you have, the more likely it becomes you have buggy, complex, or hard-to-read code.
Code Rework
Code rework refers to the portion of the code that gets rewritten too often and too soon after first being merged. Though not necessarily a problem, it might be a sign that something isn’t quite right. It might mean the developers are struggling, generally due to a lack of skill, domain knowledge, or experience with the tech stack the organization favors.
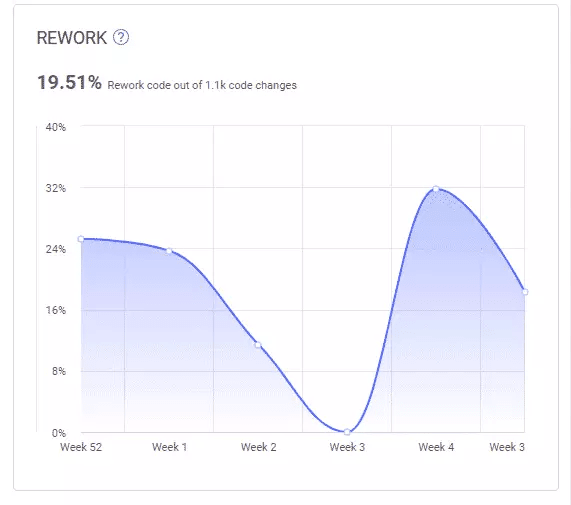
A high level of code rework might also indicate problems in the codebase itself, such as poor architectural decisions, not adhering to coding best practices—such as the SOLID principles, particularly the OCP—or miscommunication with the customers, resulting in poorly understood requirements.
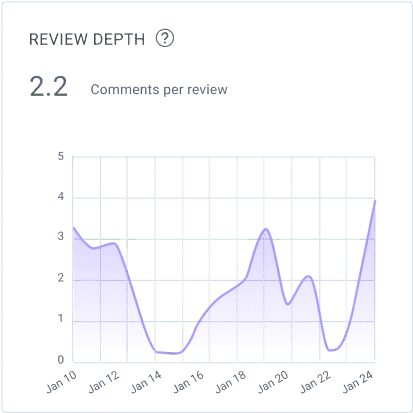
Review Depth
Review depth here means the average number of comments found in pull request reviews. By tracking and analyzing this number, you can get a sense of how deep and well thought out the reviews are inside your organization.
PRs Merged Without Review
Speaking of reviews, sometimes pull requests might be merged without a review. There might be justifiable reasons for that happening, but it should be the exception rather than the norm. Analyzing this metric might indicate the source of quality problems. Especially if you look at it along with other metrics on the list.
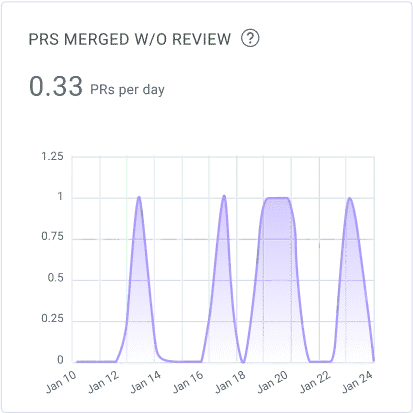
For instance, by looking at previous statistics, you might notice that the PRs without review increased just after a spike in the PR review time. With that knowledge, you might want to investigate ways in which you can improve the PR review time. This will not only guarantee the PRs get to production sooner but also reduce the number of PRs that get merged without review.

Spice Up Your Git Statistics With Project Data
In this post, we talked about some of the most valuable Git statistics for an organization. By tracking and improving such metrics, you can uncover and encourage positive trends while stopping the negative ones at their root. As a result, you’ll improve the health of your codebase and team.
But metrics and statistics aren’t a panacea. You can use them in ways that maximize their strengths, but true Software Delivery Intelligence starts when you integrate Git statistics with your project management tool. The ability to visualize how your team’s Git statistics map directly to your project or story tickets multiplies the effectiveness of the data.
Using a tool able to correlate these two sources, you can get the best of both worlds. If you’d like to check out a tool that can do just that, get a demo of LinearB.