
Git analytics are a crucial part of understanding how your software development teams are performing. As using git analytics for measuring Developer Experience and Developer Productivity has gained popularity in the past few years, it’s important for engineering leaders to develop a deep understanding of what they are, which analytics they should be tracking and how they work together.
An important note about git analytics is that they are a single dimension of your overall engineering metrics program. When looking for holistic visibility into the performance and efficiency of your software development organization, it’s important to correlate git analytics with both quantitative and qualitative metrics from across your stack and organization. While today’s blog will help you gain a deeper understanding of git analytics alone, we recommend you combine them with analytics from your project management tools, as well as with qualitative feedback from developer surveys and performance reviews.
What is Git Analytics?
Git analytics are units of measure based on the activity within your git repository. These metrics, often called git metrics, typically fall into three main categories: velocity, quality, and throughput. Most git analytics focus on pull request (PR) activity, also known as merge request (MR) activity.
Why are Git Analytics Important?
Git analytics play an important role in the performance and maturity of your software development life cycle. Engineering leaders use git analytics to benchmark team performance, set goals, identify workflow bottlenecks and report on the productivity of their organization. Like with all metrics, git analytics provide software engineering teams with visibility into the velocity, quality and throughput of their work product. Using git analytics as a key performance indicator improves the overall productivity and experience of your engineering organization.
Now that we have a better understanding of what git analytics are, and why they’re important, let’s dive into the top 14 git analytics every software development team should be tracking.
The Top 14 Git Analytics Every Software Development Team Should Be Tracking:
- Cycle Time
- Coding Time
- Pull Request (PR) Pickup Time
- Pull Request (PR) Review Time
- Deploy Time
- Merge Frequency, also known as Merge Rate
- New Work Rate
- Rework Rate
- Refactor Rate
- Pull Request (PR) Size
- Review Depth
- Pull Request (PR) Maturity
- Approve Time
- Merge Time
1. Cycle Time
Cycle Time Definition:
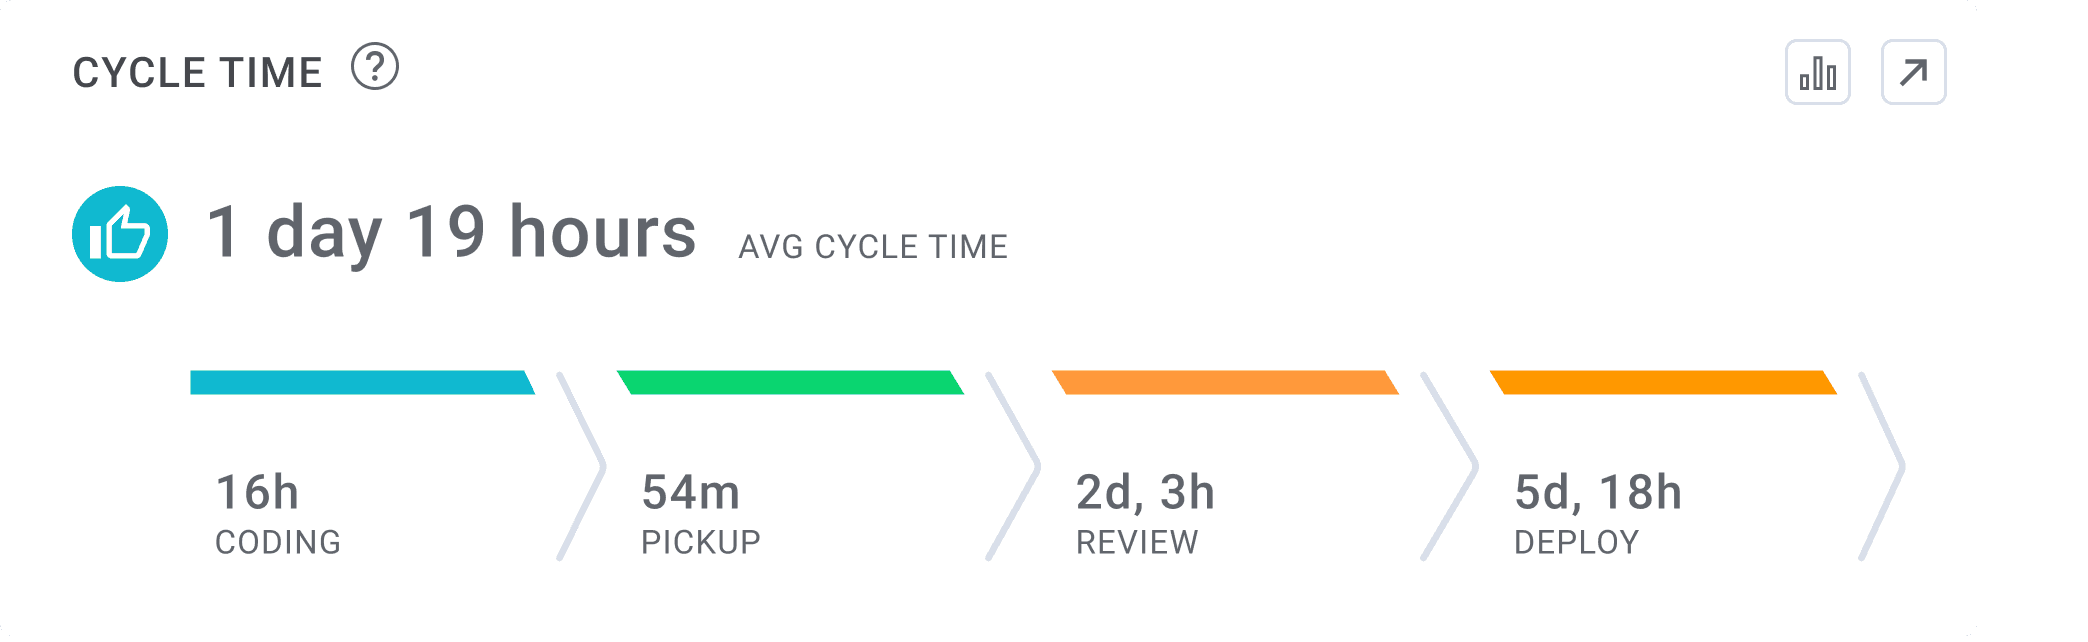
Cycle Time measures the amount of time it takes for a single engineering task (usually mapped to a branch) to go through the different phases of the delivery process from 'code' to 'production'. Cycle Time consists of four sub-metrics: Coding Time, Pull Request (PR) Pick Up Time, Pull Request (PR) Review Time and Deploy Time.
How Cycle Time is used:
Cycle Time is one of the four DORA (DevOp Research and Assessment) Metrics and is used by software development teams to understand their speed of delivery. Engineering leaders using Cycle Time as a key performance indicator are able to understand how long their team’s work takes to complete, providing them with a data foundation on which to plan their team’s work. Cycle Time is a key metric for measuring velocity and predictable project delivery.
What is a good Cycle Time?
Based on the 2025 Software Engineering Benchmarks report, elite software engineering teams have a Cycle Time of less than twenty six hours.
2. Coding Time
Coding Time Definition:
Coding time measures the amount of time between first commit and when a pull request (PR) is issued.
How Coding Time is used:
Coding Time is a component of Cycle Time and is used to help engineering teams understand how much time a developer spends coding on an individual task. All else being equal, shorter coding times are better. Short coding times are a signal that the developer received clear and unambiguous requirements from the product team, and that their team is breaking down work tasks in an effective way. Research has shown that shorter coding times lead to both faster code delivery times and higher quality.
What is a good Coding Time:
Based on the 2025 Software Engineering Benchmarks report, elite software engineering teams have a Coding Time of less than one hour.
3. Pull Request (PR) Pickup Time
Pull Request (PR) Pickup Time Definition:
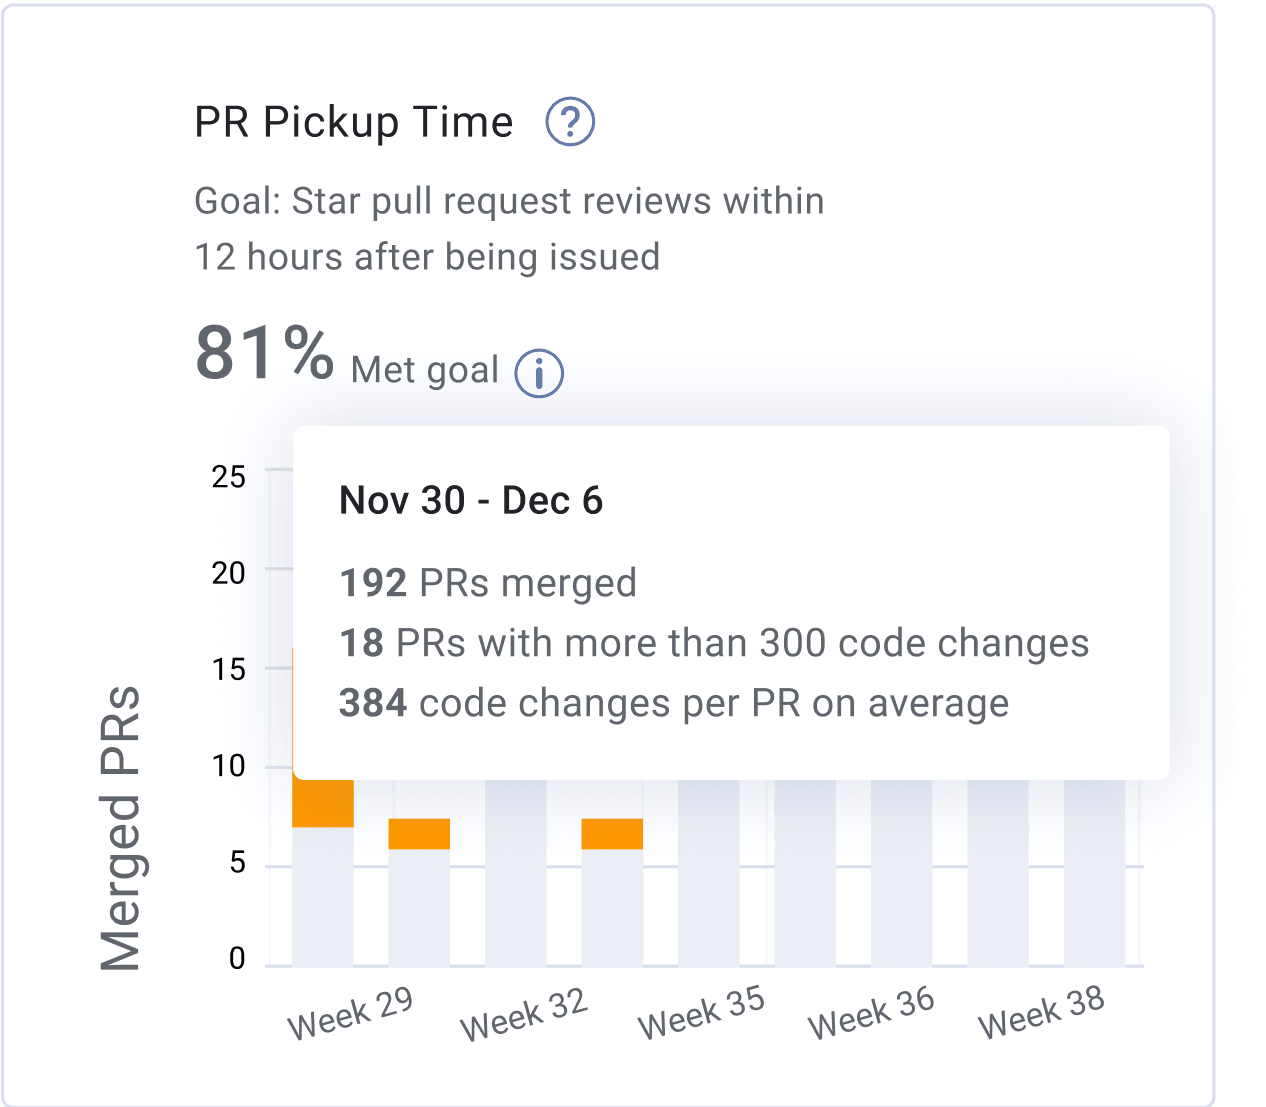
Pull Request (PR) Pickup Time measures the amount of time it takes from when a pull request is issued until a review has started.
How Pull Request (PR) Pickup Time is used:
Pull Request (PR) Pickup Time is a component of Cycle Time and is used to help engineering teams understand how much time it takes for a pull request to get picked up for review. We recommend teams strive to achieve pull request pickup times of less than an hour. Long pull request pick up times are a workflow bottleneck and an indication that engineers might be overwhelmed with work and don’t have enough bandwidth to dedicate to code review. Short Pull Request Pick Up times are an indication of strong collaboration within the team, leading to faster code delivery cycles and higher quality.
What is a good Pull Request (PR) Pickup Time:
Based on the 2025 Software Engineering Benchmarks report, elite software engineering teams have a Pull Request (PR) Pickup Time of less than eighty minutes.
4. Pull Request (PR) Review Time
Pull Request (PR) Review Time Definition:
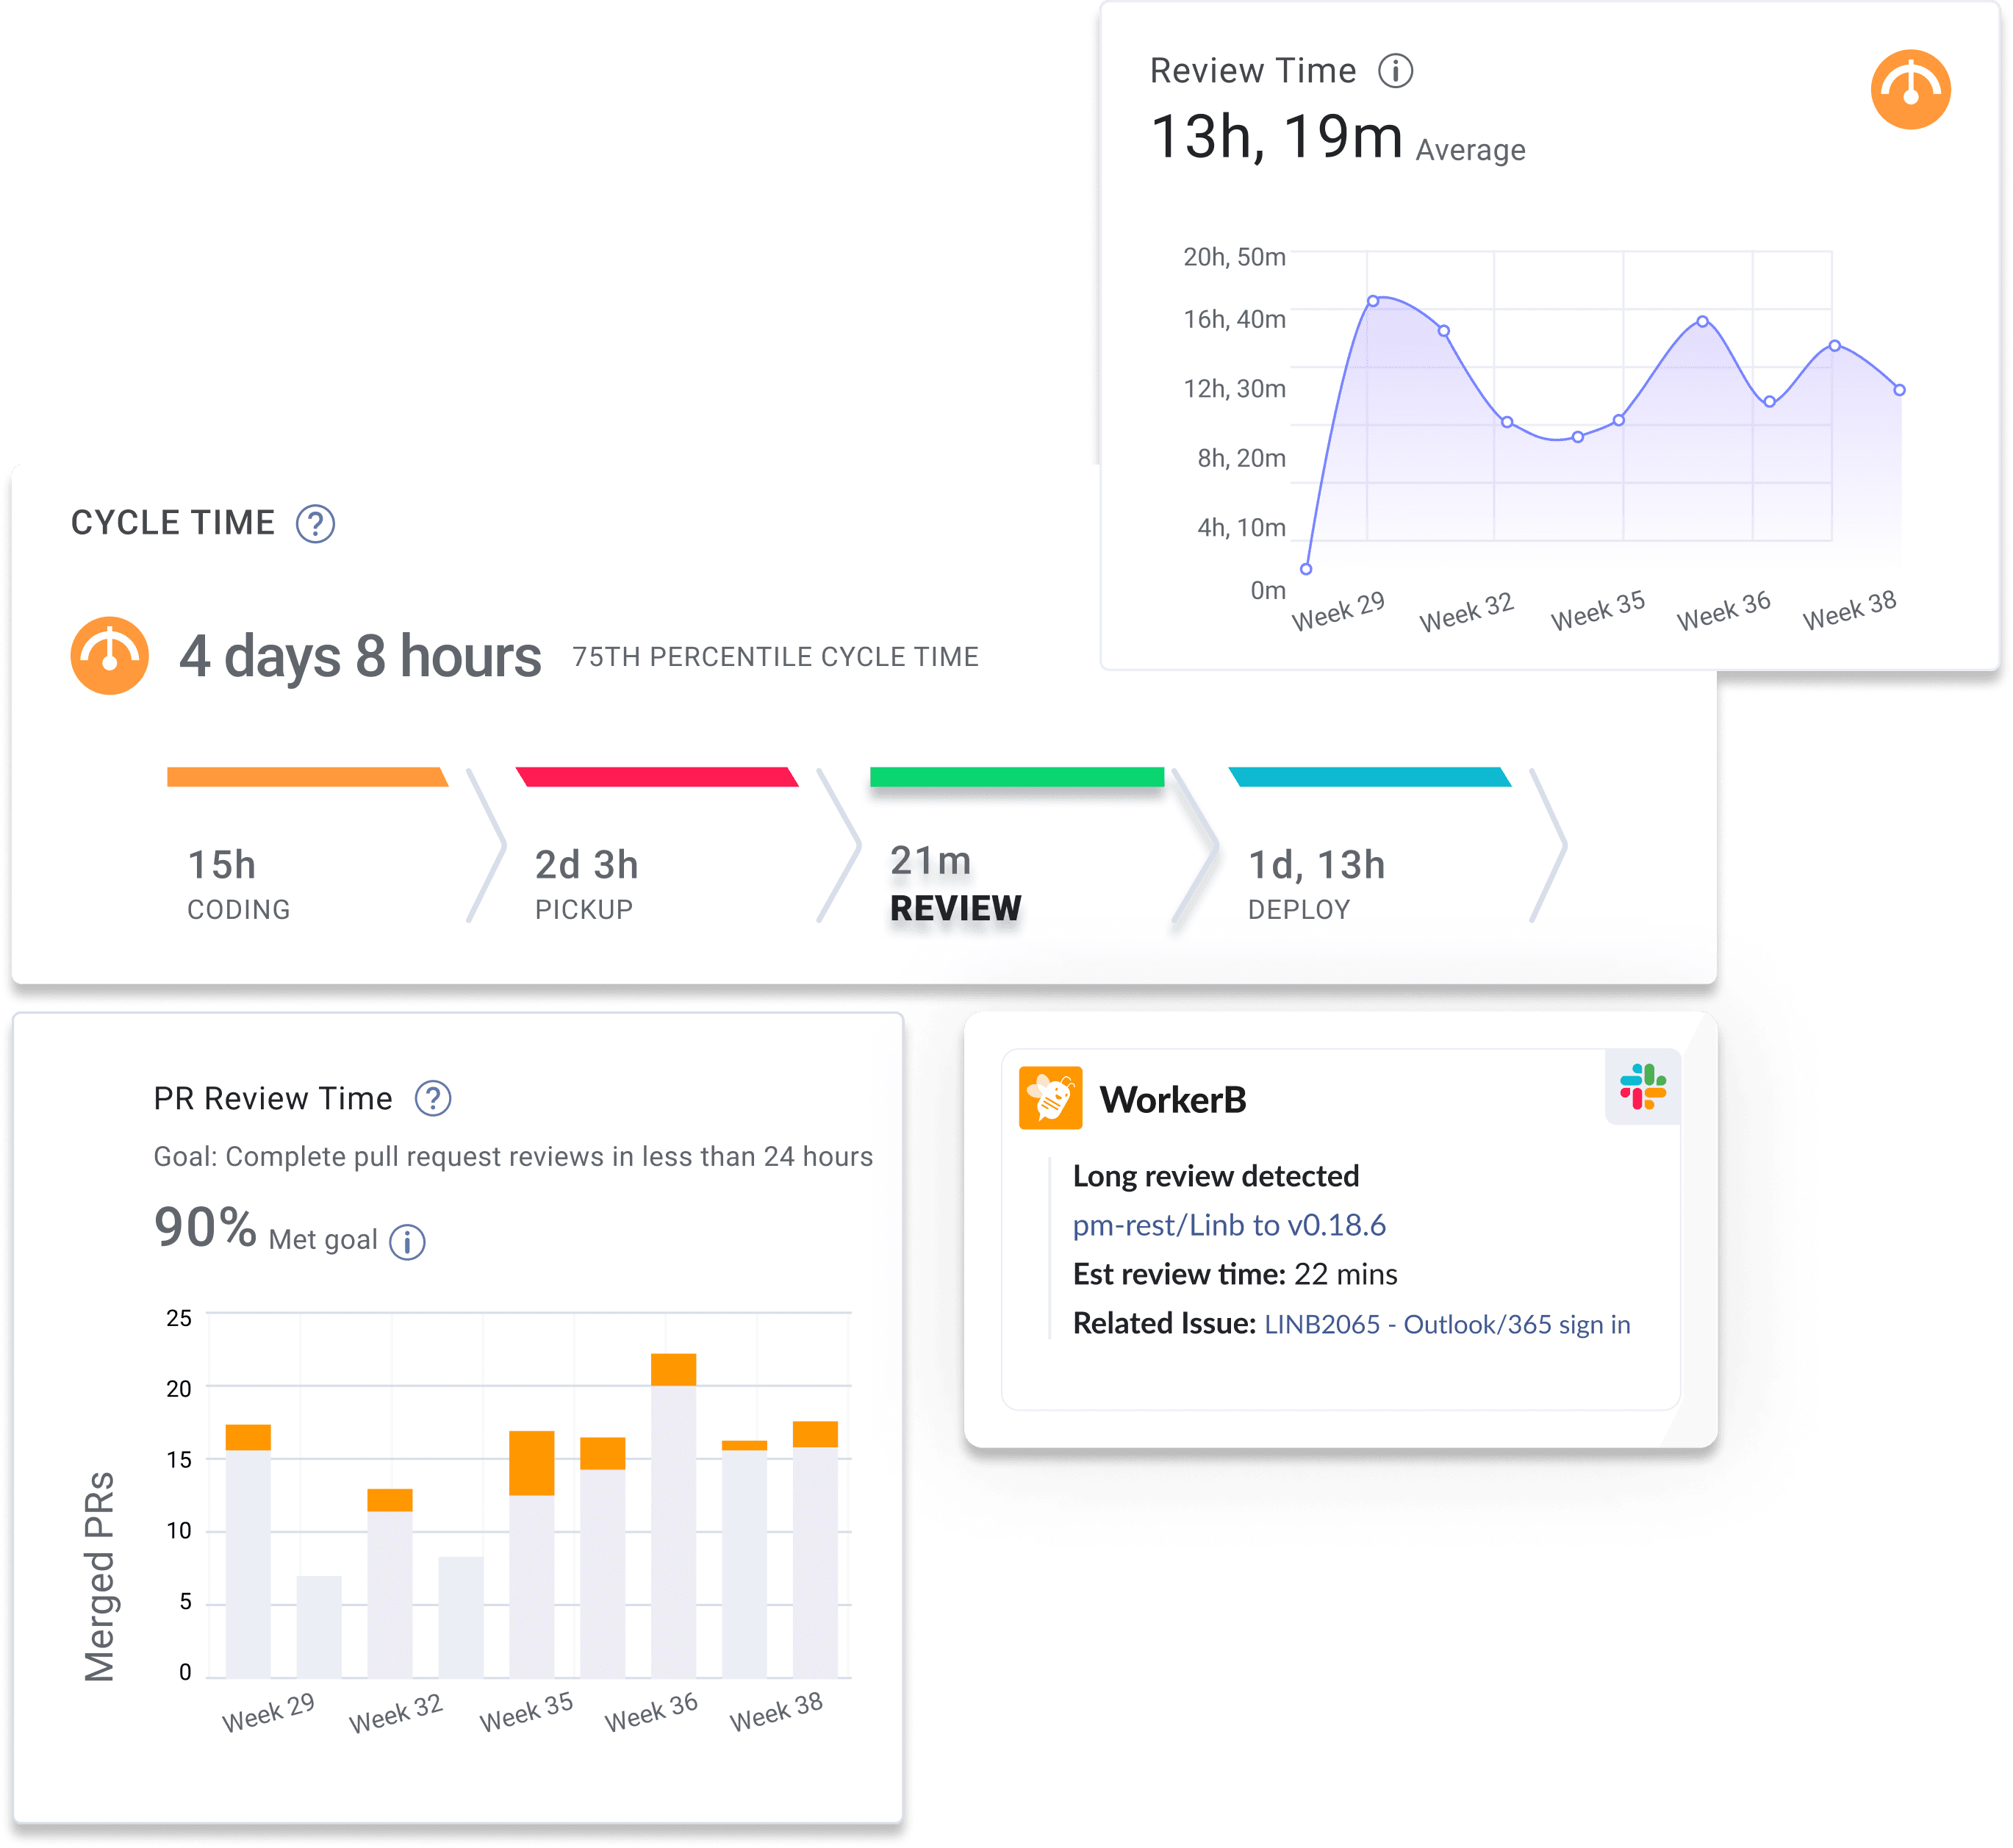
Pull Request (PR) Review Time measures the amount of time it takes to complete a code review and get a pull request merged. This git analytic is measured by calculating the time between the first comment on a pull request and when the PR is merged.
How Pull Request (PR) Review Time is used:
Pull Request (PR) Review Time is a component of Cycle Time and is used to help engineering teams understand how much time it takes for a pull request to be reviewed. We recommend software development teams strive to achieve pull request pickup times of less than thirty minutes. A long pull request review time is a workflow bottleneck and an indication that engineers might be overwhelmed with work and don’t have enough bandwidth to dedicate to code review. Short Pull Request Review times are an indication of strong collaboration within the team, leading to faster code delivery cycles and higher quality.
What is a good Pull Request (PR) Review Time:
Based on the 2025 Software Engineering Benchmarks report, elite software engineering teams have a Pull Request (PR) Review Time of less than two hours and fifteen minutes.
5. Deploy Time
Deploy Time Definition:
Deploy time measures the amount of time it takes to release code to production. This git analytic is measured by calculating the time between when a pull request is merged and when it is deployed to production (released).
How Deploy Time is used:
Deploy Time is a component of Cycle Time and is used to help engineering teams understand how much time it takes for a pull request to be deployed to production. We recommend software development teams strive to achieve deploy time of less than three hours. A long deploy time is a workflow bottleneck and an indication that your team’s CI/CD pipeline is not utilizing the appropriate amount of automation in order to build, test and deploy code.
What is a good Deploy Time:
Based on the 2025 Software Engineering Benchmarks report, elite software engineering teams have a Deploy Time of less than five hours and fifteen minutes.
6. Merge Frequency
Merge Frequency Definition:
Merge Frequency, also known as Merge Rate, measures the number of pull requests merged by a team or individual over a specified time period.
How Merge Frequency is used:
Merge Frequency is a developer experience metric that is used by engineering leaders to understand the rate at which work is moving through their software delivery pipeline. A high Merge Frequency indicates that working is being broken down into small chunks and that the engineering team is collaborating well. A low Merge Frequency is a leading indicator of poor team collaboration and workflow bottlenecks. We recommend software engineering teams strive to achieve a Merge Frequency of more than two merges per dev per week.
What is a good Merge Frequency:
Based on the 2025 Software Engineering Benchmarks report, elite software engineering teams have a Merge Frequency of more than two merges per dev per week.
7. New Work Rate
New Work Rate Definition:
New Work Rate is defined as the percentage of new work that is added to the code based by a team or individual during a specified period of time. New Work Rate is a category of Work Type, often compared to Refactor Rate and Rework Rate.
How New Work Rate is used:
New Work Rate is a code quality metric that engineering leaders use to understand the type of work an engineering team or individual is producing during a specific time period. In comparison to the three Work Types, New Work Rate should make up the majority of code during an iteration. We recommend software engineer teams strive to achieve a New Work Rate of more than eighty nine percent all of all work during a single iteration. A low New Work Rate is a leading indicator of code base architecture problems. Younger companies will typically have a higher New Work Rate than larger enterprises.
What is a good New Work Rate:
Based on the 2025 Software Engineering Benchmarks report, elite software engineering teams have a New Work Rate of more than eight six percent during any given time period.
8. Rework Rate
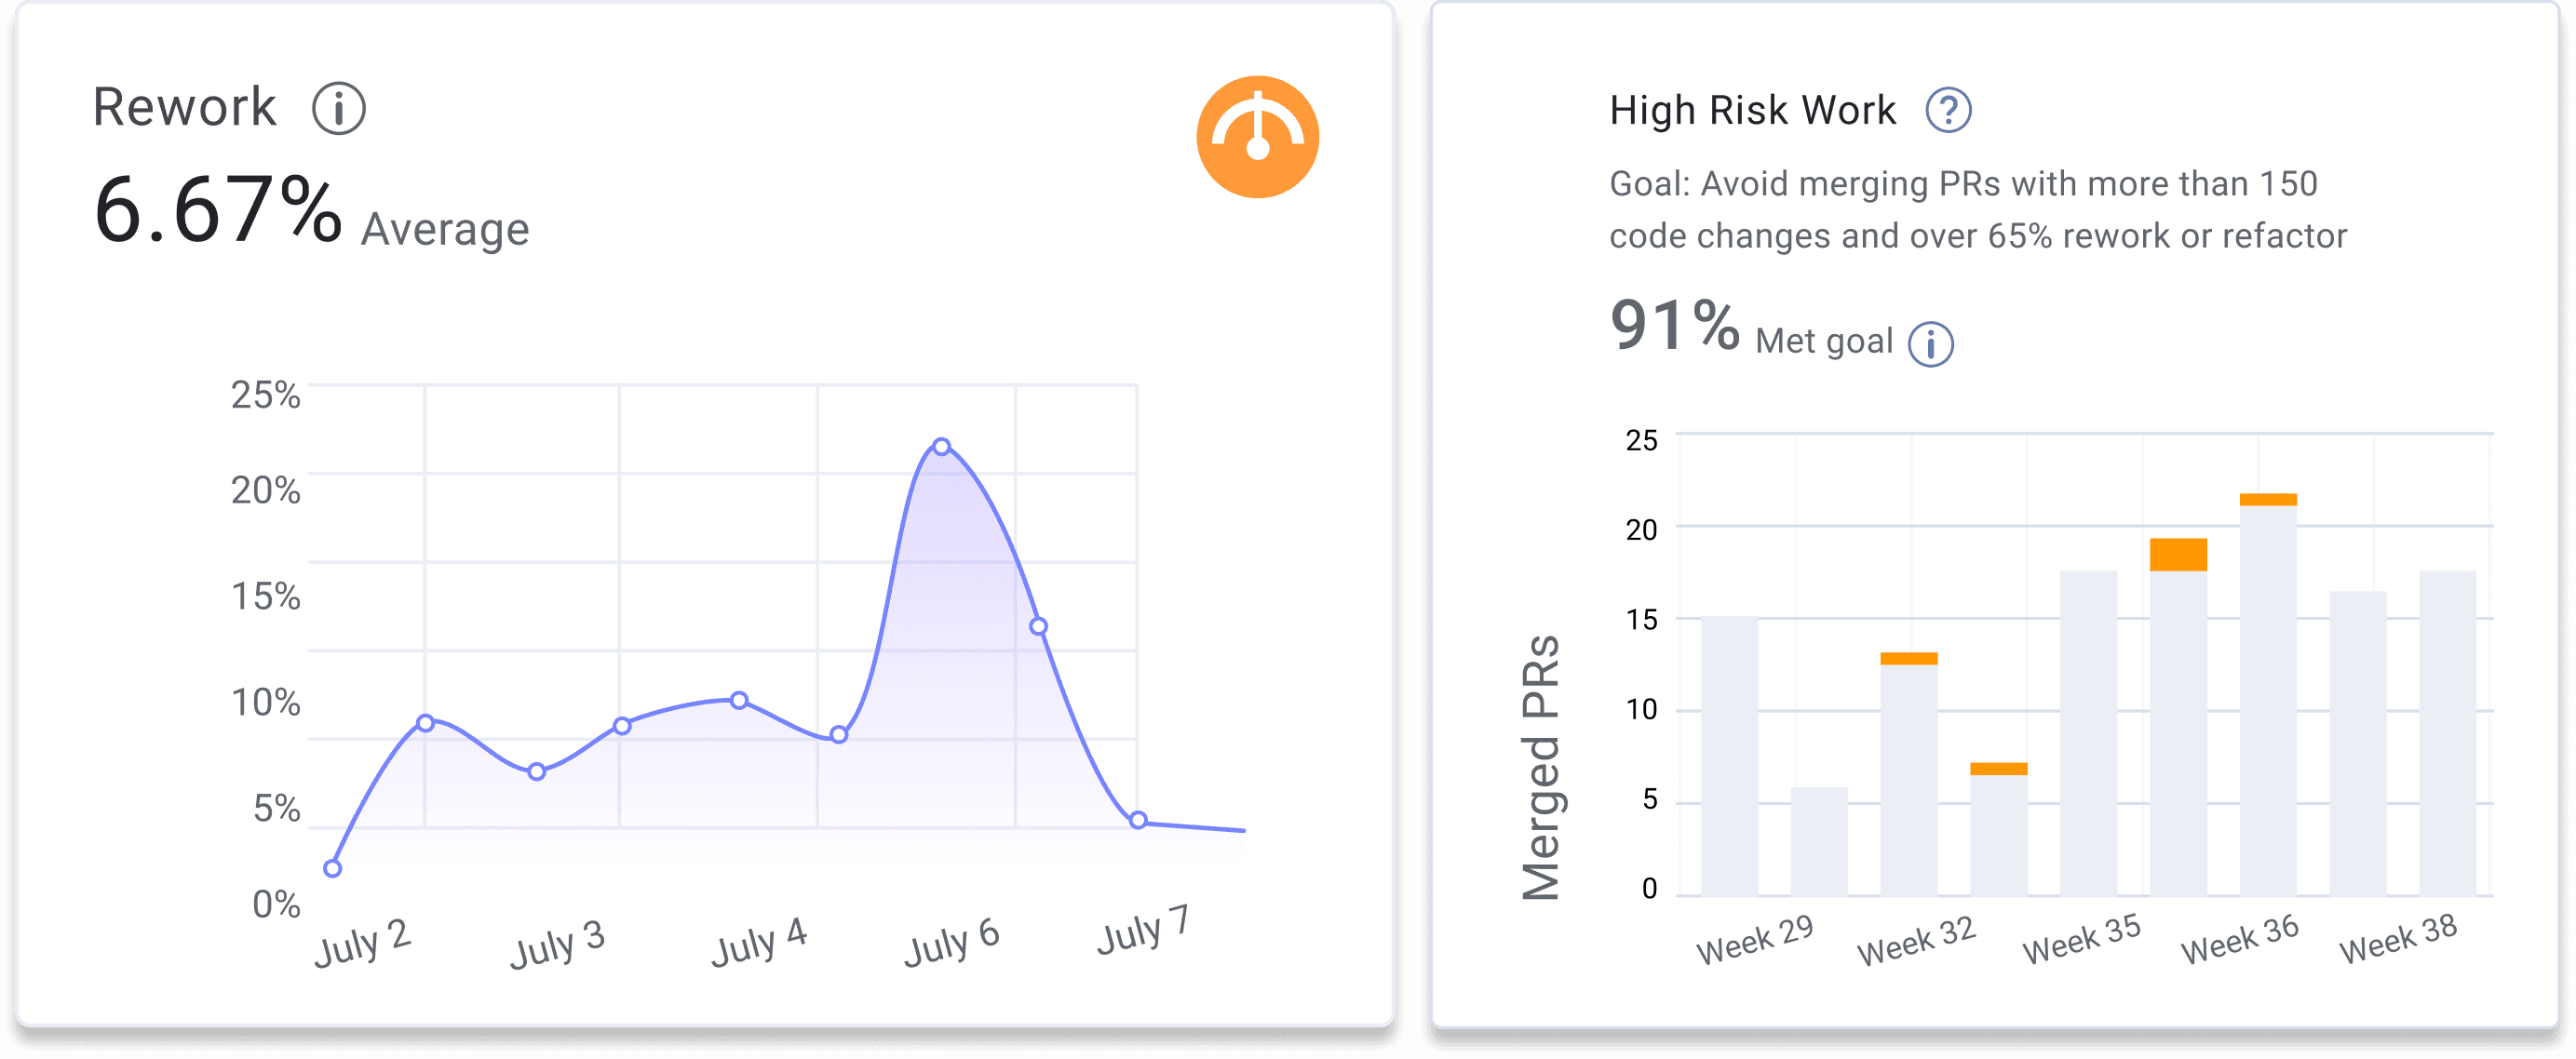
Rework Rate Definition:
Rework Rate measures the percentage of changes made to code that is less than 21 days old during a given time period. Rework Rate is a category of Work Type, often compared to New Work and Refactor Rate.
How Rework Rate is used:
Rework Rate is a code quality metric that engineering leaders use to understand the type of work an engineering team or individual is producing during a specific time period. In comparison to the three Work Types, Rework Rate should represent the smallest percentage of work types during an iteration. High levels of reworked code indicate a quality issue in recent releases. We recommend software engineer teams strive to achieve a Rework Rate of less than two percent during any given time period.
What is a good Rework Rate:
Based on the 2025 Software Engineering Benchmarks report, elite software engineering teams have a Rework Rate of less than three percent during any given time period.
9. Refactor Rate
Refactor Rate Definition:
Refactor Rate measures the percentage changes made to code that is more than 21 days old during a given time period. Refactor Rate is a category of Work Type, often compared to New Work and Rework Rate.
How Refactor Rate is used:
Refactored work represents changes to legacy code, and is a code quality metric that engineering leaders use to understand the type of work an engineering team or individual is producing during a specific time period. Some degree of refactored code is acceptable and even required for improving systems quality. However, a large amount of refactoring in a single release is not recommended, as these changes have a higher probability of harming existing functionality.
What is a good Refactor Rate:
Based on the 2025 Software Engineering Benchmarks report, elite software engineering teams have a Refactor Rate of less than eleven percent during any given time period.
10. Pull Request (PR) Size
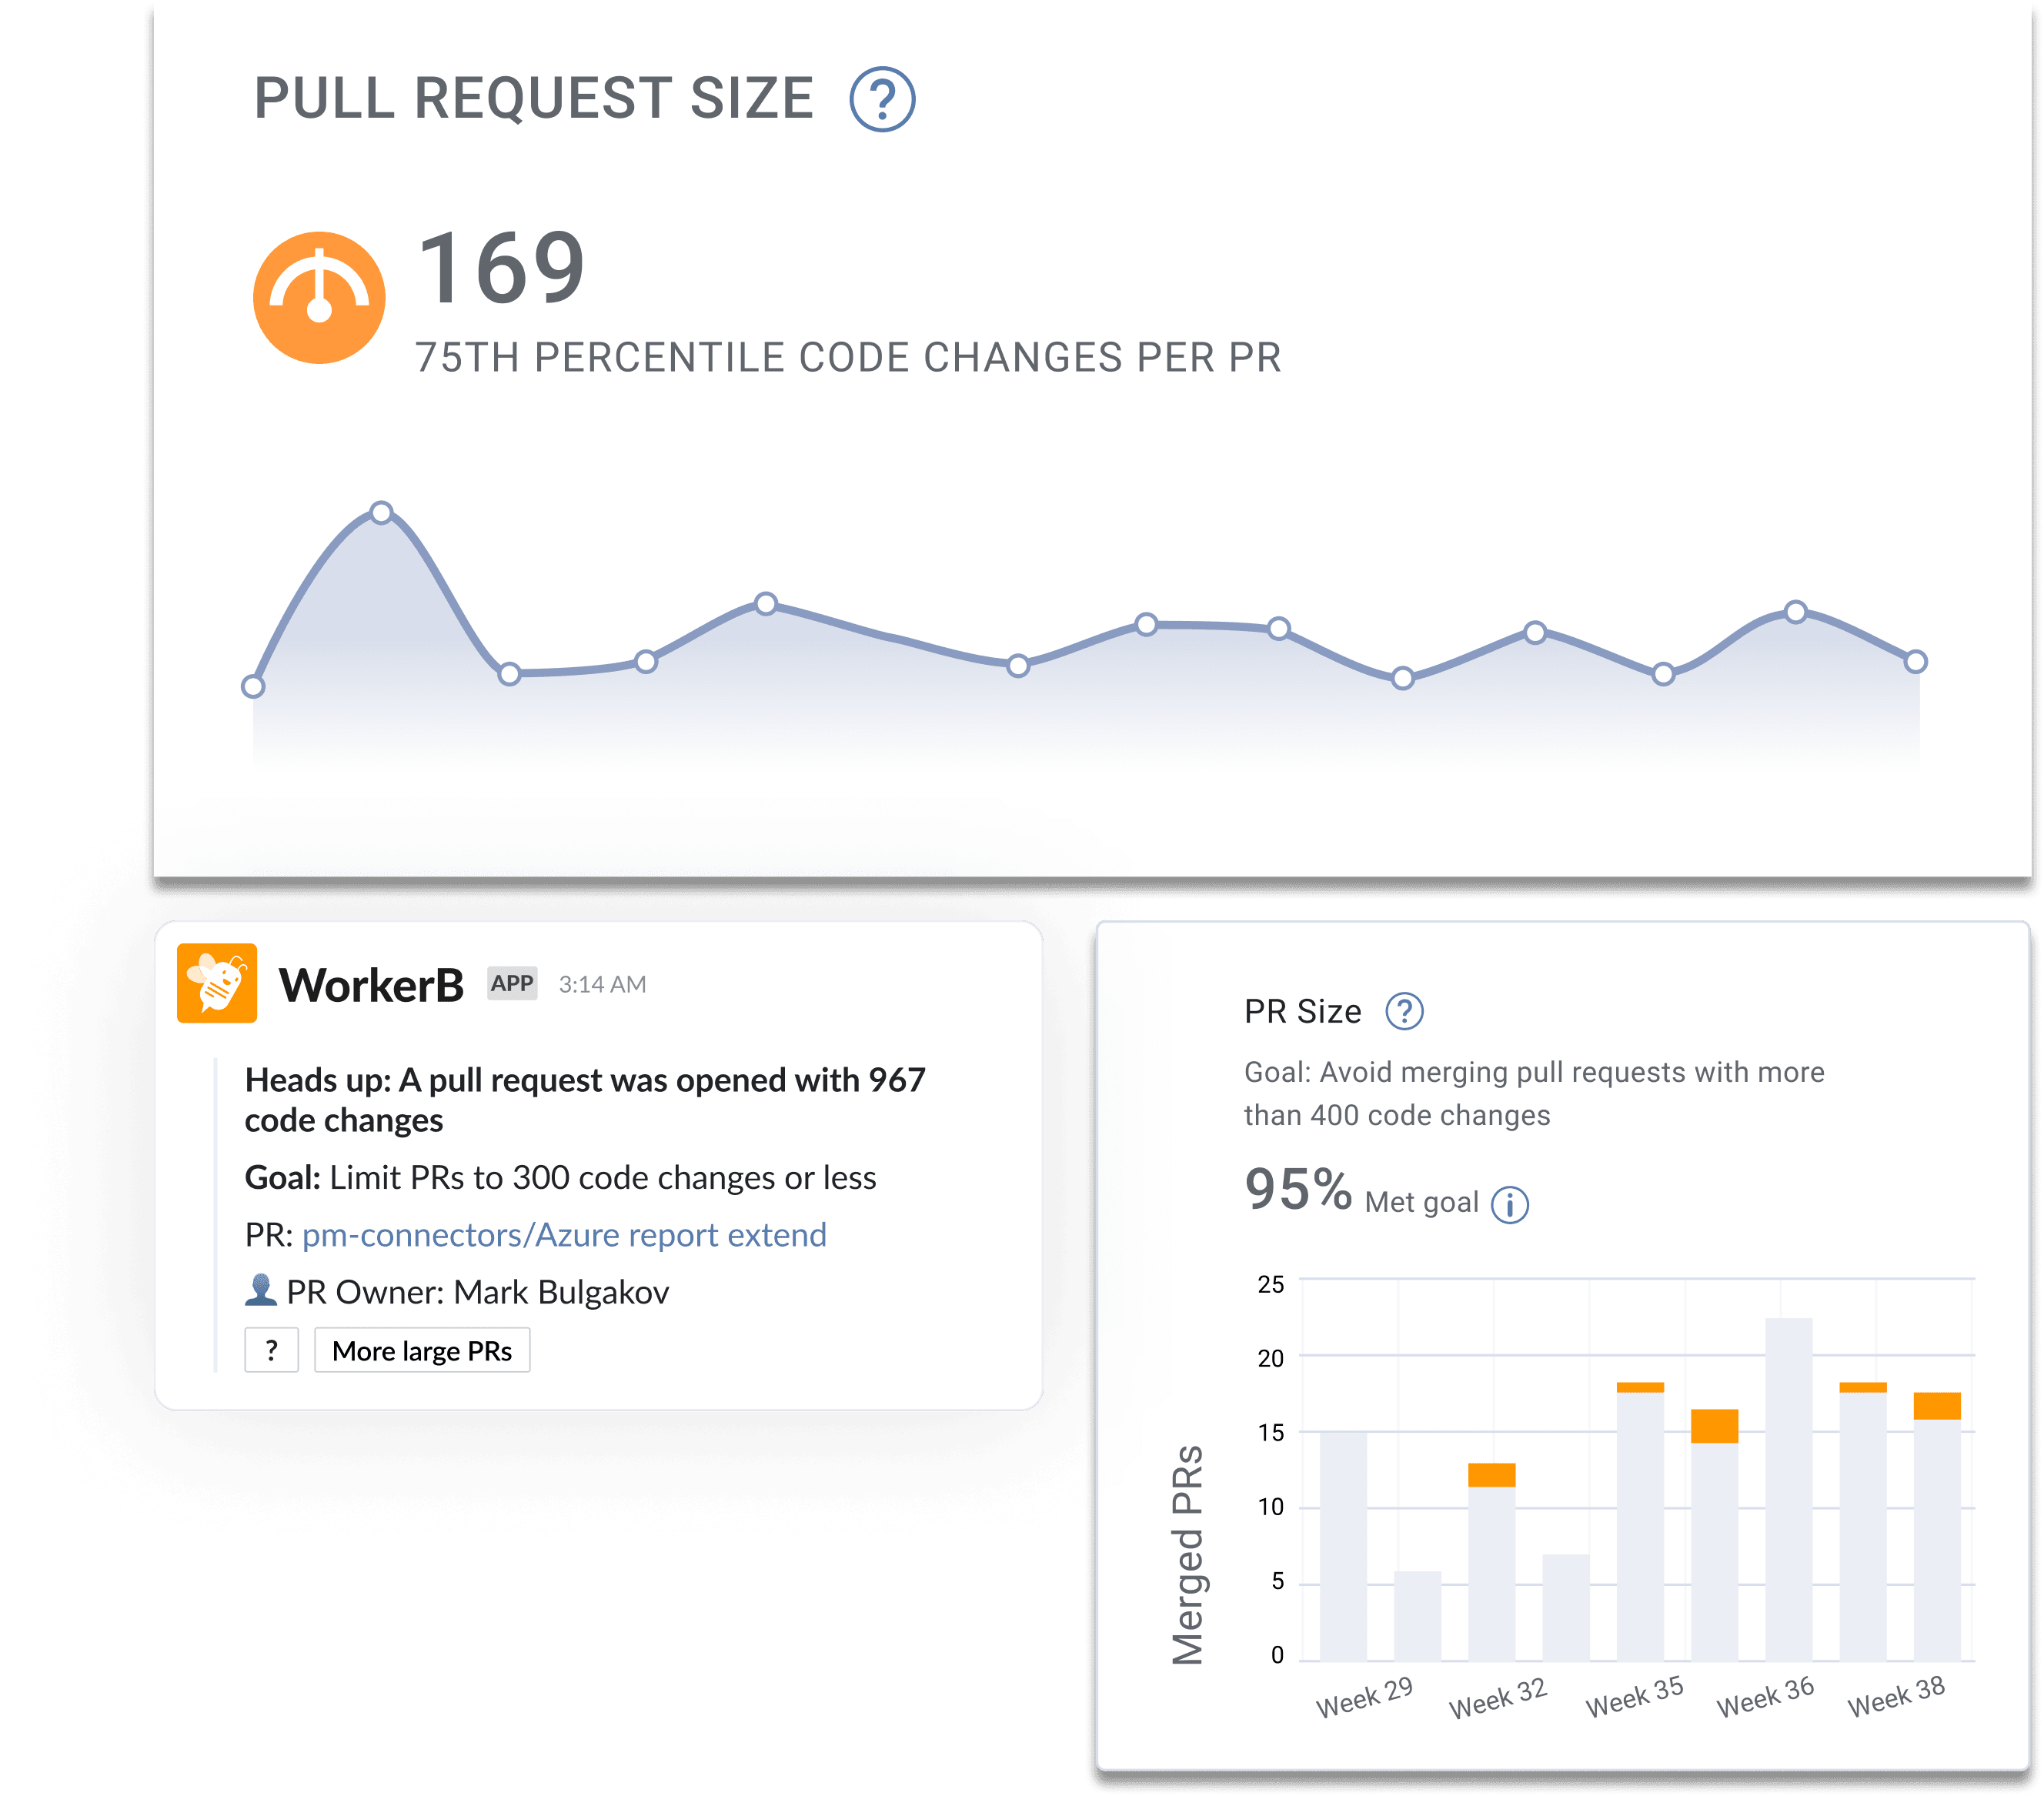
Pull Request (PR) Size Definition:
Pull Request (PR) Size measures the number of code changes (in lines of code) within a pull request.
How Pull Request (PR) Size is used:
Pull Request (PR) Size is a quality metric used by engineering leaders to understand the average size of a single task within a team. We recommend dev teams break their work up into small chunks because small and digestible pull requests help developers reduce the risk of introducing new bugs or production issues. When pull requests are smaller they are easier to test and review and teammates can review more thoroughly and have a better chance of finding problems within the code. Large Pull Request Sizes are a leading indicator of a lack of pull request standards and will often increase a team’s Cycle Time.
What is a good Pull Request (PR) Size:
Based on the 2025 Software Engineering Benchmarks report, elite software engineering teams have an average Pull Request Size of less than eighty five code changes.
11. Review Depth
Review Depth Definition:
Review Depth measures the average number of comments per pull request review. This metric is an indication regarding the quality of the review and how thorough reviews are done.
How Review Depth is used:
Review Depth is a code quality metric that engineering leaders use to understand the efficacy of their pull request review process. Reviews are an important factor for improving code quality and finding quality issues in code before it is merged and deployed. Teams who have a high review depth typically see fewer bugs in production as compared to teams who have a low review depth. To improve Review Depth, we recommend encouraging your team to assign multiple teammates to a pull request review.
12. Pull Request (PR) Maturity
Pull Request (PR) Maturity Definition:
Pull Request (PR) Maturity measures the percentage of code changes that occur within a pull request after it is submitted for review.
How Pull Request (PR) Maturity is used:
Pull Request (PR) Maturity is a code quality metric used by engineering leaders to understand the quality of work being delivered by a single developer. Teams with a high Pull Request (PR) Maturity score will experience faster code delivery cycles and fewer bugs than teams with low Pull Request (PR) Maturity scores. Low Pull Request (PR) Maturity scores are a leading indicator of performance issues and higher change failure rates.
What is a good Pull Request (PR) Maturity:
Based on the 2025 Software Engineering Benchmarks report, elite software engineering teams have an average Pull Request (PR) Maturity score of 91%.
13. Pull Request (PR) Approve Time
Pull Request (PR) Approve Time Definition:
Approve Time is defined as the amount of time between the first comment and approval of a pull request during its review cycle. Pull Request (PR) Approve Time is a subset of Review Time.
How Pull Request (PR) Approve Time is used:
Engineering leaders use Pull Request (PR) Approve Time as a developer experience metric in order to identify workflow bottlenecks. A high Pull Request (PR) Approve Time is a common indication of high levels of context switching and potentially low quality code. Software development teams who experience high Pull Request (PR) Approve Times should apply additional context to their pull requests like estimated review times and attached issues.
What is a good Approve Time:
Based on the 2025 Software Engineering Benchmarks report, elite software engineering teams have an average Pull Request (PR) Approve Time of less than ten hours.
14. Pull Request (PR) Merge Time
Pull Request (PR) Merge Time Definition:
Pull Request (PR) Merge Time is defined as the amount of time between the first approval of a pull request and its merge. Pull Request (PR) Merge Time is a subset of Review Time.
How Pull Request (PR) Merge Time is used:
Engineering leaders use Pull Request (PR) Merge Time as a developer experience metric in order to identify workflow bottlenecks. A high Pull Request (PR) Merge Time indicates too high of a WIP count for the responsible developer as well as a potential inter-team workflow collaboration issue. Software development team experiencing a high Pull Request (PR) Merge Time should apply automation that notifies responsible parties in real-time when a pull request is approved.
What is a good Pull Request (PR) Merge Time:
Based on the 2025 Software Engineering Benchmarks report, elite software engineering teams have an average Pull Request (PR) Merge Time of less than seventy five minutes.
How to Get Started Measuring Git Analytics
Tracking git analytics, like the fourteen mentioned above, is a major maturity and visibility milestone for any engineering organization. Using these metrics as a team leader will give you the foundational data in which to become more effective in both your weekly and monthly meetings, as well as in setting data-driven goals for your organization. When used in tandem with Project Management tool analytics and qualitative developer feedback, your organization will have all of the required tools in order to sustainably improve developer productivity and become increasingly more predictable in your project delivery.
If you’re prepared to begin your git analytics journey today, feel free to reach out or set up a free account with LinearB.


