The broad definition of a defect narrows in on a state of imperfection, a lack of something, and being flawed. Port these states to software engineering and one would immediately start thinking of bugs and error messages. In the quest for better software products, it helps to monitor the rate at which we encounter defects in a software application—that is, the defect rate.
Apart from clearly defining the defect rate, this post discusses how you’d identify defects, where to measure, and the means of calculating their rate. This deep dissection of defect rate, a software quality metric, will help shape your approach to testing. This in turn should help keep your software functioning within specifications.
Let’s dive right in with demystifying the concept of defect rate specific to software development.
What Is Software Defect Rate?
Defect rate is a system of counting the number of defects over the amount of areas examined. If we reduce our attention to just one software product, the rate simply becomes the number of instances you deem defects. This might be the number of defects per thousand lines of code, or perhaps it’s the number of failures per execution (that is, the amount of failures per request or per test executed).
Does an unexpected application crash count as a defect? Does it have to be something you can reproduce? Certainly. In general, you can count a case as a defect if, instead of behaving as the requirements prescribe, there is some deviation. These questions and responses zero in on a crystal-clear definition of defects. It follows, then, that you need to have specific classifications for defects. However, there’s the question of where such cases can occur. As you’ll soon appreciate, where you detect a defect invites new conditions for classification.
Where to Observe Defects
Defects seldom mushroom only when the user is taking software applications for a spin. If tagged (for experimental purposes), one could track a defect from the development phase, all the way to production. Through these phases and more in between, a defect takes on different as-states. It helps to know these because this becomes the first step to catching and weeding them from the product.
These are the various phases in which you should expect to encounter defects, and how the defects would present themselves.
When Coding/During Code Reviews
As your team adds new code to your main branch, some erroneous code might also join your source. Consequently, senior developers/team leads take the mentorship role to read and highlight any errors before committing new code. The better talent you invest in, the fewer chances of this defect threat to take effect.
WorkerB’s high-risk work detection can also help your team identify pull requests that might need extra attention, such as those with a high rework ratio or too many code changes.
Obvious defects at this stage would be code that doesn’t compile at all. Then there’s code that builds, with error messages that could cause runtime errors down the line. An account of both cases will assist QAs with getting to the root cause of defects as the product matures.
When Integrating/Testing
The most common defect detection phase is when executing testing—more so when you improve testing methods, switch to better tools, or run deeper (more thorough) tests than your last efforts. On the other end of the spectrum, if you don’t test, you won’t catch any defects.
The defects you can expect to encounter at this stage depend on the type of tests you execute. Integration tests will raise flags on incompatibility issues across your modules. Functional tests will show defects as improper execution of the application’s logic. And so on.
In Staging Environments
Application staging gives your developers a chance to test applications in their intended environment. This irons out the “it works on my machine” scenario. Staging environments mimic the final (production) hosting environment of your applications. As such, it’s a phase where your product’s defect rate could peak.
Typical defects at the staging phase include broken links, slow application performance, missing content, and any deviations from design schematics. We can pick these defects up with the use of automated functional testing tools, or even human testers.
In Production/User Feedback
The final defect frontier is when the software is in production. At this stage, most defects show up as performance events. However, they’d have to be severe or repeating for them to fit into a defect category. By extension, an infrastructure meltdown that renders applications unavailable doesn’t count as a defect—not even if it becomes commonplace.
You can recognize defects as user feedback that contains an application malfunction. Typically, such issues are traceable to a task once scheduled for execution in previous stages of the application’s life cycle. This means developers can invest some technical effort into rectifying the defect.
How to Calculate a Software Defect Rate
By now, you must be able to point a finger at specific instances and classify them as defects. That, or put a pin on them as just cases worth adding into the user manual. Let’s turn our focus on the calculation aspect of defect rate.
Keep in mind we had blinkered our focus to one software product for ease of explanation. In reality, you may have various software projects under way. Often, this scenario leads to developers occupied by tasks from different codebases. A defect rate for all such projects would be an interesting metric as you work toward optimizing developer productivity.
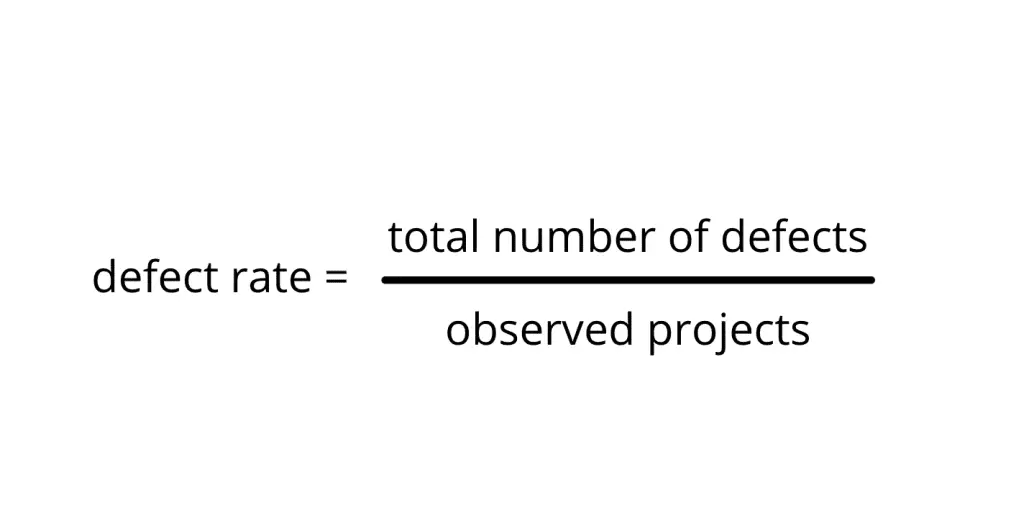
The simplest equation for defect rate divides the total observed defects by the number of individual projects observed. For a single product, the latter would be equal to one, leaving the rate as the number of defects detected. Some teams focus on defects detected by users in production. Then they can trace every instance back to its root or just log a bug in a tracking system for resolution.
A holistic approach to keeping track of defects is detecting them earlier in the life cycle of a software application. This is a sure way of unburdening the detect detection task from end users’ shoulders. At the same time, fewer defects make it to production (low defect escape rate).

Defect rate is a metric best kept at the minimum. The lower it is, the higher your confidence that your software is performing as expected. On the other hand, it could just be that you’re not using sufficiently competent testing/observing methods. If you have some log of the feedback pouring in with defects from your users, that’s a significant starting point toward maintaining a low defect rate.
Getting Started Measuring Defect Rate
In conclusion, your product’s defect rate is the direct count of imperfections discovered by various actors. These actors include developers and the final users of the software they make. Discovering defects early, internally, saves your developers time having to revisit sections of code when debugging.
Once you establish a defect rate, the implied task is keeping it as low as your team can manage. At the very least, your efforts will save you the embarrassment of pushing error-studded code into production. With application failures/defects capable of draining millions in losses from companies, it’s worth providing users with the best user experience.
How well you rectify discovered defects depends on how well information trickles down your development pipeline. Apart from the best testing tools to root out the defects, you also need to measure DORA metrics, specifically change failure rate and mean time to restore.
This is where LinearB comes in handy. Aggregate data from your Git, project, release, and incident management tools to view your DORA metrics in minutes. Plus you can set thresholds for leading indicators like high-risk work, PR size, and review time to begin improving your team’s defect rate. Then use lagging indicators like change failure rate and mean time to restore metrics during your retrospectives to track where you are.