# Why Agile Velocity is the Most Dangerous Metric | LinearB Blog

> Agile velocity is a useful tool for sprint planning. But when dev leaders use velocity as a productivity metric, it has dangerous consequences.

_This is a markdown rendering of a live HTML page on linearb.io, generated for AI/LLM consumption — it is not a markdown-only site. To get the full HTML page instead, request this URL with an explicit `Accept: text/html` header (no wildcard, no markdown preference)._

[Blog](https://linearb.io/blog)

/

Why Agile Velocity is the Most Dangerous Metric

# Why Agile Velocity is the Most Dangerous Metric

![Photo of Dan Lines](https://assets.linearb.io/image/upload/c_limit,w_2560/f_auto/q_auto/v1/Dan_Lines_3fb5152de2?_a=BAVMn6ID0)

By [Dan Lines](https://linearb.io/blog/why-agile-velocity-is-the-most-dangerous-metric-for-software-development-teams#dan-lines)

|

May 12, 2020

![Agile_Velocity_Linked_In_5a364e1957](https://assets.linearb.io/image/upload/c_limit,w_2560/f_auto/q_auto/v1/Agile_Velocity_Linked_In_5a364e1957?_a=BAVMn6ID0)

Agile velocity is arguably the most popular software development metric in the world. When used for an agile team’s sprint capacity planning, it’s a powerful metric. And there are two things we know about power: 1) It comes with great responsibility; and 2) It corrupts. 

When velocity is used in agile teams for anything other than capacity planning, velocity _becomes_ the most dangerous agile metric for software development organizations. Unfortunately, every day velocity is abused by executives, engineering leaders, product leaders, and even developers. 

## **What is Agile Velocity?**

Agile velocity measures the amount of work a single team completes during a software development iteration or sprint. It represents the number of story points completed over time and can be visualized as the slope in a classic [burndown chart](https://linearb.io/blog/iteration-burndown-chart/).

## **My Personal History with Story Points & Agile Velocity**

When I was promoted, I was in over my head. But I was determined to do a great job. I looked for every opportunity to help my development team improve. Data. Metrics. Process. Culture.

Yet, compared to other departments like sales, marketing, and technical support, there didn’t seem to be a lot of established metrics engineering leaders used to measure team-based performance and improvement. This is ironic because we measure so many things

Then I found velocity, and we started using it for capacity planning. At some point in a management meeting, I asked, “Should we start reviewing velocity every week in this meeting?” [Tim Wall](https://www.linkedin.com/in/timothyrwall/), a vet on our team who I really respected, gave me the following advice, “Never use velocity to measure performance and never share velocity outside of individual teams.” 

Thankfully, I listened to Tim. 
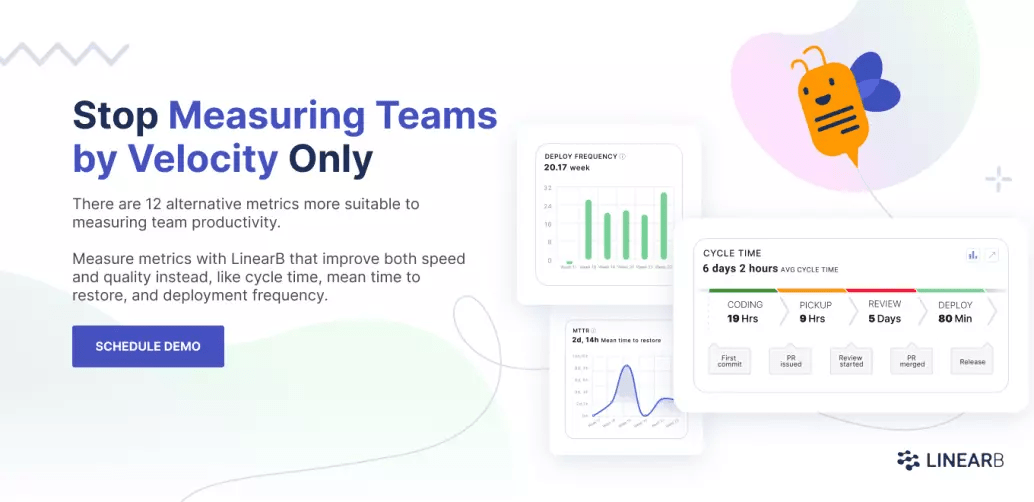
[![Stop measuring teams by velocity only. There are 12 alternative metrics more suitable to measuring team productivity. Measure metrics with LinearB that improve both speed and quality instead, like cycle time, mean time to restore, and deployment frequency.](https://assets.linearb.io/uploads/AgileVelocity-1024x497.png)](https://linearb.io/get-started/)

## The 3 **Dangers** To Avoid Around Agile Velocity

There are three main types of abuses I’ve seen of agile velocity. Consider this a _hero’s guide_ to help the software development community stay safe, avoid traps, and use velocity for good, not evil. 

## Danger No. **1\. Using Velocity to Compare Teams**

Imagine a scenario where all of your teams are using agile scrum and calculating velocity on an iteration by iteration basis.

You have a gut intuition that some of your teams are performing better, and some of your teams are performing worse. You get an itch to see which teams are completing the most story points per iteration and which teams are completing the least story points per iteration.

Then you start thinking about it in terms of who has the best velocity? Maybe you even show and compare velocity in your management meeting or scrum of scrums. 

### What Can Go Wrong?

* Story-point weights are subjective to each individual team. Therefore, story-point weights are easy to manipulate and developers have an incentive to inflate their points.
* Individual teams and developers can easily game the system, and if some team members are inflating their story points, other developers will figure this out.

From here you’re only a stone’s throw away from broken trust, frustration, and culture damage. Bad intentions aren’t even required for this to happen. It’s natural human behavior.

So, as Tim told me, agile velocity is sacred and should be used within individual scrum teams only. With that in mind, here is a tip to help navigate each situation. 

### Tip: Use Alternative Metrics to Preserve Culture

There’s nothing wrong with looking at comparative performance data. Without benchmarks, though, you won’t be able to invest your time helping your people and teams that need it most.

Since you shouldn’t use velocity, what metrics should you use? It depends on the[ business outcome](https://linearb.io/blog/align-engineering-metrics-to-your-business-kpis/) you’re trying to achieve.

* If speed to value is your main goal, consider[ cycle time](https://linearb.io/blog/cycle-time/).
* If predictability is your main goal, look at [iteration churn](https://linearb.io/blog/software-development-metrics-dashboard/).
* If quality is your priority, measure change failure rate and [mean time to restore](https://linearb.io/blog/5-key-metrics-to-fix-your-software-teams-quality/#:~:text=Mean%20time%20to%20restore%20%28MTTR,developers%20are%20distracted%20and%20interrupted).

A related question to ask yourself is, “What kind of culture do I want to create?

In fact, when I [interviewed Kathryn Koehler, Director of Prod. Engineering at Netflix, recently](https://devinterrupted.com/podcast/engineering-productivity-culture-at-netflix/) she reminded me that comparisons lead to unhappiness.

I’ve seen this, too. If you want to create an environment where it’s all about the team, consider throwing out metrics like individual code changes and commits — just measure team-based metrics. 

Some of us fell into the trap of using agile velocity in the wrong way because it was there and we didn’t have other metrics to use instead. That’s not the case anymore. 

Once you know what kind of team culture you want to create and what business outcomes you’re trying to support, there are a number of engineering metrics you can use to measure your progress without damaging trust with your developers. 

I created LinearB to help engineering and product leaders use metrics without damaging culture. Want to start using alternative metrics to velocity in your agile team?[ Get a demo of LinearB today!](https://linearb.io/get-started/?utm%5Fsource=Referrals&utm%5Fmedium=devinterrupted.com&utm%5Fcampaign=devinterrupted%20referrals) You’ll get proven DORA metrics, like cycle time, change failure rate, mean time to restore, and deployment frequency.

## Danger No. 2\. Using Velocity as a Performance Metric

It’s no secret; executives love data. Especially performance-related metrics.

One of the biggest issues that we face as engineering leaders is the lack of standardized metrics describing the health and performance of our teams. Unlike all other major departments (sales, marketing, finance), we as a community lack the basics when it comes to data-driven team performance. 

Sales has revenue, pipeline, and sales-cycle length. Marketing has MQLs, SQLs, and cost of customer acquisition. HR has positive and negative employee engagement, as well as retention rates.

CEOs and business leaders get these metrics, and they know what good and bad looks like. They know the leading indicators for success. They know what levers they can pull when those department leaders need help. 

Engineering is often reduced to, “Are we on track to deliver XYZ feature by the deadline?”

Their intentions are good, and they want to understand, but most CEOs don’t have an engineering background. Therefore they don’t have the [tools they need to understand engineering](https://leaddev.com/reporting-metrics/communicating-engineering-priorities-your-ceo) in the same way. 

Then all of sudden your CEO catches wind that you’re measuring sprint velocity for your agile teams. 

You say, _“Each team uses it to estimate how much work they can get done in a sprint.”_

They hear, “We can use it to measure dev org output over time and rank team performance.” 

They say, “Let’s start presenting velocity in every executive meeting and at every all-hands!”

What you should think is, “It’s a trap!” 

[![30 Day Star Wars Challenge GIF Find & Share on GIPHY](https://media2.giphy.com/media/lk0TFUdop2JTW/giphy.gif)](https://giphy.com/gifs/star-wars-its-a-trap-lk0TFUdop2JTW)

At this point in the conversation, our spidey senses should be going crazy. Velocity at the executive table? Do not proceed. 

Check out this interview with Ben Matthews, Director of Engineering at Stack Overflow, where he emphasizes that velocity should be one of many data points.

### Tip: Use Cycle Time to Demonstrate Productivity

This is your time to gracefully push back. Ask questions to understand what exactly your executive team is looking for.

Is it team-performance data? Are they worried about deadline predictability? Are they wondering about the impact of the new hires they invested in?

But start with, “Yes, we can absolutely be data-driven.” A former boss told me to start with yes, then get to the outcome I want. That concept has served me well over the years especially with CEOs.

You know that it will damage culture and encourage sandbagging. But consider keeping all of that to yourself and just explain why agile velocity is not accurate when used for anything other than an individual team’s sprint capacity planning.

Present alternative metrics. [Cycle time](https://linearb.io/blog/cycle-time/) is a great one because execs already understand sales cycle time. Software development cycle time is the equivalent for engineering teams. 
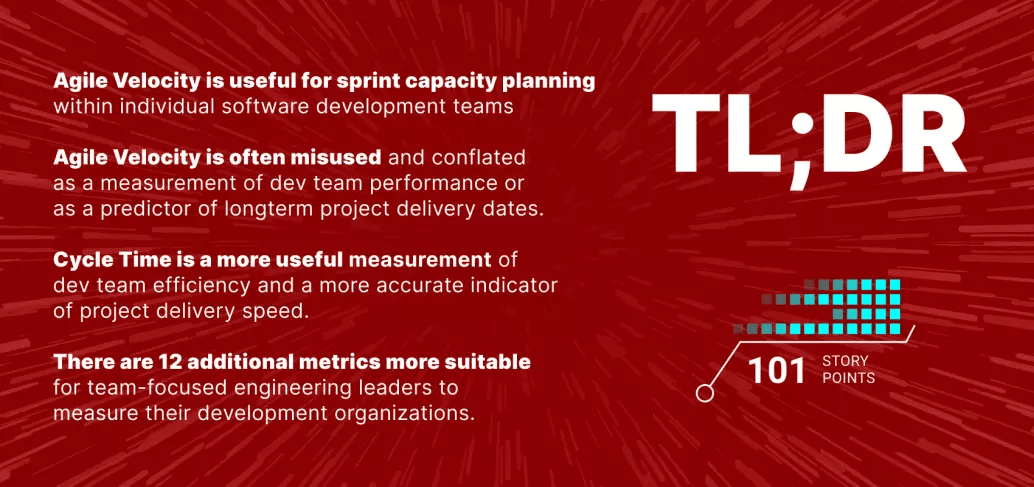
[![Agile velocity is useful for sprint planning, but it is often misused as a metric.](https://assets.linearb.io/uploads/TLDR-4-1024x482.png)](https://linearb.io/blog/17-software-metrics-for-modern-dev-leaders/)

## Danger No. **3\. Using Velocity in Agile to Predict Project Delivery Date**s

Imagine a project manager who wants to estimate when a project is going to be delivered. Easy, right? We know the team’s velocity over the past few iterations. All we need to do is break the epic down into user stories, assign story points, and do the math to see how long it will take the team to deliver.

Unfortunately, using velocity to estimate the delivery of a substantial long-term project spanning numerous sprints does not work. I’ve seen it attempted many times, and I’ve never seen it succeed.

At best, with good intentions, a lot of false expectations are created. At worst, it is a pressure tactic to pin a delivery date onto the engineering team. 

### Why This Never Works

Capacity planning only has value/accuracy one sprint at a time. It takes many iterations for a team to really understand its sprint capacity.

Estimating the amount of work a story takes increases in accuracy as the project progresses. Mapping out stories too many iterations in advance doesn’t work. Too many changes.

There is an inherent pressure to hit a date, and estimates get translated into commitments through a game of telephone with business stakeholders. Teams start bending story point values to respond to the pressure. 

The outcome that I have seen most often is that it causes pressure on developers to smudge (inflate) the actual amount of story points per story. Once that starts happening, a vicious cycle begins. 

### Tip: Use A Project Delivery Tracker

[Predicting delivery dates](https://linearb.io/blog/project-management-not-suck/) is the golden problem in software engineering. It is always a combination of art and science — rarely accurate. Using velocity and story points to map out a long-term estimation will not only come out inaccurate, but it also puts the wrong pressure on the estimating developers.

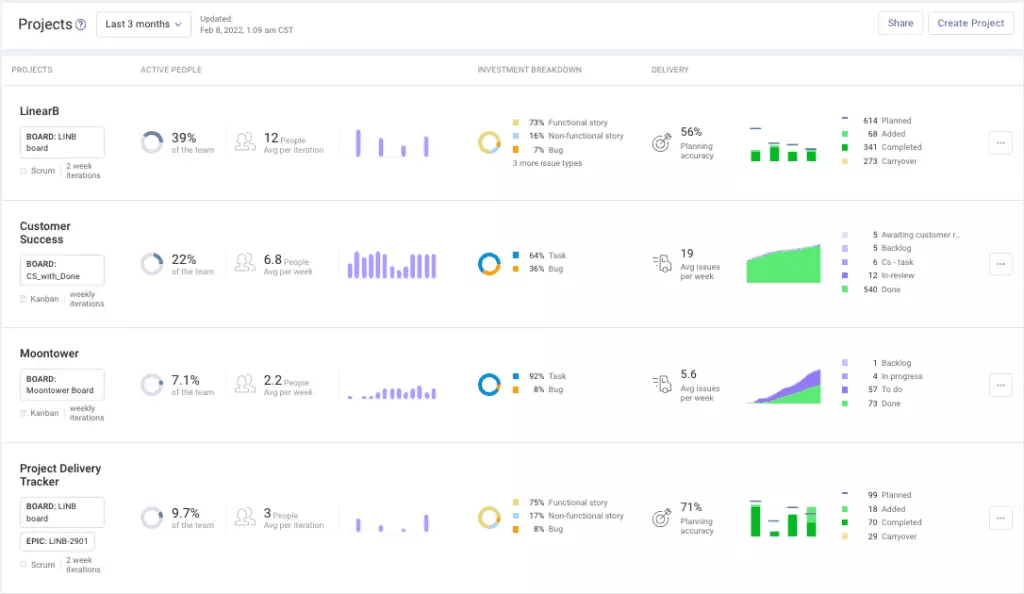
LinearB’s[ Project Delivery Tracker](https://linearb.helpdocs.io/article/g4czwado46-understanding-project-delivery-trackers) is a business alignment dashboard that helps you visualize the investment being made by issue type, progress of projects, and sprint planning accuracy. 
[](https://linearb.io/get-started)

It can include a board, an epic, a label, custom field value, or any combination of these.[ Book a demo today](https://linearb.io/get-started/) to see how it works! 

## Improve developer productivity with LinearB

Find us on

[](https://www.linkedin.com/company/linearb)
[](https://devinterrupted.substack.com/)

## Your next read

[![Cover image for AI ROI comes from measuring engineering outcomes on day one](https://assets.linearb.io/image/upload/c_limit,w_2560/f_auto/q_auto/v1/Blog_AI_ROI_comes_from_measuring_engineering_software_security_2400x1256_2c5eae0862?_a=BAVMn6ID0)](https://linearb.io/blog/kraken-nik-sudan-measure-ai-roi-engineering-outcomes)

Eng. Metrics

[AI ROI comes from measuring engineering outcomes on day one](https://linearb.io/blog/kraken-nik-sudan-measure-ai-roi-engineering-outcomes)

Kraken Engineering Operations Lead Nik Sudan details how to establish day-one data infrastructure to accurately measure AI ROI. Discover why raw token adoption...

[![Cover image for AI is rebuilding software delivery from SDLC to ADLC](https://assets.linearb.io/image/upload/c_limit,w_2560/f_auto/q_auto/v1/Blog_AI_rebuilding_software_delivery_2400x1256_3fd5887e75?_a=BAVMn6ID0)](https://linearb.io/blog/sdlc-to-adlc-agentic-software-delivery-transformation)

Eng. Metrics

[AI is rebuilding software delivery from SDLC to ADLC](https://linearb.io/blog/sdlc-to-adlc-agentic-software-delivery-transformation)

Discover how engineering organizations are transitioning from the traditional SDLC to an Agentic Development Lifecycle (ADLC). Learn why rising token costs...

[![Cover image for 8 million pull requests reveal where engineering productivity breaks down](https://assets.linearb.io/image/upload/c_limit,w_2560/f_auto/q_auto/v1/Blog_8_million_pull_requests_2400x1256_03724bfbb2?_a=BAVMn6ID0)](https://linearb.io/blog/8-million-prs-engineering-productivity)

Eng. Metrics

[8 million pull requests reveal where engineering productivity breaks down](https://linearb.io/blog/8-million-prs-engineering-productivity)

8.1M pull requests reveal the gap between AI adoption and engineering impact, and why code review is the bottleneck blocking real productivity gains.

## Structured data

_Machine-readable metadata (JSON-LD) embedded in the page for search/AI context — not content rendered on the page itself._

```json
{
  "@context": "https://schema.org",
  "@type": "Organization",
  "name": "LinearB",
  "url": "https://linearb.io",
  "logo": "https://assets.linearb.io/image/upload/v1715628027/logo-mark-lg.svg",
  "description": "LinearB is the engineering productivity platform that helps engineering leaders prove AI is improving throughput without sacrificing delivery confidence, flow efficiency, or developer experience.",
  "sameAs": [
    "https://www.linkedin.com/company/linearb"
  ],
  "award": [
    {
      "@type": "Award",
      "name": "LinearB is a Leader in the 2026 Gartner® Magic Quadrant™ for Developer Productivity Insight Platforms",
      "dateAwarded": "2026",
      "awardedBy": {
        "@type": "Organization",
        "name": "Gartner®"
      }
    },
    {
      "@type": "Award",
      "name": "Great Place to Work Certification",
      "dateAwarded": "2025-2027",
      "awardedBy": {
        "@type": "Organization",
        "name": "Great Place to Work"
      }
    },
    {
      "@type": "Award",
      "name": "America's Best Startup Employers 2025",
      "dateAwarded": "2025",
      "awardedBy": {
        "@type": "Organization",
        "name": "Forbes Magazine"
      }
    }
  ],
  "hasCertification": [
    {
      "@type": "Certification",
      "name": "SOC 1 Type 2"
    },
    {
      "@type": "Certification",
      "name": "SOC 2 Type 2"
    },
    {
      "@type": "Certification",
      "name": "GDPR Compliance certification"
    },
    {
      "@type": "Certification",
      "name": "ISO 27001"
    }
  ]
}
```

```json
{
  "@context": "https://schema.org",
  "@type": "Article",
  "headline": "Why Agile Velocity is the Most Dangerous Metric",
  "url": "https://linearb.io/blog/why-agile-velocity-is-the-most-dangerous-metric-for-software-development-teams",
  "author": {
    "@type": "Person",
    "name": "Dan Lines"
  },
  "datePublished": "2020-05-12T00:41:00.000Z",
  "dateModified": "2020-05-12T00:41:00.000Z",
  "image": "https://assets.linearb.io/image/upload/v1720000000/Agile_Velocity_Linked_In_5a364e1957.png",
  "publisher": {
    "@type": "Organization",
    "name": "LinearB",
    "logo": "https://assets.linearb.io/image/upload/v1777485755/linearb-logo-2026.png"
  },
  "description": "Agile velocity is a useful tool for sprint planning. But when dev leaders use velocity as a productivity metric, it has dangerous consequences.\n"
}
```

## More on linearb.io

### Top navigation

- [Book a Demo](https://linearb.io/book-a-demo)
- [AI Code Reviews — Catch security risks, bugs, and spec mismatches](https://linearb.io/platform/ai-code-reviews)
- [AI & Productivity Insights — See how AI tools affect cycle time and delivery speed](https://linearb.io/platform/ai-developer-productivity-insights)
- [Measure AI Impact — Track AI adoption and tie it to delivery outcomes](https://linearb.io/use-case/measure-ai-impact)
- [MCP Server — Chat with your data to spot patterns and boost output](https://linearb.io/platform/mcp-server)
- [Resource Allocation — Cost initiatives and shape your investment strategy](https://linearb.io/platform/resource-allocation)
- [Cost Capitalization — Capitalize engineering costs with audit-ready reports](https://linearb.io/platform/cost-capitalization)
- [Dev Team Management — Set targets and tie throughput to business outcomes](https://linearb.io/platform/goals-and-reporting)
- [DevOps Workflow Automation — Policy-based PR routing, approvals, and tests](https://linearb.io/platform/ai-workflow-governance)
- [AI Powered Support — Unify AI and human code delivery in one clear view](https://linearb.io/use-case/ai-powered-support)
- [Optimization — Surface friction with feedback and MCP insights](https://linearb.io/platform/developer-experience)
- [Reporting — Spot what's working and what needs attention](https://linearb.io/use-case/measuring-developer-experience)
- [Surveys — Turn developer feedback into actionable signals](https://linearb.io/platform/developer-surveys)
- [Platform overview](https://linearb.io/platform/overview)
- [Register now](https://linearb.io/event/engineering-productivity-gap)
- [Customers](https://linearb.io/customers)
- [Pricing](https://linearb.io/pricing)
- [Why choose LinearB — Explore your data. Measure performance. Act to improve it.](https://linearb.io/why-linearb)
- [APEX framework — The operating model for AI-era engineering teams](https://linearb.io/resources/apex-framework)
- [Anti-FAQ — The questions other vendors won't answer](https://linearb.io/why-linearb/anti-faq)
- [Security — Enterprise-grade compliance and zero code access](https://linearb.io/security)
- [Build vs. buy — The hidden cost of building it yourself](https://linearb.io/resources/build-vs-buy)
- [Dev Interrupted Podcast — Conversations with engineering leaders](https://linearb.io/dev-interrupted/podcasts)
- [Reports & Guides — Deep dives on productivity and delivery](https://linearb.io/resources)
- [Webinars — Expert sessions on productivity and AI](https://linearb.io/resources?category=workshops)
- [Metrics Benchmarks — See how your engineering org stacks up](https://linearb.io/resources/software-engineering-benchmarks-report)
- [Blog — Product updates and practical insights](https://linearb.io/blog)
- [Help Center — Documentation, setup, and support](https://linearb.helpdocs.io)
- [API Docs](https://docs.linearb.io/api-overview)
- [Status](https://www.linearbstatus.com/)
- [Integrations](https://linearb.io/integrations)
- [LinearB is a Leader in the 2026 Gartner® Magic Quadrant™ for Developer Productivity Insight Platforms](https://linearb.io/resources/gartner-magic-quadrant-dpi-platforms-2026)
- [Sign in](https://app.linearb.io/login)
- [Enterprise](https://linearb.io/solutions/enterprise)
- [Contact](https://linearb.io/contact-us)
- [About us](https://linearb.io/about-us)
- [Careers](https://linearb.io/careers)
- [Service agreement](https://linearb.io/services-agreement)
- [Privacy policy](https://linearb.io/privacy-policy)
- [DPA](https://linearb.io/data-processing-agreement)
- [Security FAQ](https://linearb.io/security-faq)
- [Substack](https://devinterrupted.substack.com/)

### Footer

_Additional links from the site footer, not repeated from the top navigation above._

- [GitHub](https://github.com/linear-b)
- [LinkedIn](https://www.linkedin.com/company/linearb)
- [Twitter](https://twitter.com/LinearB_Inc)