Are your developers drowning in work but still missing deadlines? Do you struggle to articulate why your team needs more resources or automation tools? Or maybe you're trying to balance feature delivery with technical debt while keeping your engineers engaged and productive.
You're not alone. Engineering leaders across industries face these challenges, and Flow Metrics can provide a proven, data-driven approach to identify bottlenecks and optimize your software delivery pipeline.
In this comprehensive guide, you'll discover:
- What Flow Metrics are and why they're essential for modern software delivery
- How all five Flow Metrics impact your engineering effectiveness
- Practical strategies to implement and improve your metrics
- How Flow Metrics compare to other frameworks like DORA and SPACE
- Actionable ways to use these metrics to drive better business outcomes
Understanding Flow Metrics: From Lean to Software Delivery
Flow Metrics originated in Lean manufacturing and value stream management, focusing on the smooth, efficient movement of work through a system. Unlike manufacturing, software delivery doesn't produce physical goods, but the principles remain powerful when applied to code, features, and value delivery.
Flow Metrics emerged as a way to track and optimize the agile movement that was replacing traditional waterfall methodologies. They provide visibility into how work actually flows through development processes, helping teams identify and eliminate bottlenecks. The Flow Framework, formalized by Dr. Mik Kersten in his 2018 book "Project to Product," predates DORA metrics and offers a broader business-oriented view of software delivery. This framework tracks different types of work—new features, bug fixes, technical debt, and risk—measured against five metrics: velocity, time, efficiency, load, and distribution.
At its core, "flow" in software delivery refers to the movement of work from conception to production, with an emphasis on eliminating waste and maximizing value creation. This differs from the concept of individual "developer flow state" (the psychological state of focused productivity), though the two can be related.
What makes Flow Metrics particularly valuable is their focus on end-to-end business value measurement. While DORA metrics primarily focus on DevOps performance and track only a portion of the delivery pipeline (from when code is committed to when it's deployed), Flow Metrics connect development activities directly to business outcomes by measuring the entire value stream from ideation to production.
This holistic approach helps you identify where work stalls, where bottlenecks form, and which process improvements will have the greatest impact on your ability to deliver customer value.
The 5 Core Flow Metrics (With Real-World Examples)
Flow Time: Speed to Value
Flow Time measures how long it takes for an idea to travel from initial approval to production release. This comprehensive metric captures the total elapsed time, including both active work and waiting periods, giving you visibility into your true speed to market.
Flow Time is often synonymous with what many organizations call Lead Time, though different frameworks may use slightly different terminology. The key distinction is that Flow Time includes everything from when work is accepted into your value stream until it reaches the customer.
Unlike cycle time, which typically only measures active development time, Flow Time includes all the pre-development activities like planning, requirements gathering, and design work. This provides a more accurate picture of your actual delivery capabilities as an organization beyond just the engineering implementation phase.
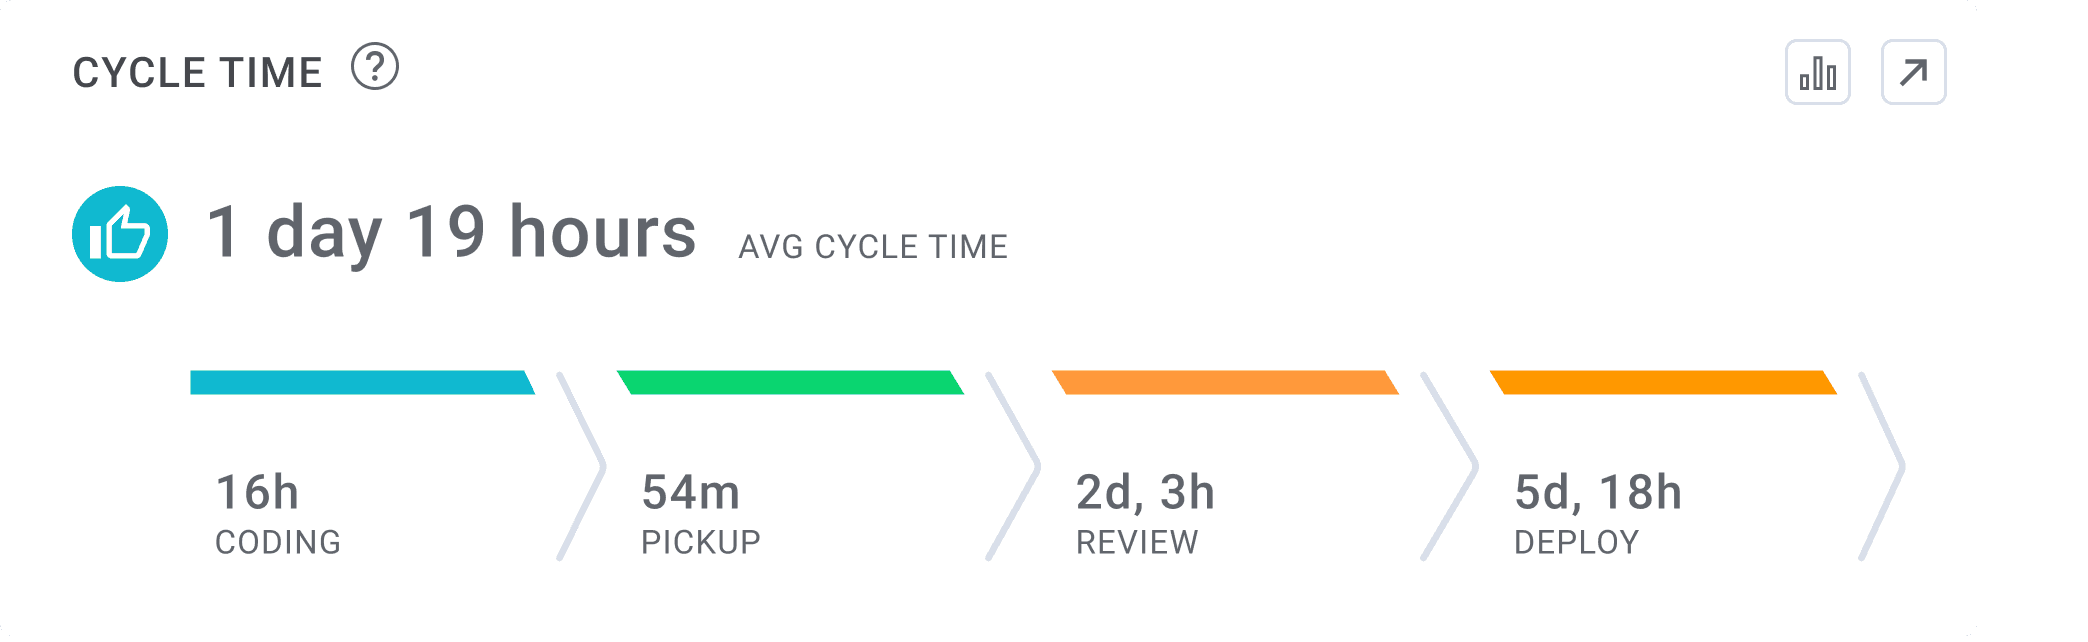
For example, imagine a critical feature that takes developers only two weeks from first commit to deployment (cycle time) but spends six weeks in planning, requirements gathering, design reviews, stakeholder sign-offs, and deployment windows before reaching production. Traditional development metrics might only show the two-week development period, but Flow Time reveals the true eight-week delivery timeline. By tracking Flow Time, you can identify these hidden delays in the entire value stream and address them directly.
Flow Velocity: Measuring Output
Flow Velocity tracks the number of flow items (features, defects, risks, or debt) your team delivers over a specific time period. This metric helps you understand your team's output rate and provides insight into delivery acceleration or deceleration trends.
What makes Flow Velocity powerful is its direct connection to business impact. By measuring the completion of value-driving work items rather than just code commits or story points, you gain a clearer picture of how development activities translate to customer value.
When a team doubles their velocity from 10 to 20 flow items per sprint, this acceleration directly impacts customer satisfaction by delivering more fixes and features in less time. It also provides a competitive advantage by bringing innovations to market faster than competitors. However, in this case, you’ll want to keep a keen eye on defects or bugs if you begin seeing a spike in velocity without a resourcing change.
Flow Efficiency: Reducing Waste
Flow Efficiency measures the ratio of active work time to total elapsed time for your delivery process. This powerful metric reveals how much time work items spend actually being worked on versus sitting idle in queues or waiting states.
Most engineering teams are shocked to discover their Flow Efficiency hovers between 15-25%, meaning that 75-85% of the time, work items are simply waiting. These wait states often stem from approval bottlenecks, code review delays, testing backlogs, or deployment queues.
Consider a team with just 15% Flow Efficiency. A feature that takes three calendar weeks to deliver only receives about three days of actual work. By tracking Flow Efficiency, you can identify these waste points and implement automation, process changes, or staffing adjustments to significantly increase throughput without burning out your team.
Flow Load: Managing Work In Progress (WIP)
Flow Load measures how much work your team is juggling simultaneously. This metric tracks the volume of active and pending work items across your development pipeline, providing insights into potential bottlenecks and team capacity issues.
High Flow Load indicates excessive Work In Progress (WIP), which leads to context switching, reduced focus, and ultimately, developer burnout. The cognitive cost of managing too many concurrent tasks creates significant productivity drags that often go undetected by other metrics.
When teams implement WIP limits of three tasks per developer, they often see dramatic improvements in both completion rates and code quality, not to mention developer satisfaction.
Flow Distribution: Aligning with Business Goals
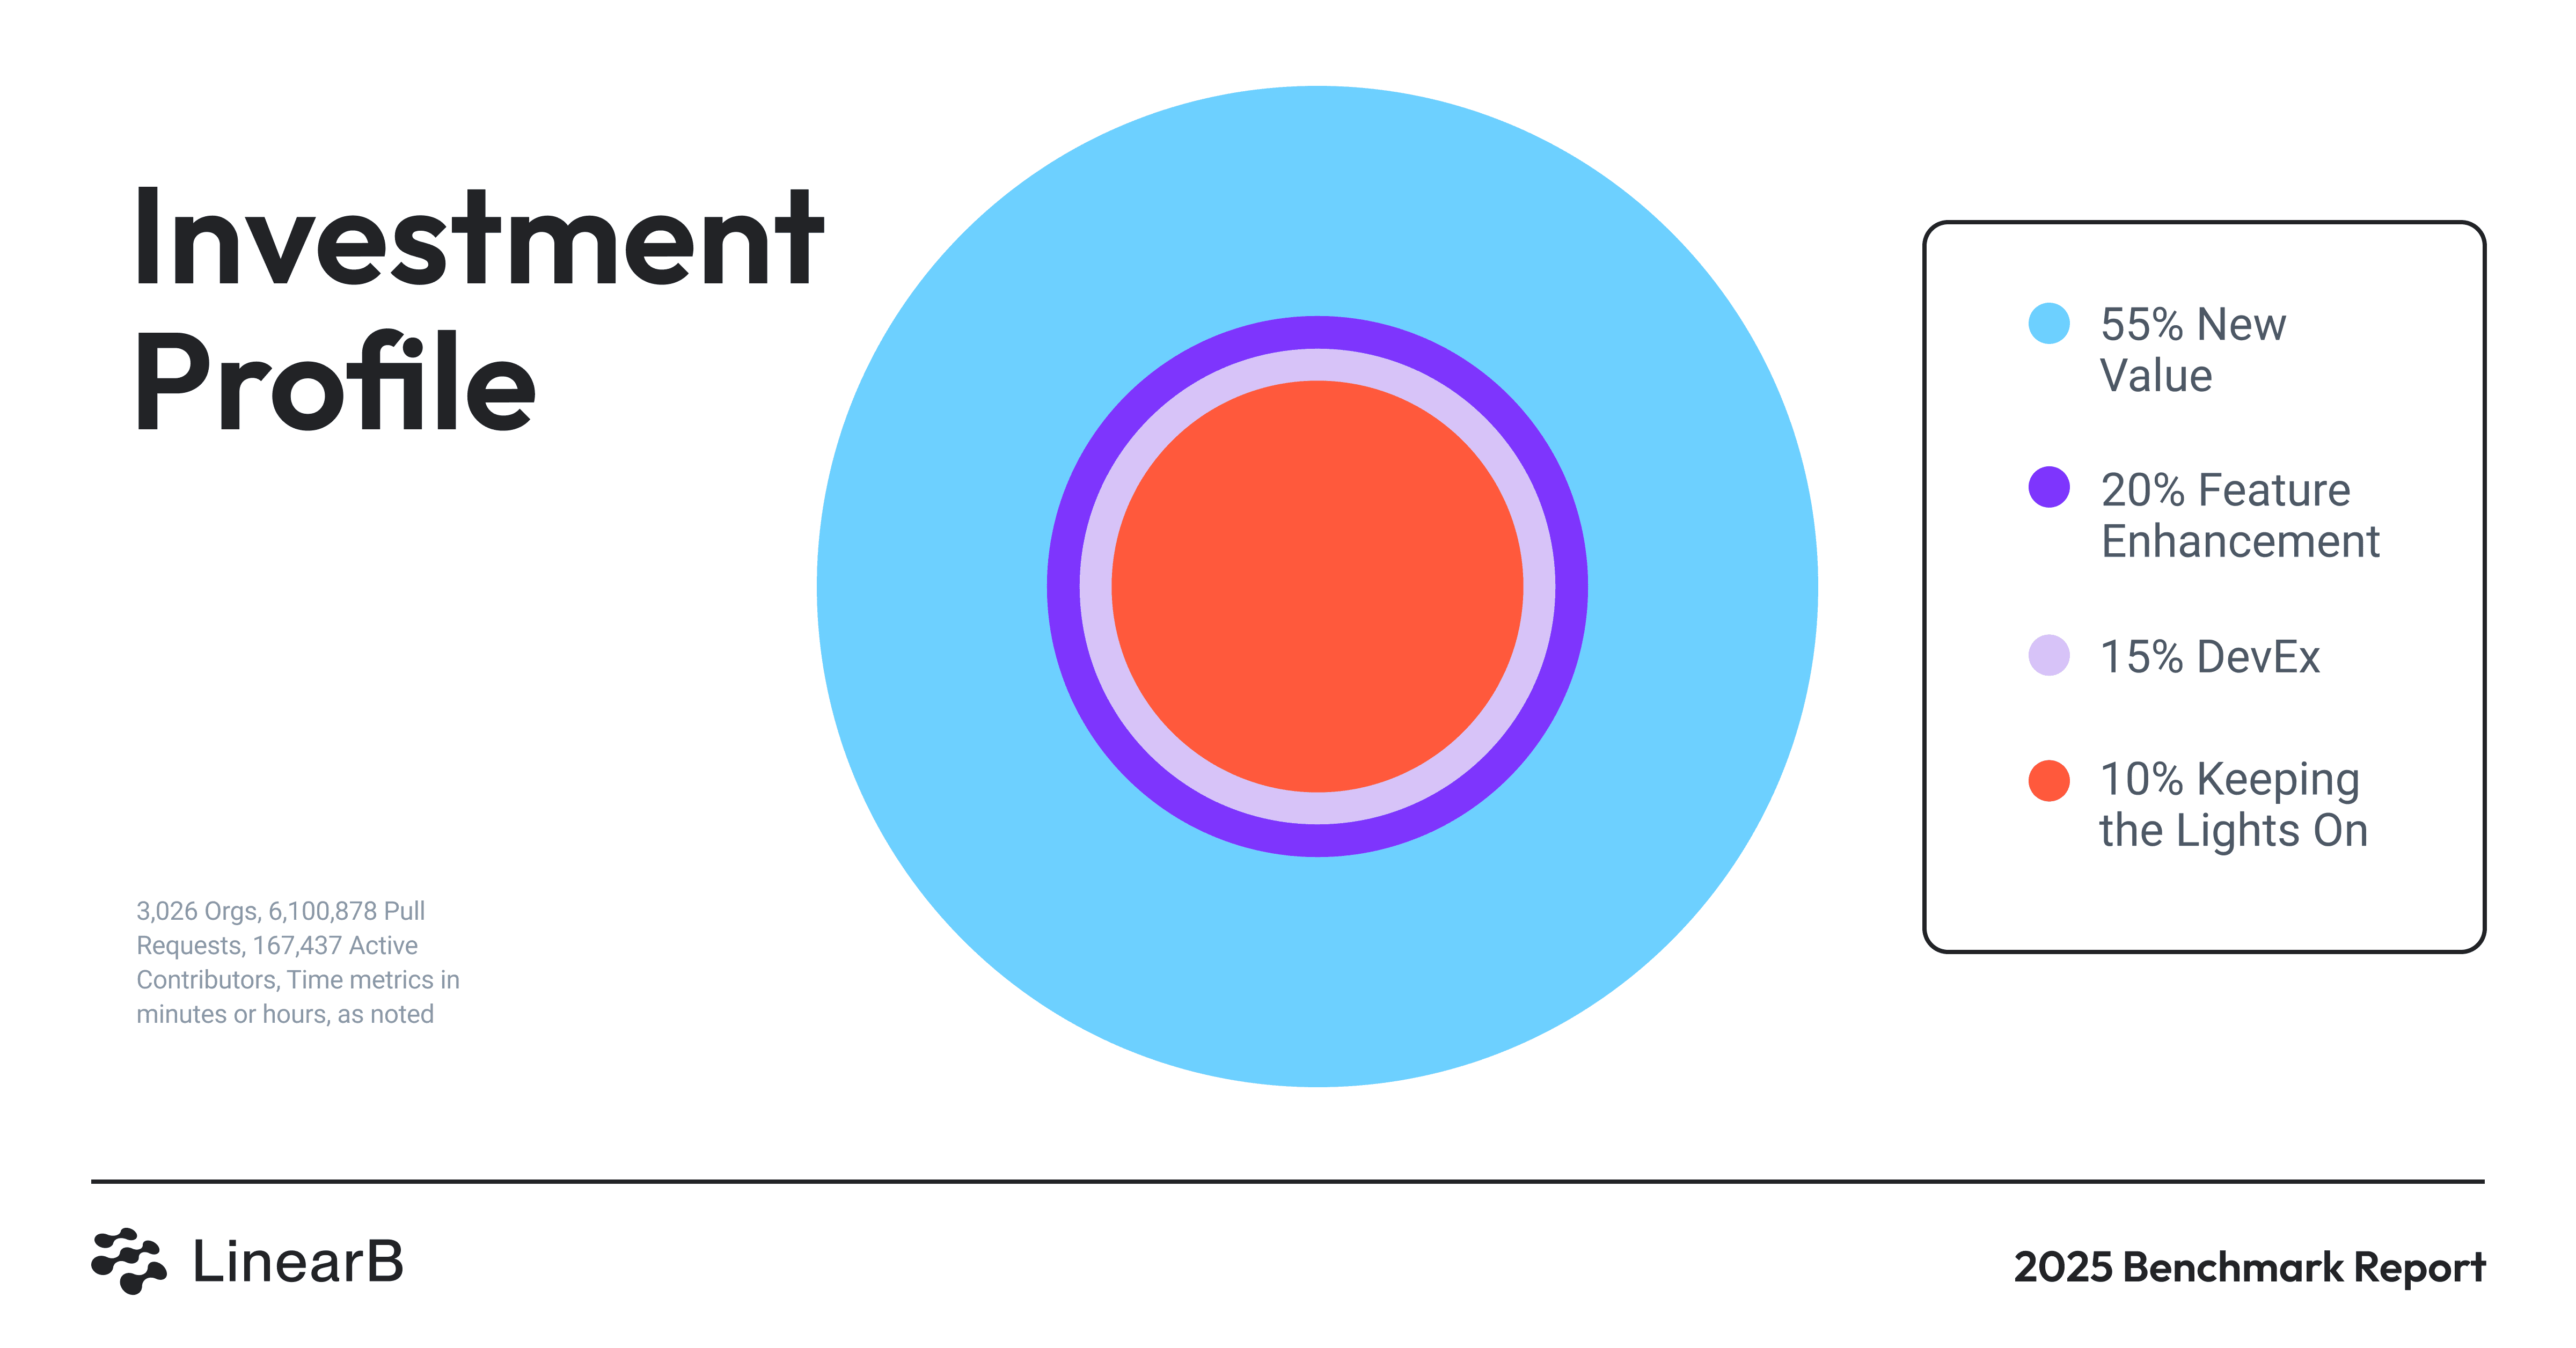
Flow Distribution examines the ratio between different types of work: features (new functionality), defects (bug fixes), risks (security and compliance), and debt (refactoring and infrastructure improvements).
This metric helps you ensure your engineering investment aligns with business priorities while maintaining proper system health. It provides visibility into whether you're balancing innovation with necessary maintenance work.
For instance, when a team directs 70% of their effort toward new features while neglecting technical debt, they might see short-term velocity gains. However, this imbalance eventually leads to increasing defect rates and diminishing customer satisfaction. Flow Distribution metrics would reveal this emerging problem before it becomes critical, allowing you to adjust priorities accordingly.
Quick Reference: Ideal vs. Risky Flow Distribution
Balanced Distribution:
- Features: 40-50%
- Defects: 15-25%
- Risks: 10-15%
- Debt: 20-25%
Risk Indicators:
- Features > 70%
- Defects > 30%
- Debt < 10%
Why Flow Metrics Matter for Engineering Leadership
For directors and VPs of engineering, Flow Metrics provide an essential bridge between technical execution and business outcomes. They translate engineering efficiency into business terms that executives across the organization can understand and support.
You can use Flow Metrics to translate exactly how engineering activities impact key business metrics:
- Flow Time directly correlates with time-to-market and competitive advantage
- Flow Velocity shows delivery capacity and potential revenue acceleration
- Flow Efficiency identifies cost-saving opportunities through process optimization
- Flow Load highlights resource utilization and potential burnout risks
- Flow Distribution reveals technical sustainability and potential quality issues
These metrics are particularly valuable during quarterly planning and resource allocation discussions. Instead of making subjective arguments for additional headcount or automation tools, you can present concrete data showing how specific investments will improve flow metrics and, consequently, business outcomes.
For example, when making the case for CI/CD automation investments, you can quantify potential improvements in Flow Efficiency and Flow Time based on current wait states. This data-driven approach makes it easier to secure executive buy-in for engineering initiatives that might otherwise be viewed as purely technical considerations.
Ready to translate engineering metrics into tangible business outcomes? Download our CTO Board Deck Template to turn technical metrics into KPIs and project updates that business stakeholders are most interested in:
Flow Metrics vs DORA, SPACE, and DevEx: Which Should You Prioritize?
Engineering leaders often wonder which metrics framework to adopt. Each has its strengths and intended focus, so understanding the differences helps you implement the right measurement strategy.
DORA metrics focus primarily on deployment throughput and stability—deployment frequency, lead time for changes, change failure rate, and mean time to recovery. These provide excellent visibility into DevOps health and the technical aspects of your delivery pipeline. However, they lack insight into business value alignment and upstream activities like requirements gathering.

The SPACE framework takes a more holistic view of developer productivity, measuring satisfaction, performance, activity, communication, and efficiency. This approach excels at tracking team dynamics and developer experience but doesn't directly connect to business outcomes or end-to-end value delivery.
Flow Metrics bridge this gap by focusing explicitly on customer-facing value delivery. They measure how work moves through your entire system, from idea to production release, revealing bottlenecks that other frameworks might miss. This end-to-end view makes Flow Metrics especially valuable for strategic decision-making and executive communication.
Tip: Use DORA for DevOps optimization, SPACE for developer experience improvements, and Flow Metrics for business value alignment and delivery tracking.
Rather than choosing between frameworks, consider how they complement each other. DORA metrics help optimize your technical delivery pipeline, SPACE metrics ensure your team stays productive and engaged, and Flow Metrics connect engineering work to business outcomes.
How to Use Flow Metrics to Improve Developer Productivity and Experience
Here are practical steps you can take to drive real improvements in both productivity and developer experience:
First, conduct Flow Time audits across teams to identify where work stalls in your delivery process. Map out the journey of a typical feature from inception to production, measuring time spent in each stage. This often reveals surprising bottlenecks in unexpected places, like waiting for security reviews or documentation updates.
Next, assess your current Flow Load to identify potential WIP overload. If engineers are juggling more than three concurrent tasks, implement WIP limits to reduce context switching. This seemingly simple change often produces dramatic improvements in both completion rates and developer satisfaction.
Use Flow Efficiency data to target specific automation or process improvements. When you discover that work items spend 80% of their time waiting in various queues, you can prioritize automating the most significant wait states—whether that's test automation, deployment pipeline improvements, or approval process streamlining.
Finally, tie Flow Distribution to your quarterly OKRs and planning process. For example, if you commit to a 10% quarterly focus on technical debt reduction, track your Flow Distribution to ensure you're meeting that target. This creates accountability for maintaining system health alongside feature delivery.
Flow Metrics Self-Assessment Checklist:
- Do you know your current Flow Time across different work types?
- Have you identified your biggest wait states with Flow Efficiency analysis?
- Are your WIP limits aligned with optimal Flow Load for your team size?
- Does your Flow Distribution match your strategic priorities?
- Are you tracking Flow Velocity trends to forecast delivery capabilities?
Best Practices for Implementing Flow Metrics
When implementing Flow Metrics, avoid these common pitfalls that can undermine your success:
Don't track metrics without clear action plans. Measurement alone doesn't improve performance, you need to establish improvement goals and specific initiatives tied to each metric. For every Flow Metric you track, define what "good" looks like and how you'll get there.
Avoid overemphasizing a single metric at the expense of others. For example, pushing for increased Flow Velocity without considering Flow Efficiency often leads to burnout and quality issues. The five Flow Metrics work together as a system, and optimizing one at the expense of others creates imbalance.
Keep stakeholder education ongoing, particularly with business partners who may not understand the technical implications of Flow Metrics. Create simple visualizations and regular updates that connect these metrics to business outcomes they care about, like faster time-to-market or reduced outages.
Integrate metrics tracking into your existing workflows rather than creating separate processes. Flow Metrics should enhance your Agile or DevOps practices, not compete with them. Look for tools that automatically extract Flow Metrics from your current systems without adding administrative overhead.
Tools and Frameworks for Flow Metrics Tracking
Effective Flow Metrics implementation requires the right tooling to collect data across your entire delivery pipeline. When evaluating Flow Metrics solutions, look for these key capabilities:
Comprehensive integrations with your existing tools, including Git repositories, project management systems like Jira, and CI/CD pipelines. These connections enable accurate measurement without manual data entry.
Automated insights that identify bottlenecks and suggest specific improvements. Basic dashboards show current state, but advanced tools provide actionable recommendations based on your metrics.
Developer experience visibility that connects team engagement with delivery performance. This correlation helps you understand how process changes impact both metrics and morale.
LinearB's Engineering Productivity Platform makes Flow Metrics actionable by connecting them directly to workflow automation and forecasting capabilities. With full visibility and control over your team's operations, you can define exactly how code is brought to production, maximize engineering productivity, and actively improve flow through targeted interventions. This helps you enhance developer efficiency, effectiveness, and experience while driving better business outcomes.
Building a Developer-Centric Productivity Strategy
Flow Metrics provide a powerful framework for understanding your delivery pipeline, but visibility alone isn't enough. Actual improvement happens when you combine metrics with automation to take immediate action on the insights you discover.
While measuring Flow Metrics helps identify bottlenecks, workflow automation lets you actively remove those bottlenecks. This might include automatically routing pull requests to the right reviewers, streamlining merge paths for simple changes, orchestrating test enrichment, or automatically flagging security-sensitive code for additional review.
Start by measuring your current Flow Metrics to establish a baseline. Then, implement targeted automations that address your biggest pain points. This approach takes passive observation into active intervention, empowering your developers to focus on high-value work while automation handles the rest.
Remember, the goal isn't just faster delivery—it's delivering more value with less waste and greater predictability. By combining Flow Metrics visibility with workflow automation, you create a development environment where your teams can do their best work without getting bogged down in process friction or manual interventions.
Learn how you can get started today →
FAQ
What are the 5 Flow Metrics?
The five Flow Metrics are Flow Time (total elapsed time from idea to production), Flow Velocity (completion rate of work items), Flow Efficiency (ratio of active work to waiting time), Flow Load (amount of work in progress), and Flow Distribution (balance between different work types like features, defects, risks, and debt).
How do Flow Metrics improve software development?
Flow Metrics improve software development by identifying specific bottlenecks in your delivery process, reducing wait states, optimizing work in progress levels, ensuring balanced investment across work types, and connecting engineering activities directly to business outcomes.
How are Flow Metrics different from DORA metrics?
DORA metrics focus on deployment throughput and stability (deployment frequency, lead time for changes, change failure rate, and mean time to recovery), while Flow Metrics measure end-to-end value delivery across the entire development lifecycle, including upstream activities. DORA emphasizes DevOps health, while Flow Metrics connect more directly to business outcomes.
What is the Flow Framework in agile?
The Flow Framework is a value stream management approach developed by Dr. Mik Kersten that uses Flow Metrics to optimize software delivery. It connects technical work to business results by measuring how value flows through the software delivery process, helping organizations achieve better business outcomes from their technology investments.
How can you measure Flow Efficiency?
Measure Flow Efficiency by dividing active work time by total elapsed time for work items. Track when items are actively being worked on versus sitting in queues. Most teams find their Flow Efficiency is between 15-25%, meaning work items spend 75-85% of their time waiting rather than being actively worked on.
What is the difference between cycle time and flow time?
Cycle time typically measures the development process from code commit to deployment, while Flow Time captures the entire journey from initial idea approval to production release. Flow Time provides a more comprehensive view by including upstream activities like requirements gathering and design, as well as deployment and validation steps.