

You took up a sprint commitment and want to be sure you deliver on time. What’s the best way to go about achieving that? Well, you can use Agile velocity and capacity to estimate delivery. But is that really the best way? Sure, they can give you a ballpark idea of your project’s progress, but you can do better.
At LinearB, we’ve come up with a more effective way for you to estimate your project delivery. But let’s take it one thing at a time and talk about Agile velocity vs capacity first.

What Is Agile Velocity?
Agile velocity measures the amount of work a team can complete within a given period—typically one iteration or sprint. You usually express velocity in terms of story points. Story points are units of measure that consider a task’s complexity and size.
To calculate velocity, simply add up the story points for all the backlogs completed in a sprint. For example, let’s say your team finished three backlogs in a sprint. Each of these backlogs is worth two story points. The team’s velocity would then be six (2×3) points.
Ideally, you can average the velocity over four to five sprints. This will smooth out any variance and give you a more accurate picture of your team’s performance. But this won’t help you deliver on your sprint commitments properly.
Take it from the pros, and hear what the Director of Engineering at StackFlow, Ben Matthews, has to say as he explains his POV on velocity.
Limitations of Agile Velocity
While agile velocity can be a helpful metric, it has 2 key limitations:
1. It’s a Lagging Indicator
Agile velocity only tells you how much work a team has completed in the past. It doesn’t predict how much work the team will be able to finish in the future.
2. It Doesn’t Consider Changes in Scope
Agile velocity only measures the work initially planned for a sprint. But your sprint will always have unplanned work. As a result, using velocity to predict delivery based on estimated story points for a future sprint will never be accurate. In fact, our research shows that the industry average for planning accuracy is below 50%!
It then goes without saying that velocity isn’t an ideal metric. And if you use it to estimate project delivery, you’ll get awful results. So let’s take a look at capacity, and see whether it’s a better metric for your team.
What Is Capacity?
Capacity measures the amount of time your team has available to work on sprint tasks. You often use capacity to estimate how much future work a team can take on. Additionally, this metric can help you determine whether your team is overloaded or has enough capacity to meet its goals. You typically express capacity in terms of hours or days per sprint.
To calculate capacity, add up the hours or days your developers are available during a sprint.
For example, let’s say your team has five developers. Each of these developers is working six hours a day. The team’s capacity would then be 30 hours per day (5×6). In a five-day work week, capacity would be 150 hours per week (30×5). If the sprint duration is two weeks, the sprint capacity would be 300 hours (150×2).
Make sure you use the hours or days available for development work. Don’t include the times when your developers are taking time off! Otherwise, this will be detrimental to your culture. For example, if one of your five developers is taking a week-long vacation during your next sprint, you have to factor 30 fewer working hours into your sprint capacity.
Limitations of Capacity
Capacity will help you know how much work your team can deliver in a sprint. But it also has 2 key limitations:
1. It Only Takes into Account the Time Available for Development Work
It doesn’t consider other essential activities, such as meetings and code reviews. If you don’t pay attention, you can push your team to improve their coding capacity but neglect the other essential aspects of your software development lifecycle.
2. It Doesn’t Account for Different Productivity Levels
Different developers have different levels of productivity. A more experienced developer will complete more tasks than a less skilled developer in the same amount of time.
In our experience, capacity only pins down your team with an unrealistic delivery date. It just creates false expectations, and we don’t like that. That’s why we took matters into our own hands and created tools to help you improve your planning accuracy. But we’ll talk about this a bit later.
So, if Agile velocity and capacity alone have shortcomings, what would happen if you use them together?
Combining Agile Velocity and Capacity to Estimate Your Project Delivery
Although we’ve been talking about Agile velocity vs. capacity, it’s a common practice to try to use them together. It’s supposed to help plan and estimate your software projects’ delivery.
Let’s talk about the theory behind this. When you know your team’s velocity, you can estimate how much work they can complete within a given sprint. And when you understand your team’s capacity, you can measure how much time they have available to work on tasks.
So in theory, if you know how much work your team typically completes in an average sprint, you know their average capacity per sprint, and you know how much work is remaining to complete project XYZ, you should be able to predict a project delivery date, right?
Actually, this is not as reliable as it seems. Let’s see why.
Limitations of Using Agile Velocity and Capacity Together
1. They’re Historical Measurements
Agile velocity and average capacity are based on historical data. And even if you have an estimated sprint capacity for the upcoming sprint based on planned time off, you can’t predict if a developer will get sick within those two weeks. So you definitely can’t use it over multiple future sprints.
That’s the core problem with using them together. You can’t use them to estimate the delivery for future projects unless your team’s velocity and capacity remain the same.
But this isn’t the norm. Think about it; has your team’s capacity and velocity ever stayed the same from sprint to sprint? We’re guessing, no.
2. They Don’t Account for Dependencies
Additionally, velocity and capacity don’t consider that some tasks can depend on others. For example, one task can be blocking another task. So you can’t start the second task until you complete the task that’s causing the bottlenecks. This can obviously become incredibly frustrating if you’re pushing to move on to the second task. As a result, your estimated project delivery won’t be accurate.
3. They’re Erroneous Measurements
And the final thing, both Agile velocity and capacity measure the potential output. They don’t guarantee your team will achieve that output. So many factors also affect your team’s ability to complete tasks. Complex tasks take up more time than expected. External distractions may also steer you away from predictions. So what good can it be to estimate project delivery based on something variable?
Agile velocity and capacity aren’t ideal. You shouldn’t rely on them to estimate project delivery. So what can you use instead?
How to Move Beyond Agile Velocity and Capacity
To get a more accurate picture of your project’s health, it’s essential to move beyond agile velocity and capacity. How so?

Use Leading Indicators
Leading indicators are measures that can predict future performance. In contrast to agile velocity, which is a lagging indicator, leading indicators can give you a more accurate picture of your team’s potential.
Here are a few leading indicators you could use:
Cycle Time
Cycle time measures the time elapsed from the moment you begin working to the moment you deliver code. Your cycle time also includes many phases of peer review. If you have a longer cycle time, you will probably face more bottlenecks, and your predictions will be inaccurate.
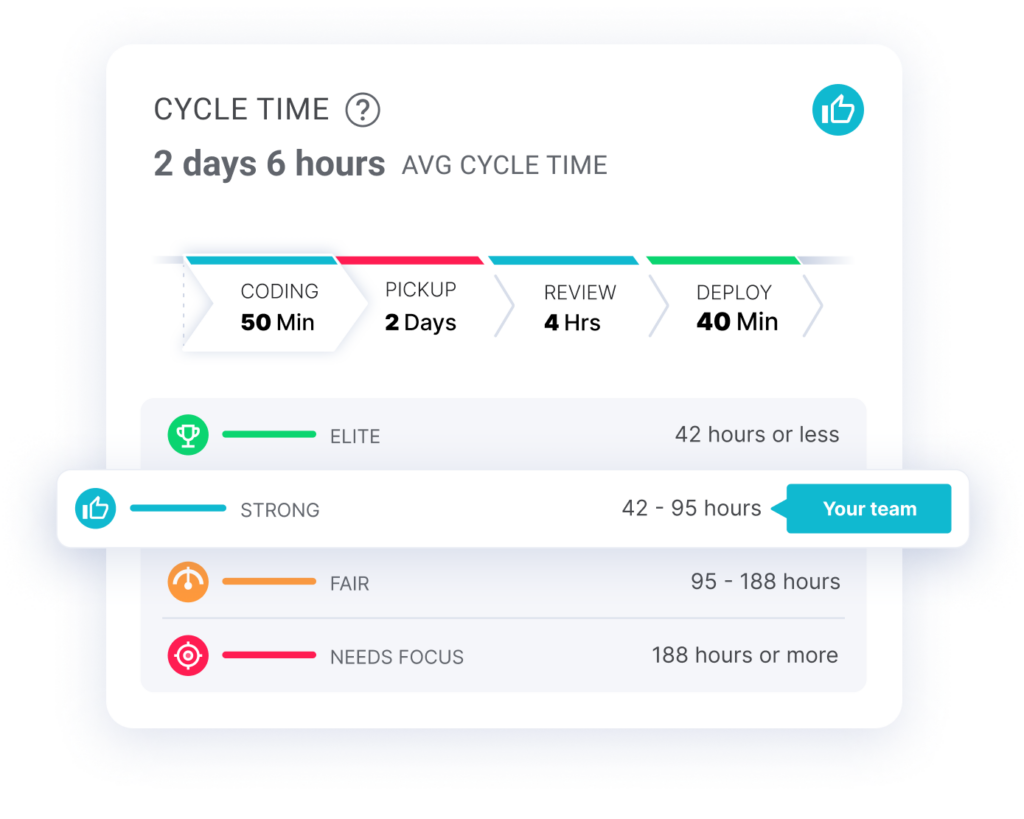
For instance, the average cycle time is 7 days, meaning if you don’t start working on a task within the first week of your two-week sprint, it’s unlikely that it will get done on time. That’s why you can use LinearB to help you shorten cycle times and identify roadblocks!
Work in Progress (WIP)
The WIP is the number of tasks currently being worked on. Measuring WIP can help you identify bottlenecks and potential sources of project delays. And the best way to view your WIP is with LinearB’s Pulse dashboard. This dashboard syncs your Git activity with your issue tracking, so you can see WIP, tasks to do, and stuck PRs in real-time.
Use Project Delivery Tracker
We know you’re sick of being asked by stakeholders when project XYZ is going to be delivered. And we know that you’ve probably felt the embarrassment of missing a promised delivery date based on the velocity + capacity method.
That’s why we created Project Delivery Tracker. It gives you the data you need to open up the conversation around project delivery.
Check out these 3 features:
Investment Profile
Investment profile helps you see what type of work your team is investing in. For stakeholders, knowing that 25% of the work is on bugs may be eye-opening. Some common categories are stories, non-functional story work, or bugs, but it’s entirely customizable.
And once your stakeholders know what all of your categories mean, you’ve switched into a more productive conversation around how to balance competing priorities to drive the best result for your customers and the company.
Project Allocation
Project Allocation will show you how much of your team is working on each project. This helps you know how much work your team can take on.
But it’s also important for stakeholders because it reveals if your team is giving enough attention to project XYZ and other things that are the most important to the company. You may be focused on delivering more features, but it doesn’t matter if they’re the “wrong” ones.
Project allocation is critical for having a data-driven conversation around how to balance competing priorities and finite resources.
Planning Accuracy
Planning accuracy helps you see if you’ll deliver a project’s features on time. With this tool, you can see project trends at a glance, so you can better estimate your capabilities. For example, it’s impossible to deliver the features you promised the company this quarter if the teams contributing to those projects are only delivering half of what was planned every two weeks.
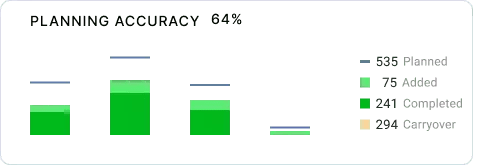
Additionally, Project Delivery Tracker also shows you the things that can affect your project delivery times, like carryover or unplanned work. You may realize you’re not allocating for the inevitable unplanned work and overplanning each sprint. Or you may realize that you’ve got an issue with added work always being labeled a bug so it gets prioritized when it really shouldn’t be. Once again, this gives you data needed to review priorities and processes.
Better Predict Your Value Delivery
The end game is always to deliver what you’ve promised, on time. The old-school method of using agile velocity and capacity to estimate has failed to deliver time and time again. The best way to predict your value delivery is to:
- Start looking at leading indicators that help mitigate risks and bottlenecks
- Open up the dialogue with stakeholders about competing priorities
- Improve your planning accuracy so you can deliver on promises


