

Knowing your team’s capacity is a crucial part of sprint planning. But it is also one of the hardest things to get right as a team lead or Scrum coordinator (formerly known as the Scrum master). Most teams still rely upon imprecise methods that result in something closer to guesswork than informed predictions.
In this post, we’re going to look at how elite teams use data to measure their capacity and plan their sprints more accurately.
Sprint Planning Fundamentals
Sprint planning is the process of selecting the product backlog items to move to the sprint backlog which the team will complete during the upcoming sprint. (To learn more about the sprint planning meeting, check out our dedicated post on the topic.)
This requires knowing two things about each item:
- How important it is
- How much work it will take to complete
Sprint capacity is concerned with that second dimension, which in Scrum is called the scrum estimate.
Scrum Estimates
There are different methodologies that product owners use to assign scrum estimates. The two most common are:
- T-shirt sizing: You assign a t-shirt size (small, medium, large, etc.) to each item. The larger the size, the larger the scrum estimate and the more effort the item requires.
- Story points: You assign a number of “story points” to each item which indicates the amount of effort it requires. Story points are superior to t-shirt sizing for a number of reasons. One of its main advantages is that it allows you to more precisely capture the relative amount of work for each item. This means that an item worth 4 story points should take the same amount of effort as two items worth 2 story points each.

Sprint Capacity
You’ve made your scrum estimates, so you know how much work each item will take.
Now need to know how much work you can complete in a sprint. In other words, you need to determine your team’s sprint capacity.
Capacity is expressed in hours. If you’re measuring capacity for the first time, here’s a simple equation that you can start with:
Number of team members * days in the sprint * 6.5 working hours per day = sprint capacity
You may be wondering why we’re using 6.5 hours per day instead of 8. Project managers and other Agile practitioners have learned that people rarely get a full 8 hours of focused work in a day. They have meetings, interviews, interruptions on Slack, or any number of things that take up their time. This adjustment takes into account the Focus Factor.
Let’s a calculate the sprint capacity for an example Scrum team that has 8 developers that uses three-week sprints:
8 team members * 15 days * 6.5 hours per day = 780 hours of sprint capacity
Sprint Velocity
Roughly speaking, sprint velocity is the rate at which your team can get work done.
Many Agile teams don’t track sprint velocity, instead relying upon a vague sense of how many story points they’ve completed during previous sprints. But this leaves a number of key questions unanswered:
- What’s your true average velocity across sprints and how does it compare to the sprint velocity you’re aiming for?
- Which user stories did you complete?
- Which kinds of issues were completed?
- Why does your sprint velocity vary across sprints?
LinearB enables you to answer these questions, more precisely measure your sprint velocity, and deeply understand what is driving it, including the bottlenecks that are slowing it down.
Our Investment Profile metrics shows you detailed information about which items your team tackled during a sprint so that you can know precisely how many story points they completed. LinearB also categorizes issues by type, functional story, non-functional story, bug, etc. This enables you to know not just how fast your team is moving but also what they are accomplishing: Going fast in the wrong direction is useless.
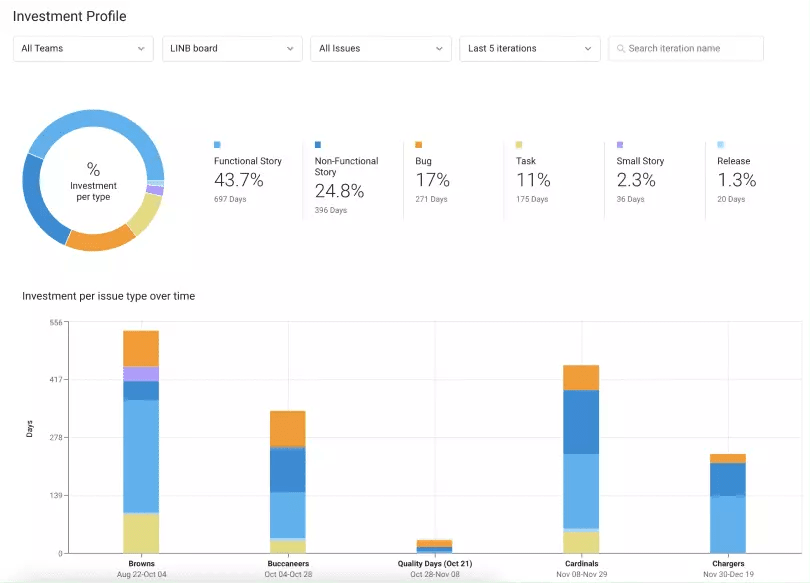
With our People Effort metrics, you can also get a better handle on how much time your team actually spent on different projects and issues. You can see whether members of your team were prevented from achieving story points in the sprint because they got pulled into other things like fixing bugs or meetings.
![]()
Protecting Your Team
I want to be clear on this point: People metrics should not be used to rank developers on your team. This only leads to harmful competition, a breakdown in team culture, and team members gaming the numbers which ruins the value of the data.
Kathryn Koehler, Director of Developer Productivity Engineering at Netflix, elaborated on why we should not stack rank developers:
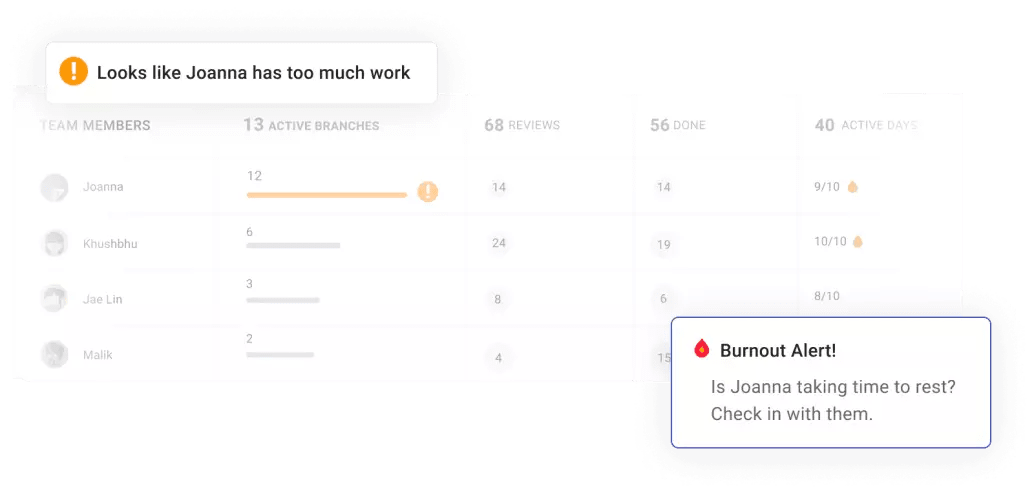
People metrics should be used to protect developers. This is especially pertinent when trying to raise your team’s development velocity because you want to prevent your team from getting overworked. LinearB helps you prevent burnout with automated alerts that inform you when a member of your team maybe has too much on their plate.
Improving Planning Accuracy
How great is it when you can confidently tell people exactly when a certain feature is going to be shipped?
The ultimate goal of accurately gauging sprint capacity and sprint velocity is to enable you to accurately plan your sprints and deliver on your promises.
When you can plan better, you can reduce stress on your team and set more readily-attainable sprint goals which will boost your team’s feelings of achievement, success, and their confidence. And when you can consistently deliver on your sprint commitments, you can drive alignment with other parts of the company. Higher planning accuracy is a win-win-win-win…
LinearB makes it easy to track how well you are planning. First, there’s our straightforward Planning Accuracy metric, which you tells you at a glance – you guessed it – how accurately you’re planning.
We also make it easy to dive deeper into the data to understand why your planning accuracy is less than ideal. Perhaps you are consistently overestimating your team’s capacity or perhaps high numbers of unexpected issues keep cropping up during sprints. Whatever the cause, LinearB makes it easy to investigate.
But how do you know what’s a “good” planning accuracy figure? LinearB analyzed data from almost 2,000 engineering teams to establish benchmarks for key engineering metrics, including planning accuracy:
I was surprised to learn that even the best teams have a planning accuracy of just 80%. Planning accuracy is indeed really hard!
Make Sprint Planning So Much Easier
Because sprint planning can be so hard, most teams don’t seriously try to get better at it. This is a shame, because better sprint planning leads to so many downstream benefits, for dev teams and organizations as a whole.
LinearB makes it easy to leverage the data you need to better gauge key metrics like sprint capacity and sprint velocity – and we don’t stop there. LinearB empowers you to drive sustained improvement at each stage of the development process.


