

AI has been universally adopted, and token costs continue to rise. In recent months, AI budgets have gone from a rounding error to something that every executive is paying attention to, and they've started asking questions. You already know the investment is doing something, because your teams are shipping more. Work that used to take a sprint happens in a few days, and your senior engineers spend less of the week on boilerplate.
But this isn't enough. We've heard from our customers that they need a consistent way to measure token spend against engineering impact. That's why today, we're launching the AI ROI dashboard in LinearB, live now for every customer with metrics builder enabled.
The dashboard provides one number you can put in front of your executive team. You can find it in the LinearB catalog section of the Metrics Builder.
Report the total value gained from your AI investments
At the highest level, the new AI ROI dashboard shows you the total value that your AI investment has returned over a period.
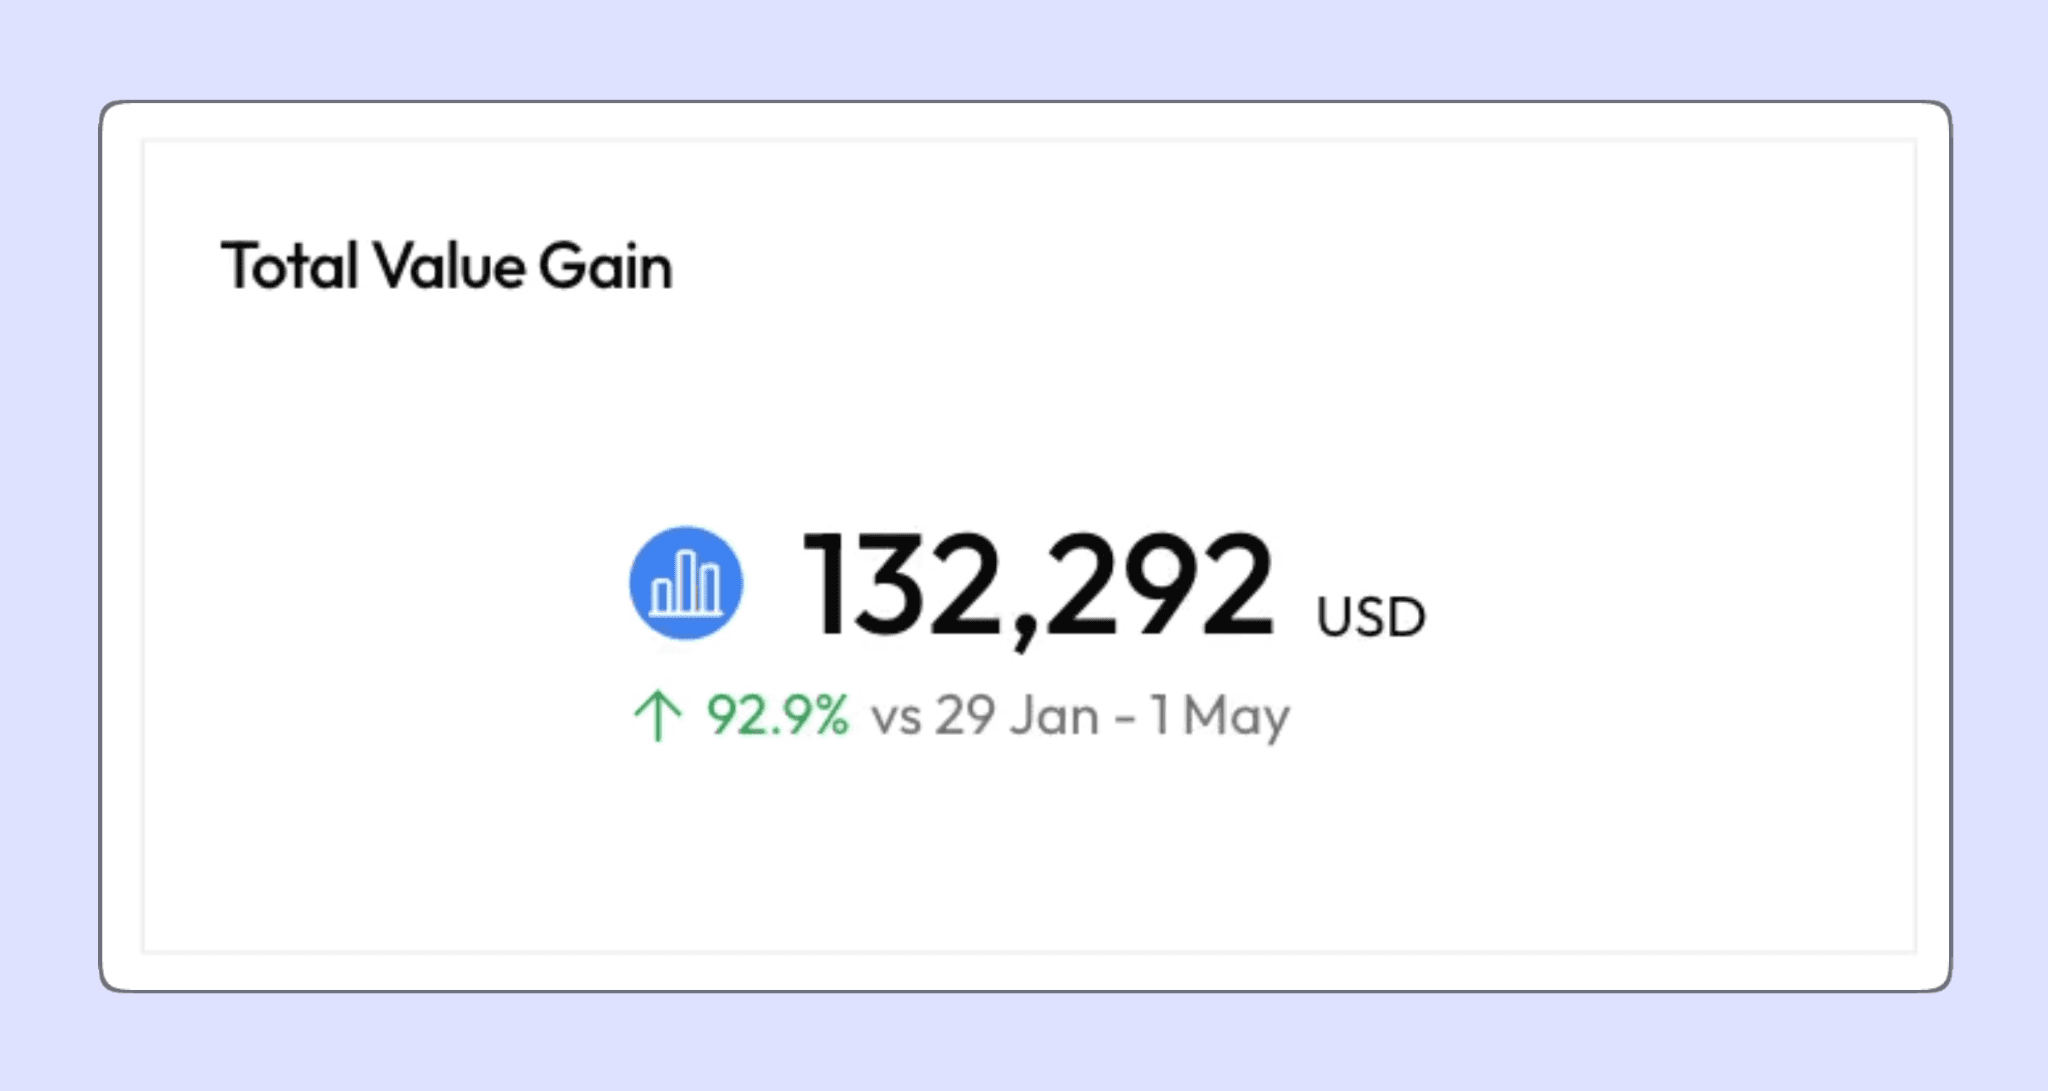
The dashboard takes the drop in your cost per effective PR between two periods and multiplies that saving across the PRs you delivered in the current period.
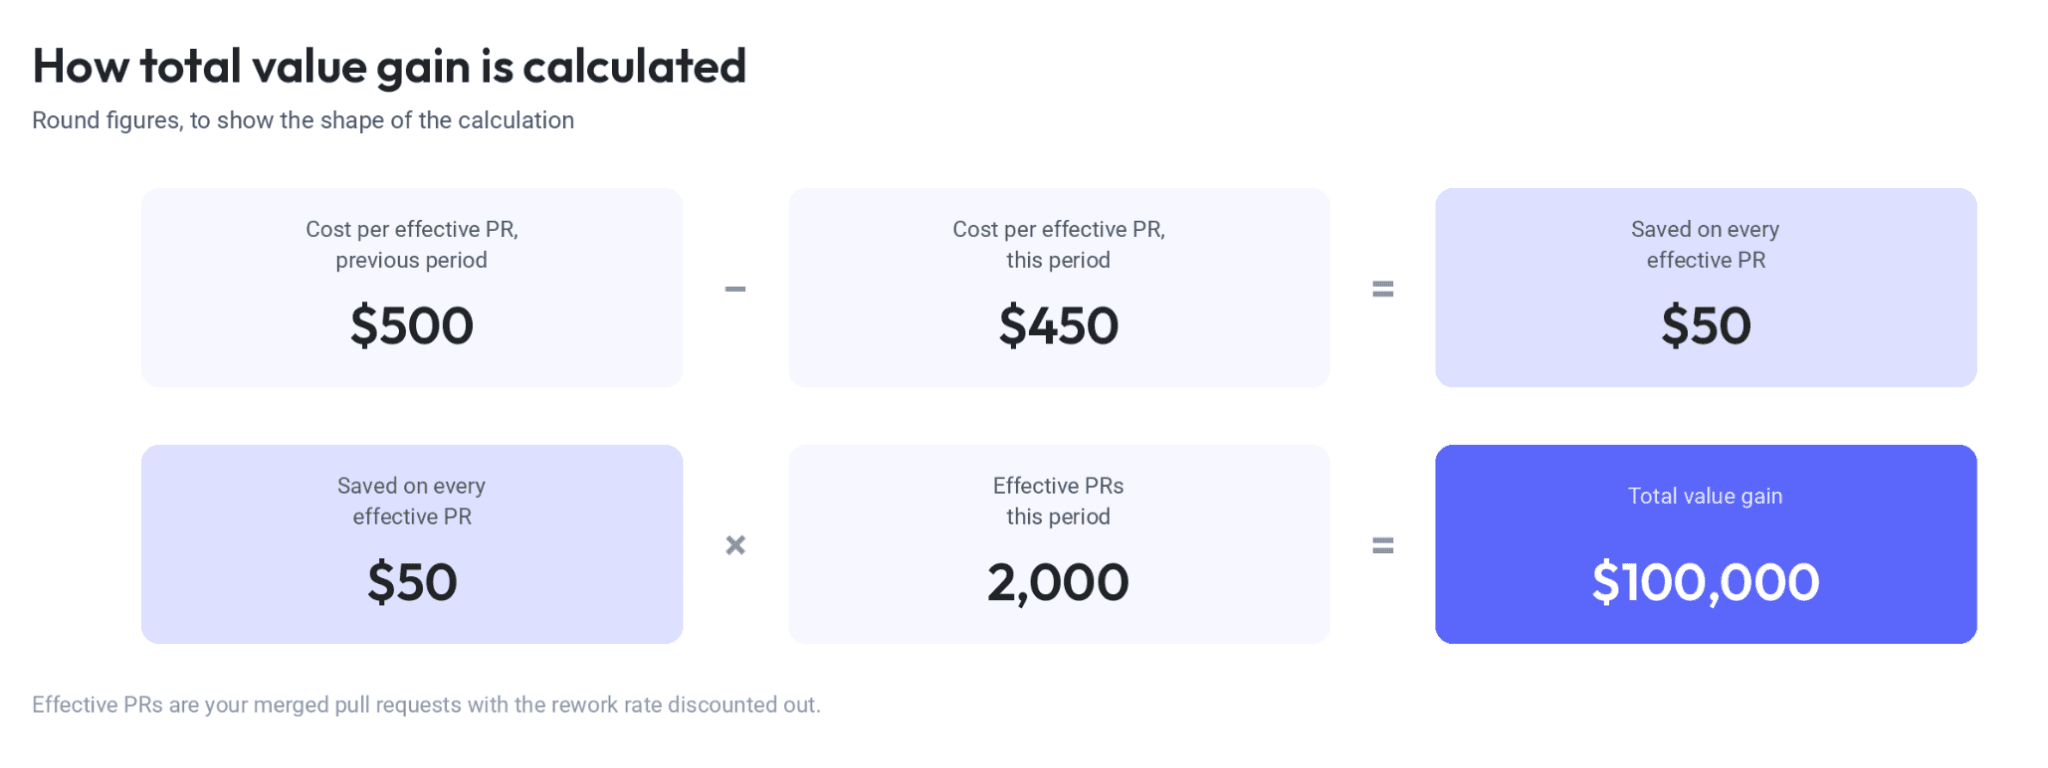
Total value gain is the metric you can confidently present to your executive team. When AI spend shows up on your invoice, you can use this number to tie that cost to engineering activity.
Measure what a delivered pull request actually costs
Cost per effective PR divides your total engineering cost, people, and AI together, by your effective PRs. Effective PRs are the pull requests you merged, with your rework rate discounted from the total, so it accounts for work that has to be redone
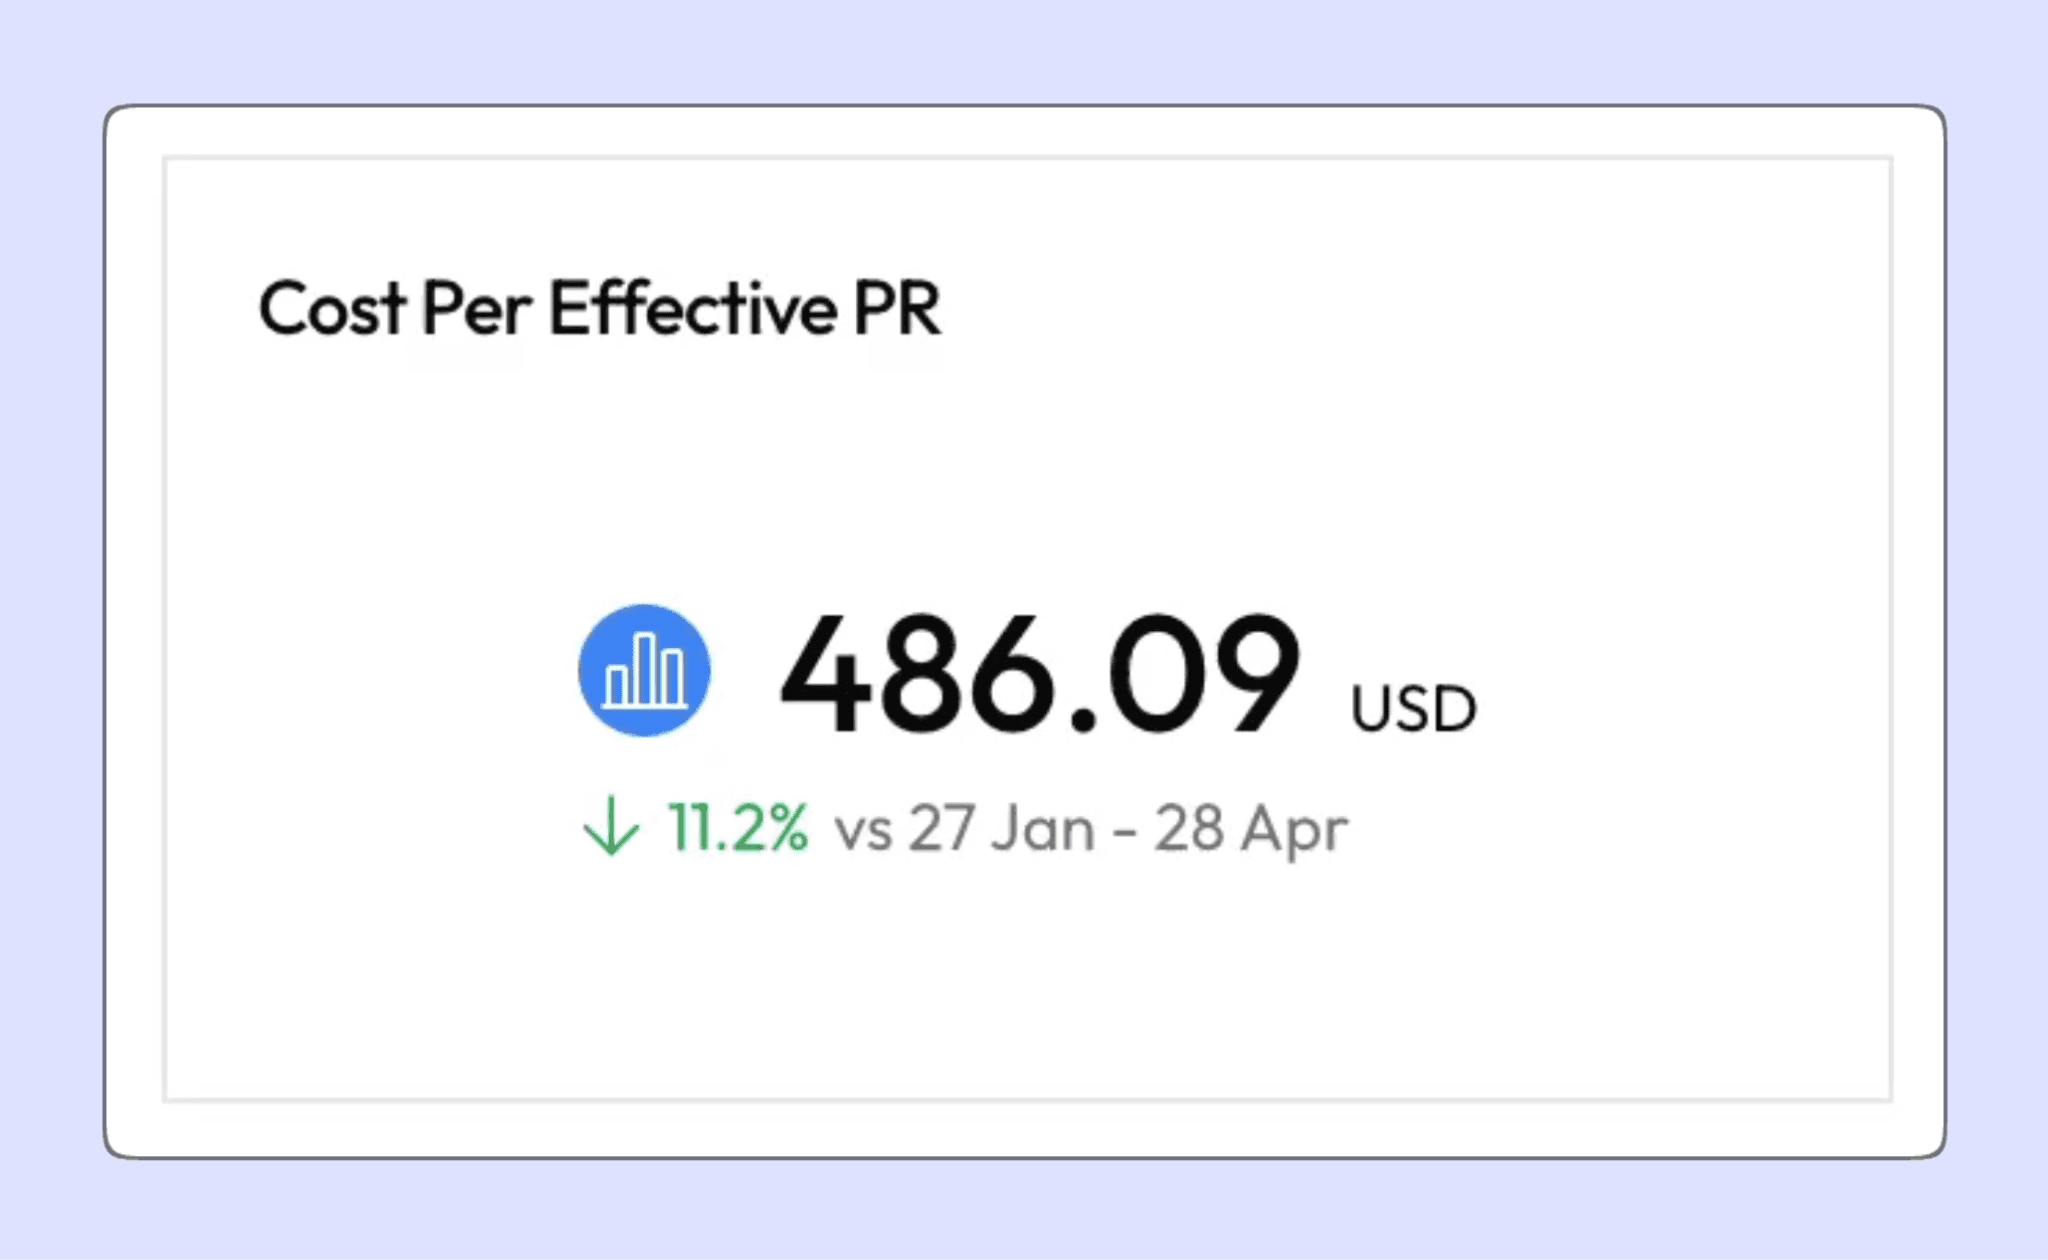
For AI-generated code, this is the distinction that matters. Your engineers account for most of the work's cost, so it's critical to analyze how they spend their time as part of the cost calculation. This is a good metric to monitor as a trend rather than a snapshot.
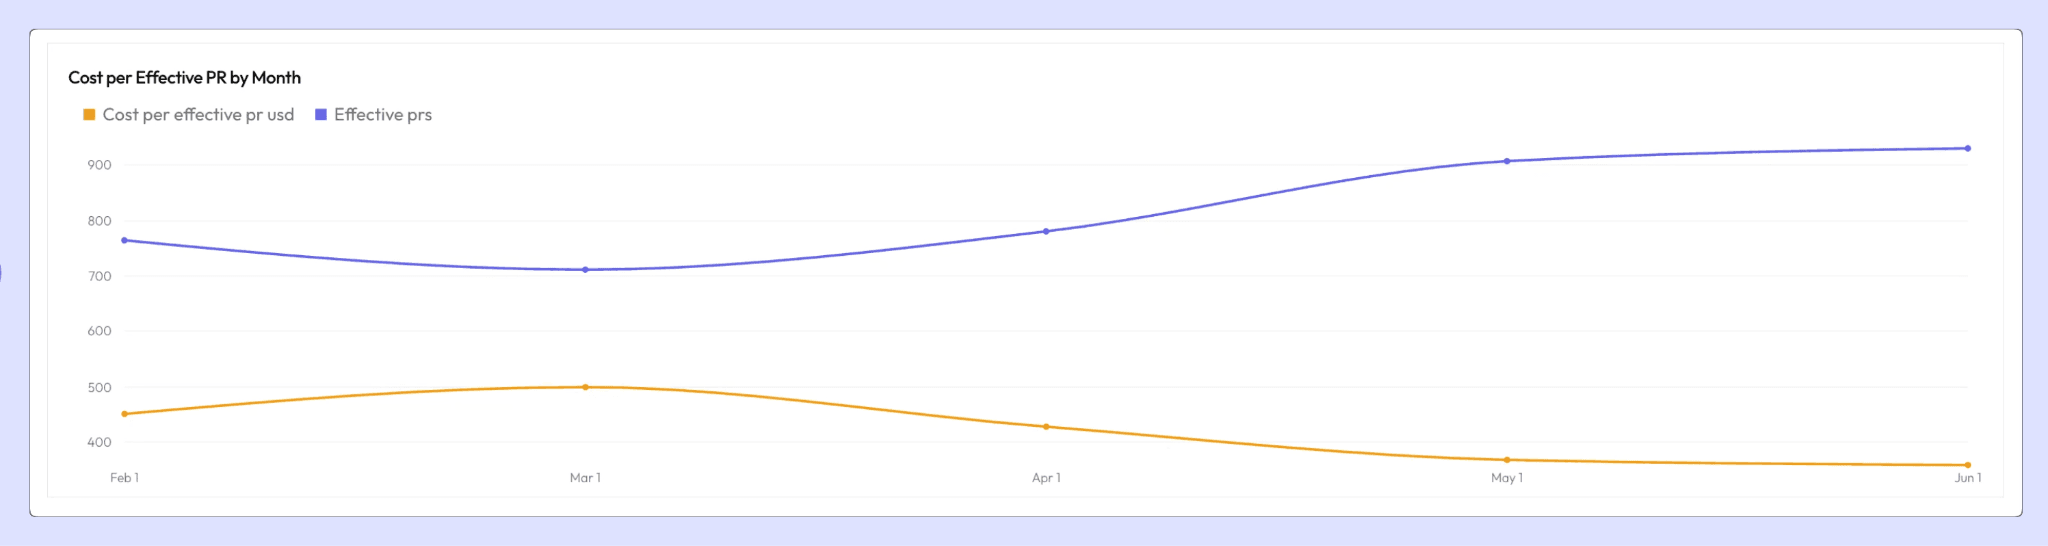
Tracking AI ROI using this method helps normalize for increases in headcount and changes in software quality. Over time, you want to see the cost per effective PR decrease while the effective PRs increase.
Track the velocity gains from leveraging AI
PRs merged are a good first step to measuring development velocity. Total effective PRs and effective weekly PRs per developer tell you how much of your team's work translated into production value. LinearB research on the emerging engineering productivity gap AI is creating found that the merge rate for the highest cohort of AI users more than doubled year-over-year, while developers who don't use AI saw little to no change.
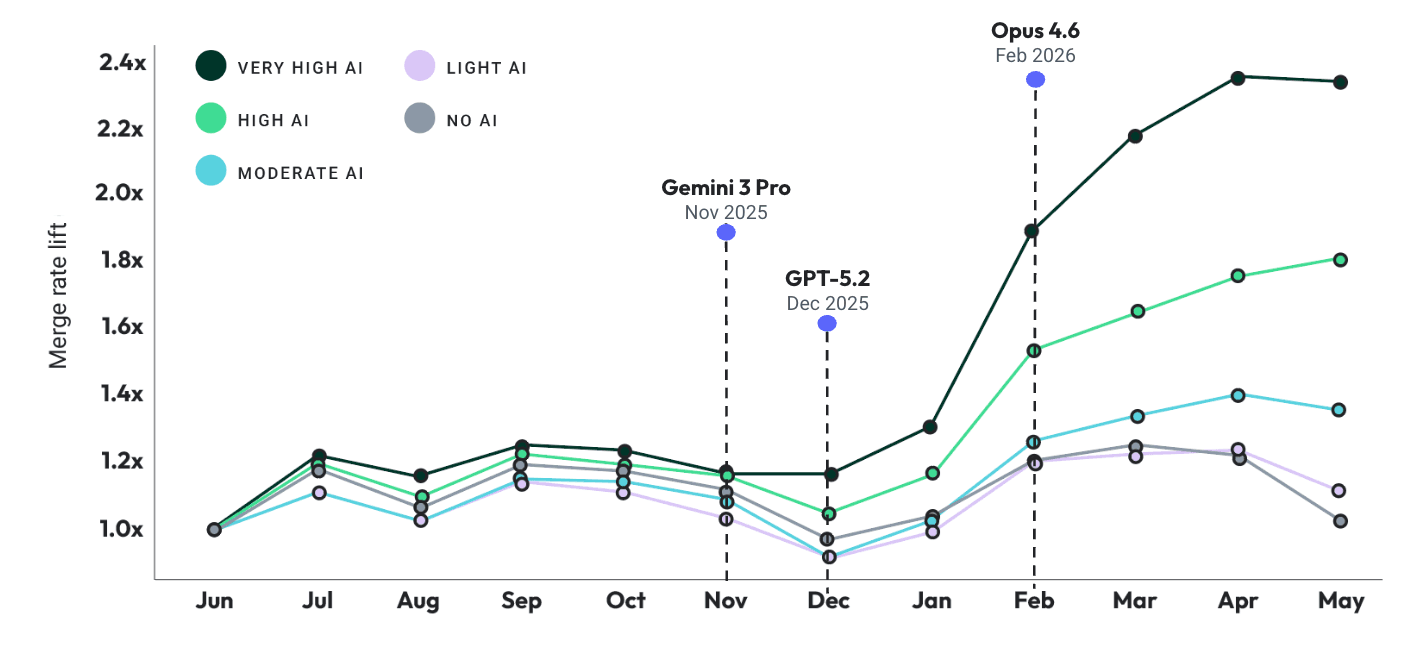
While velocity metrics like merge rate aren't always a good performance target, they do often provide a good way of identifying significant changes to your SDLC. Measuring the change to merge rate is a good indicator of how AI is impacting velocity. You can track this data within LinearB in the new AI ROI dashboard.
Monitor software quality as AI usage scales
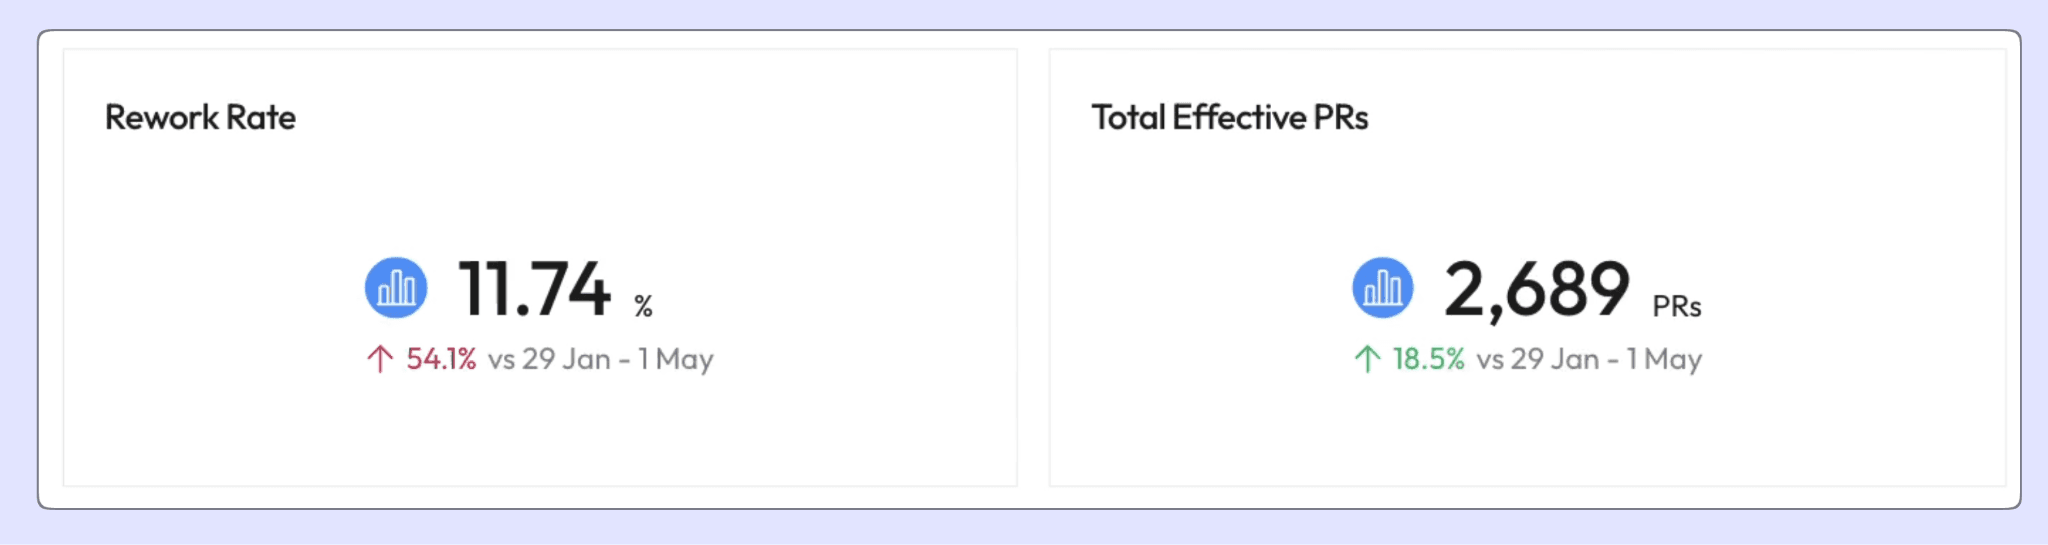
Rework rate is the share of your merged work that needs to be redone. A PR you merge and then go back to rewrite spends from your AI budget twice. It matters more as AI usage scales because AI PRs are often larger and get accepted less often.
Use quality signals, such as rework, as the guardrail for maintaining quality. If cost per PR is falling, but rework is rising, use this data to facilitate a more informed conversation about how to drive improvement.
Take control of what your AI spend returns
You opened this quarter with a rising invoice and a hunch. Cost per effective PR turns that hunch into a number you can defend, because it represents your team's ability to efficiently achieve a positive impact with AI. With LinearB, the executive conversation shifts from cost to impact.
Start your free trial →
Book a demo →


