# All You Should Know About Mean Time to Restore | LinearB Blog

> In this post, let’s learn about mean time to recovery (MTTR), a metric that shows how efficient an engineering team is at fixing problems.

_This is a markdown rendering of a live HTML page on linearb.io, generated for AI/LLM consumption — it is not a markdown-only site. To get the full HTML page instead, request this URL with an explicit `Accept: text/html` header (no wildcard, no markdown preference)._

[Blog](https://linearb.io/blog)

/

All You Should Know About Mean Time to Restore

# All You Should Know About Mean Time to Restore

![Photo of Oscar Jite-Orimiono](https://assets.linearb.io/image/upload/c_limit,w_2560/f_auto/q_auto/v1/logo-mark-lg?_a=BAVMn6ID0)

By [Oscar Jite-Orimiono](https://linearb.io/blog/all-you-should-know-about-mean-time-to-restore#oscar-jite-orimiono)

|

April 8, 2022

![50_B14_EE_5_69_D0_4_E14_B82_F_F294_A8_E46200_scaled_e8ceb6577f](https://assets.linearb.io/image/upload/c_limit,w_2560/f_auto/q_auto/v1/50_B14_EE_5_69_D0_4_E14_B82_F_F294_A8_E46200_scaled_e8ceb6577f?_a=BAVMn6ID0)

Why are metrics important? 

Let’s say you own a little store that sells socks. If you get visitors daily, you may think this makes your business a success. But, of course, the number of visitors doesn’t paint the whole picture. You’d also be concerned about revenue and costs as well as the number of purchases, customer satisfaction, and repeat customers. And what about complaints?

You can compare the number of visitors to the number of people who purchase something; that becomes a more useful metric than just visitors alone. If you compare the number of visitors’ purchases to those satisfied with their purchase, you get another useful metric.

The right metrics give us concise, specific measurements of performance. They enable us to know whether things are going well and where we can improve. 

[![Helping Shiba Inu GIF Find & Share on GIPHY](https://media4.giphy.com/media/c5eqVJN7oNLTq/giphy.gif)](https://giphy.com/gifs/c5eqVJN7oNLTq) 

Measuring for success!

In this post, you’re going to learn about [mean time to restore (MTTR)](https://linearb.io/linearb-mttr/), a metric that shows how efficient an engineering team is at fixing problems. We’ll then look at other incident metrics as well as the other metrics in the [DORA metrics framework](https://linearb.io/dora-metrics/).

## Table of Contents

* [What is Mean Time to Restore?](#what-is)
* [How to Calculate Mean Time to Restore](#calculate)
* [Incident Metrics](#incident)
* [DORA Metrics](#dora)
* [Importance of MTTR and DORA Metrics](#importance)
* [Parting Words on Mean Time to Restore](#parting)

## What Is Mean Time to Restore?

**Mean Time to Restore (MTTR) is the average amount of time it takes to recover from an incident.** An incident is an event that leads to an interruption of normal operations. In other words, they are anything that cause downtime, like bugs or external system outages. 

Mean Time to Restore is a key metric in any incident management system, since it captures the severity of the impact – that is, how long the application was down for.

A lot of attention is paid to optimizing application performance while it’s live. But keep in mind that when your application is down, its performance is 0\. Time spent avoiding downtimes should be viewed as a crucial investment in application performance. 

I should note before going any further that the acronym MTTR actually stands for four things! Mean Time to Restore is often used interchangeably with Mean Time to Repair and Mean Time to Resolve, although some people [draw a distinction](https://www.atlassian.com/incident-management/kpis/common-metrics) between the terms. 

What’s important to know is that Mean Time to Respond is a very different metric from the other three. It measures how long it takes to start addressing an issue that has arisen. (Below we’ll discuss the metric Mean Time to Acknowledgement which is similar.) 

## How to Calculate Mean Time to Restore

MTTR is calculated by adding up total downtime and dividing by the total number of incidents within a particular time period. The formula is simple:

![Formula for Mean Time to Restore](https://assets.linearb.io/uploads/Screen-Shot-2022-04-08-at-1.49.43-PM-1024x180.png)

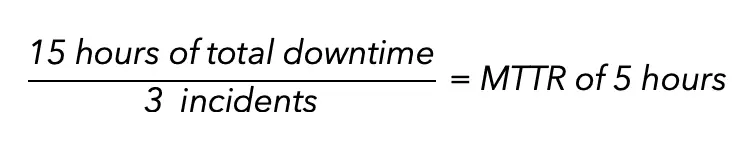
For instance, say your car breaks down three times in two weeks. It took, respectively, two, five, and eight hours to fix, which adds up to 15 hours of total downtime. The MTTR for that two-week period is five hours:
![Calculation given in the example](https://assets.linearb.io/uploads/Screen-Shot-2022-04-08-at-11.07.03-AM.png)

### How to Reduce MTTR

Long and frequent downtimes can cause your company to contravene service level agreements (SLAs) which will directly result in lost revenue. This means that the business side also has a vested interest in lowering MTTR.

MTTR should be as short as possible. High-performing engineering teams typically recover from incidents within minutes or a few hours and can fix multiple issues in a day. Here are some ways MTTR can be lowered and thus improved:

* Build out continuous integration/continuous delivery (CI/CD) systems that automate monitoring, testing, and failure detection.
* Make small changes frequently. Deploying in fixed intervals during the day ensures failures can be easily tracked, and the changes that cause failures can be fixed or rolled back. You could also use feature flags to turn off changes made in recent deployments.
* Have the right tools, processes, and permissions in place. The developers working on a project should have all they need to fix issues immediately. Also, it’s important to maintain the same team members throughout the development process so that the people most familiar with the code are available to address issues when they arise.
* Consider creating a devops team. These are quickly becoming popular as companies appreciate the importance and complexities of keeping their applications up and running.

![Quote: Highperforming engineering teams typically recover from incidents within minutes or a few hours and can fix multiple issues in a day.](https://assets.linearb.io/uploads/9315A1F8-5257-4243-A8F0-6EEF24A2E13E.png)

### What Is a Good MTTR?

Generally, incident response times should be as short as possible, but **a good rule of thumb is that MTTR shouldn’t exceed a day.** That said, even 24 hours might be too long for some teams; a lot can happen in that time. 

Remember, high-performing teams can recover within a few hours, and every second in the recovery period counts. As a team lead, you’ll have to decide what is feasible for your team and what makes the most sense for your business and your application.

It’s best to start by establishing your team’s current MTTR. You can then set a goal to work toward, track your progress, and see how much your team improves. If the team meets the goal, you can set a new one. If the goal was too ambitious, scale it back. The specific target is not as important as driving toward improvement. 

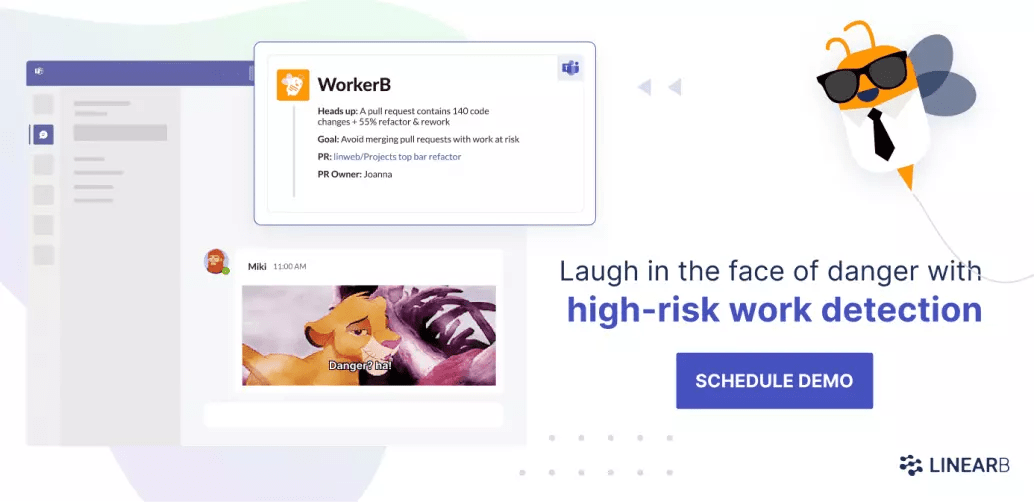
LinearB can facilitate this entire improvement process – from establishing the baseline, goal setting, and progress tracking. We have tools, like our WorkerB automation bot, that can do things like notify the team of a pull request that contains code that could cause a bug so that you can prevent an outage all together. 
[![Laugh in the face of danger with high risk work detection. Schedule a demo of WorkerB.](https://assets.linearb.io/uploads/High-risk-Work-1-1024x497.png)](https://linearb.io/demo)

Want to eliminate risky behavior around your PRs? [Book a demo of LinearB today.](https://linearb.io/demo/)

## Incident Metrics

We’ve established that MTTR tracks incident recovery and that its aim is to reduce downtime. However, in the SDLC, recovery is only one step in an incident response system. Tracking other [incident metrics](https://www.atlassian.com/incident-management/kpis/common-metrics#:~:text=What%20is%20mean%20time%20to%20recovery%3F,it%20becomes%20fully%20operational%20again) alongside MTTR will provide more insights into the reliability of an application.

Let’s look at a scenario: In a 30-day month, a software system breaks down four times. It takes the engineers 24 hours in total to resolve the four incidents. This puts MTTR at six hours.

We’ll refer back to this example as we explore other incident metrics below.

### Mean Time to Acknowledge (MTTA)

Once an incident occurs, how long is it before your team acknowledges the issue and gets to work diagnosing the problem? That’s what MTTA measures. **MTTA is the average time it takes an engineering team to acknowledge a new incident.** It is calculated as the sum of the time between detection and acknowledgment of the issue, divided by the total number of incidents:

![Formula for Mean Time to Acknowledge](https://assets.linearb.io/uploads/Screen-Shot-2022-04-08-at-11.26.35-AM-1024x104.png)

Suppose it took the engineers a total of 60 minutes from detection to acknowledge for each of those four incidents. MTTA will be 15 minutes (60 minutes / 4 incidents = MTTA of 15 minutes).

Before you can recover from an incident, your team must become aware of it. A lower MTTA will reduce downtime and improve MTTR.

### Mean Time Between Failures (MTBF)

**[MTBF](https://www.atlassian.com/incident-management/kpis/common-metrics#:~:text=MTBF%3A%20Mean%20time%20between%20failures) is the average time from one incident that causes failure to the next.** This is a key failure metric that captures the frequency of system failures. It’s the total hours of operation, or uptime, divided by the number of incidents:

![Formula for Mean Time Between Failures](https://assets.linearb.io/uploads/Screen-Shot-2022-04-08-at-11.31.06-AM-1024x150.png)

From the above example, a 30-day month has 720 hours. The total downtime was 24 hours, so uptime is 696 hours. As a result, MTBF will be 174 hours (696 hours / 4 incidents = MTBF of 174 hours).

## DORA Metrics

MTTR is one of [four key metrics](https://linearb.io/blog/dora-metrics/) identified by the DORA (DevOps Research and Assessment) team, a Google research group. The DORA metrics together capture the overall health and performance of software engineering teams. 

The other DORA metrics are:

1. Deployment Frequency
2. Mean Lead Time for Changes
3. Change Failure Rate

Let’s briefly look at each one of these.

### Deployment Frequency

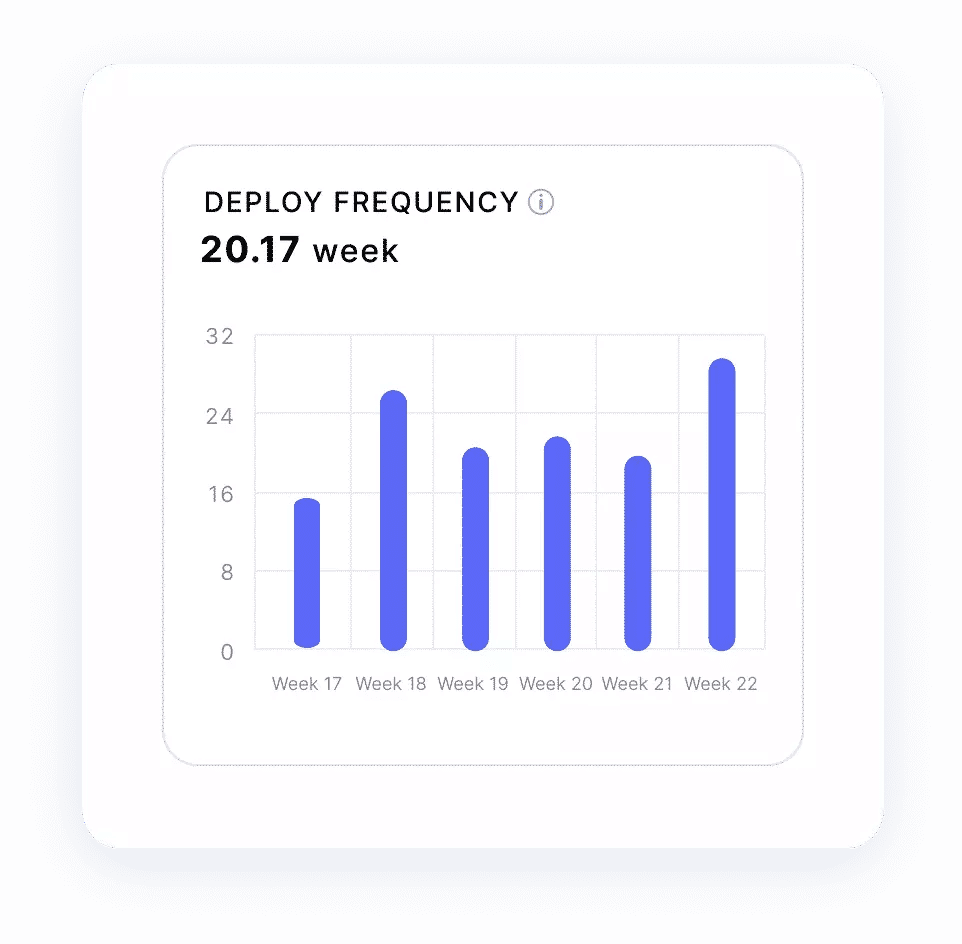
[Deployment frequency](https://linearb.io/blog/deployment-frequency/) measures how often new code is deployed into production. It measures the speed or agility of a team. [Elite teams deploy multiple times a day](https://linearb.io/engineering-benchmarks/). 

![deployment frequency](https://assets.linearb.io/uploads/deploy-frequency.png)

### Mean Lead Time for Changes

[Mean Lead Time for Changes](https://linearb.io/blog/dora-metrics/#mean-lead-time-for-changes), or change lead time, is how long it takes to commit changes to a project. It’s measured from the start of development to when the code is ready for deployment – that is, when the code has gone through all necessary checks.

Engineers who want to improve their efficiency can go beyond this single metric and measure [cycle time](https://linearb.io/blog/cycle-time-measuring-and-improving-team-process/). Cycle time spans the time it takes for new changes to be developed, tested, and then deployed.

### Change Failure Rate

[Change Failure Rate](https://linearb.io/blog/change-failure-rate/) is the percentage of code changes that cause failures in production. To calculate it, count the number of deployments that lead to failures and divide by the total number of deployments.

## Importance of MTTR and DORA Metrics

MTTR and the rest of the DORA metrics may seem simple, but this is only because they were carefully selected after six years of research. The DORA team at Google surveyed thousands of engineers and concluded that teams that did well across these four metrics recorded high levels of customer satisfaction and profitability and also provided the most value. DORA metrics are now the industry-standard way of tracking development team performance. 

LinearB’s Co-Founder, Dan Lines, has spoken with loads of engineering leaders about the metrics they rely upon. We put together a compilation of what they had to say about the immense value of DORA metrics specifically:

## Parting Words on Mean Time to Restore

The main goal of any software engineering team is to deploy as often as possible, as efficiently as possible. Knowing the right set of metrics to monitor is the first step toward achieving this goal. 

I hope that by now you are convinced that MTTR is a key metric because it tells you how quickly your team can get your application up and running again after it goes down. 

MTTR is a great starting point but keep in mind that metrics don’t work well in isolation. MTTR works best alongside the other DORA metrics.

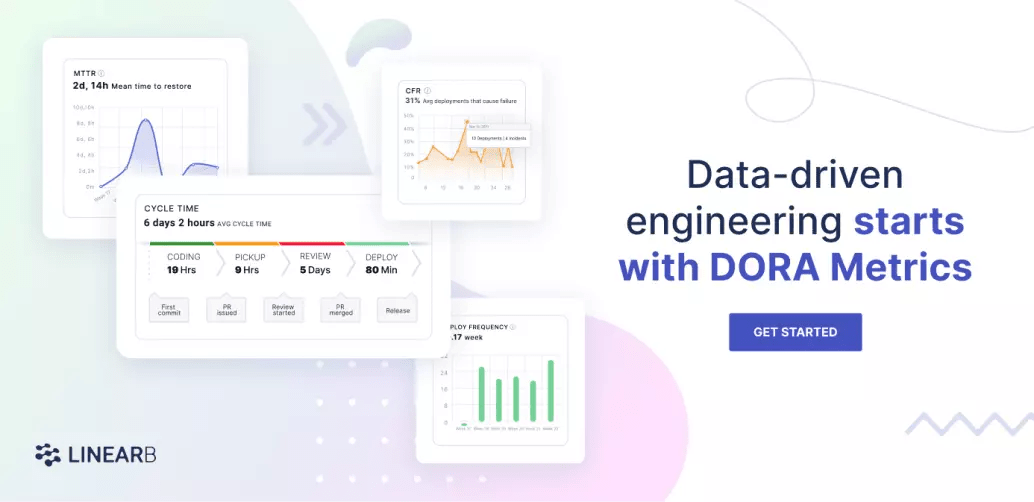
LinearB makes it easy to implement monitoring systems and start tracking and improving DORA metrics in your engineering org. We integrate with Git and SDLC management tools like GitHub, GitLab, and Jira to generate metrics which you can see in easy-to-read charts. On top of this, our goal-setting framework and automation tools will help your team start improving immediately. 
[![datadriven engineering starts with DORA metrics](https://assets.linearb.io/uploads/DORAMetrics-1024x497.png)](https://linearb.io/get-started/)

LinearB provides DORA metrics right out of the box so you can discover your DORA metrics in minutes. [Get started today!](https://linearb.io/get-started/)

## Improve developer productivity with LinearB

Find us on

[](https://www.linkedin.com/company/linearb)
[](https://devinterrupted.substack.com/)

## Your next read

[![Cover image for AI ROI comes from measuring engineering outcomes on day one](https://assets.linearb.io/image/upload/c_limit,w_2560/f_auto/q_auto/v1/Blog_AI_ROI_comes_from_measuring_engineering_software_security_2400x1256_2c5eae0862?_a=BAVMn6ID0)](https://linearb.io/blog/kraken-nik-sudan-measure-ai-roi-engineering-outcomes)

Eng. Metrics

[AI ROI comes from measuring engineering outcomes on day one](https://linearb.io/blog/kraken-nik-sudan-measure-ai-roi-engineering-outcomes)

Kraken Engineering Operations Lead Nik Sudan details how to establish day-one data infrastructure to accurately measure AI ROI. Discover why raw token adoption...

[![Cover image for AI is rebuilding software delivery from SDLC to ADLC](https://assets.linearb.io/image/upload/c_limit,w_2560/f_auto/q_auto/v1/Blog_AI_rebuilding_software_delivery_2400x1256_3fd5887e75?_a=BAVMn6ID0)](https://linearb.io/blog/sdlc-to-adlc-agentic-software-delivery-transformation)

Eng. Metrics

[AI is rebuilding software delivery from SDLC to ADLC](https://linearb.io/blog/sdlc-to-adlc-agentic-software-delivery-transformation)

Discover how engineering organizations are transitioning from the traditional SDLC to an Agentic Development Lifecycle (ADLC). Learn why rising token costs...

[![Cover image for 8 million pull requests reveal where engineering productivity breaks down](https://assets.linearb.io/image/upload/c_limit,w_2560/f_auto/q_auto/v1/Blog_8_million_pull_requests_2400x1256_03724bfbb2?_a=BAVMn6ID0)](https://linearb.io/blog/8-million-prs-engineering-productivity)

Eng. Metrics

[8 million pull requests reveal where engineering productivity breaks down](https://linearb.io/blog/8-million-prs-engineering-productivity)

8.1M pull requests reveal the gap between AI adoption and engineering impact, and why code review is the bottleneck blocking real productivity gains.

## Structured data

_Machine-readable metadata (JSON-LD) embedded in the page for search/AI context — not content rendered on the page itself._

```json
{
  "@context": "https://schema.org",
  "@type": "Organization",
  "name": "LinearB",
  "url": "https://linearb.io",
  "logo": "https://assets.linearb.io/image/upload/v1715628027/logo-mark-lg.svg",
  "description": "LinearB is the engineering productivity platform that helps engineering leaders prove AI is improving throughput without sacrificing delivery confidence, flow efficiency, or developer experience.",
  "sameAs": [
    "https://www.linkedin.com/company/linearb"
  ],
  "award": [
    {
      "@type": "Award",
      "name": "LinearB is a Leader in the 2026 Gartner® Magic Quadrant™ for Developer Productivity Insight Platforms",
      "dateAwarded": "2026",
      "awardedBy": {
        "@type": "Organization",
        "name": "Gartner®"
      }
    },
    {
      "@type": "Award",
      "name": "Great Place to Work Certification",
      "dateAwarded": "2025-2027",
      "awardedBy": {
        "@type": "Organization",
        "name": "Great Place to Work"
      }
    },
    {
      "@type": "Award",
      "name": "America's Best Startup Employers 2025",
      "dateAwarded": "2025",
      "awardedBy": {
        "@type": "Organization",
        "name": "Forbes Magazine"
      }
    }
  ],
  "hasCertification": [
    {
      "@type": "Certification",
      "name": "SOC 1 Type 2"
    },
    {
      "@type": "Certification",
      "name": "SOC 2 Type 2"
    },
    {
      "@type": "Certification",
      "name": "GDPR Compliance certification"
    },
    {
      "@type": "Certification",
      "name": "ISO 27001"
    }
  ]
}
```

```json
{
  "@context": "https://schema.org",
  "@type": "Article",
  "headline": "All You Should Know About Mean Time to Restore",
  "url": "https://linearb.io/blog/all-you-should-know-about-mean-time-to-restore",
  "author": {
    "@type": "Person",
    "name": "Oscar Jite-Orimiono"
  },
  "datePublished": "2022-04-08T13:26:00.000Z",
  "dateModified": "2022-04-08T13:26:00.000Z",
  "image": "https://assets.linearb.io/image/upload/v1720000000/50_B14_EE_5_69_D0_4_E14_B82_F_F294_A8_E46200_scaled_e8ceb6577f.jpeg",
  "publisher": {
    "@type": "Organization",
    "name": "LinearB",
    "logo": "https://assets.linearb.io/image/upload/v1777485755/linearb-logo-2026.png"
  },
  "description": "In this post, let’s learn about mean time to recovery (MTTR), a metric that shows how efficient an engineering team is at fixing problems.\n"
}
```

## More on linearb.io

### Top navigation

- [Book a Demo](https://linearb.io/book-a-demo)
- [AI Code Reviews — Catch security risks, bugs, and spec mismatches](https://linearb.io/platform/ai-code-reviews)
- [AI & Productivity Insights — See how AI tools affect cycle time and delivery speed](https://linearb.io/platform/ai-developer-productivity-insights)
- [Measure AI Impact — Track AI adoption and tie it to delivery outcomes](https://linearb.io/use-case/measure-ai-impact)
- [MCP Server — Chat with your data to spot patterns and boost output](https://linearb.io/platform/mcp-server)
- [Resource Allocation — Cost initiatives and shape your investment strategy](https://linearb.io/platform/resource-allocation)
- [Cost Capitalization — Capitalize engineering costs with audit-ready reports](https://linearb.io/platform/cost-capitalization)
- [Dev Team Management — Set targets and tie throughput to business outcomes](https://linearb.io/platform/goals-and-reporting)
- [DevOps Workflow Automation — Policy-based PR routing, approvals, and tests](https://linearb.io/platform/ai-workflow-governance)
- [AI Powered Support — Unify AI and human code delivery in one clear view](https://linearb.io/use-case/ai-powered-support)
- [Optimization — Surface friction with feedback and MCP insights](https://linearb.io/platform/developer-experience)
- [Reporting — Spot what's working and what needs attention](https://linearb.io/use-case/measuring-developer-experience)
- [Surveys — Turn developer feedback into actionable signals](https://linearb.io/platform/developer-surveys)
- [Platform overview](https://linearb.io/platform/overview)
- [Register now](https://linearb.io/event/engineering-productivity-gap)
- [Customers](https://linearb.io/customers)
- [Pricing](https://linearb.io/pricing)
- [Why choose LinearB — Explore your data. Measure performance. Act to improve it.](https://linearb.io/why-linearb)
- [APEX framework — The operating model for AI-era engineering teams](https://linearb.io/resources/apex-framework)
- [Anti-FAQ — The questions other vendors won't answer](https://linearb.io/why-linearb/anti-faq)
- [Security — Enterprise-grade compliance and zero code access](https://linearb.io/security)
- [Build vs. buy — The hidden cost of building it yourself](https://linearb.io/resources/build-vs-buy)
- [Dev Interrupted Podcast — Conversations with engineering leaders](https://linearb.io/dev-interrupted/podcasts)
- [Reports & Guides — Deep dives on productivity and delivery](https://linearb.io/resources)
- [Webinars — Expert sessions on productivity and AI](https://linearb.io/resources?category=workshops)
- [Metrics Benchmarks — See how your engineering org stacks up](https://linearb.io/resources/software-engineering-benchmarks-report)
- [Blog — Product updates and practical insights](https://linearb.io/blog)
- [Help Center — Documentation, setup, and support](https://linearb.helpdocs.io)
- [API Docs](https://docs.linearb.io/api-overview)
- [Status](https://www.linearbstatus.com/)
- [Integrations](https://linearb.io/integrations)
- [LinearB is a Leader in the 2026 Gartner® Magic Quadrant™ for Developer Productivity Insight Platforms](https://linearb.io/resources/gartner-magic-quadrant-dpi-platforms-2026)
- [Sign in](https://app.linearb.io/login)
- [Enterprise](https://linearb.io/solutions/enterprise)
- [Contact](https://linearb.io/contact-us)
- [About us](https://linearb.io/about-us)
- [Careers](https://linearb.io/careers)
- [Service agreement](https://linearb.io/services-agreement)
- [Privacy policy](https://linearb.io/privacy-policy)
- [DPA](https://linearb.io/data-processing-agreement)
- [Security FAQ](https://linearb.io/security-faq)
- [Substack](https://devinterrupted.substack.com/)

### Footer

_Additional links from the site footer, not repeated from the top navigation above._

- [GitHub](https://github.com/linear-b)
- [LinkedIn](https://www.linkedin.com/company/linearb)
- [Twitter](https://twitter.com/LinearB_Inc)