Metrics, metrics, metrics—love them or hate them, in the world of software engineering, they’re here to stay.
To get an accurate measure of how much your system is improving, or not improving, you need to track the right set of metrics that align with your business and development goals.
One important aspect of DevOps is the continuous delivery of value to end users. In this post, we’re looking at deployment frequency. This metric tracks how much value teams can deliver to the users. We also will cover how to measure it and learn why it’s important. Furthermore, we’ll look at corresponding metrics that can contribute to achieving a good deployment frequency.
Table of Contents
- What Is Deployment Frequency?
- How to Measure Deployment Frequency
- Importance of Deployment Frequency
- How to Improve Deployment Frequency
- Corresponding Metrics
- Start Tracking Deployment Frequency in Minutes
What Is Deployment Frequency?
Deployment frequency is how often new code changes are deployed to production. It’s a measure of a team’s speed and agility. This metric tracks how quickly teams can release new features or fixes.
Elite and high-performing teams have the ability—and capacity—to make multiple deployments in a day, on-demand.
How to Measure Deployment Frequency
Engineering teams measure deployment frequency by simply counting how many times they make deployments during a particular period. This metric is very easy to measure. Teams can choose to measure deployments per week or per day.
So, in a month, suppose your team deploys five times in the first week, seven times in the second, nine times in week three, and three times in the final week. In this case, the deployment frequency is six deployments per week.
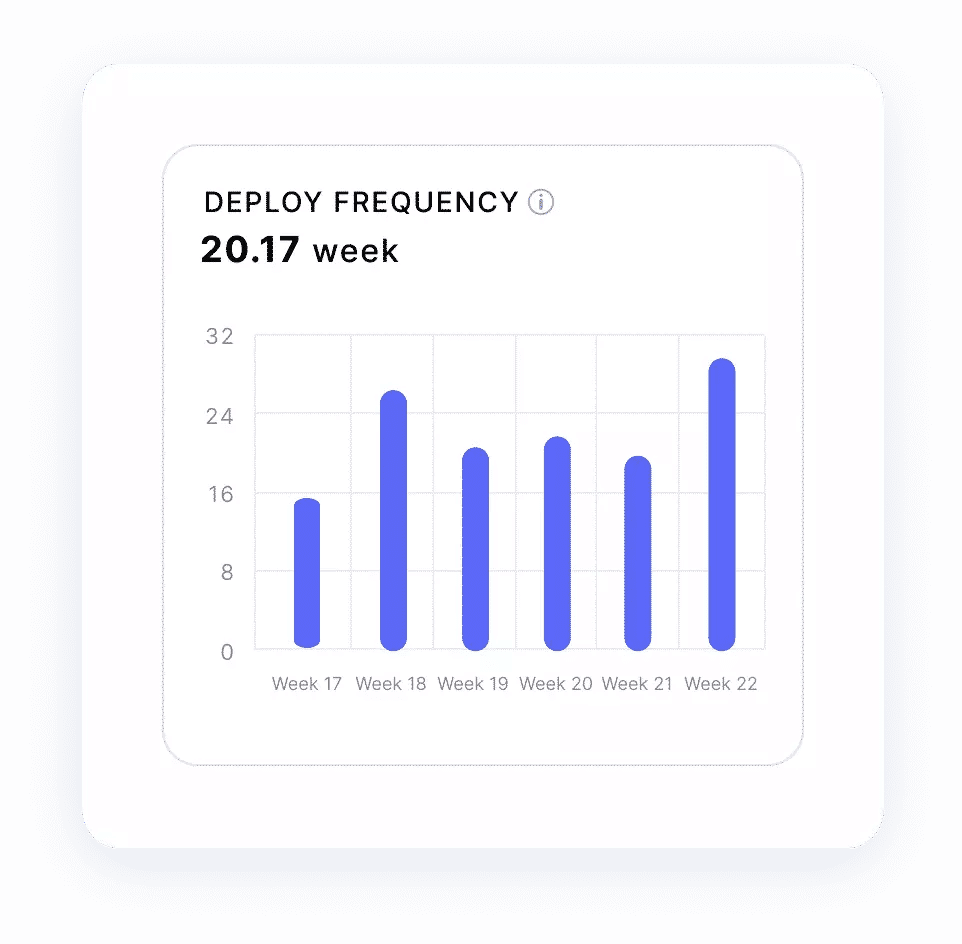
It’s important to note that deployment frequency covers every type of code change made. It can either be a new feature or a quick fix.
What Is a Good Deployment Frequency?
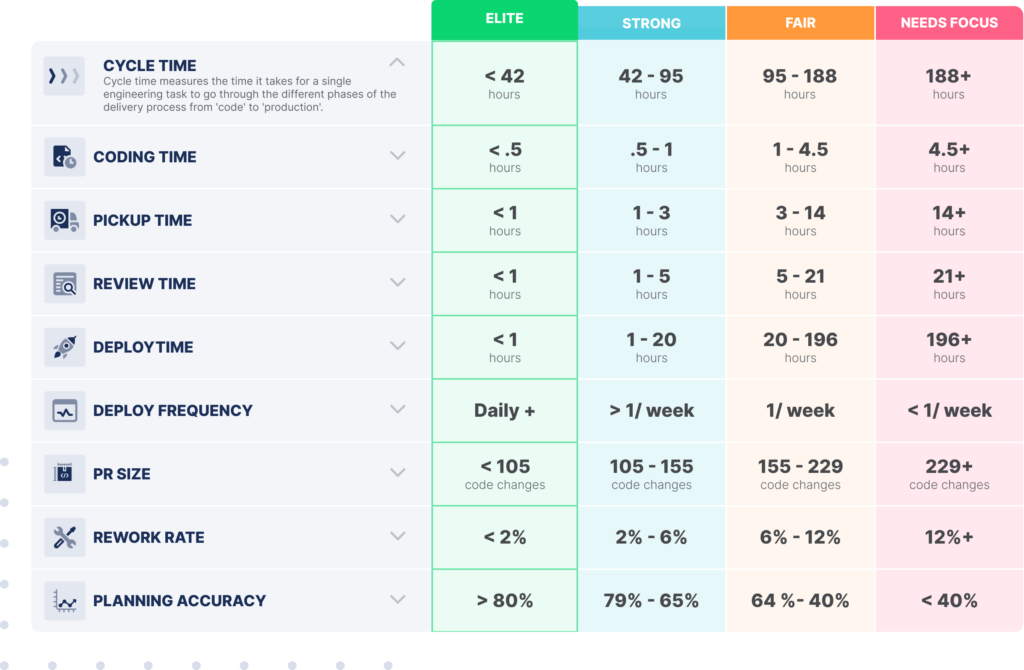
Deployment frequency is one of the DORA metrics chosen by Google’s research team after studying thousands of software engineering companies in a six-year program. According to the DORA team, high-performing teams make between one deployment per day and one per week. The elite performers, on the other hand, deploy on-demand multiple times in one day.
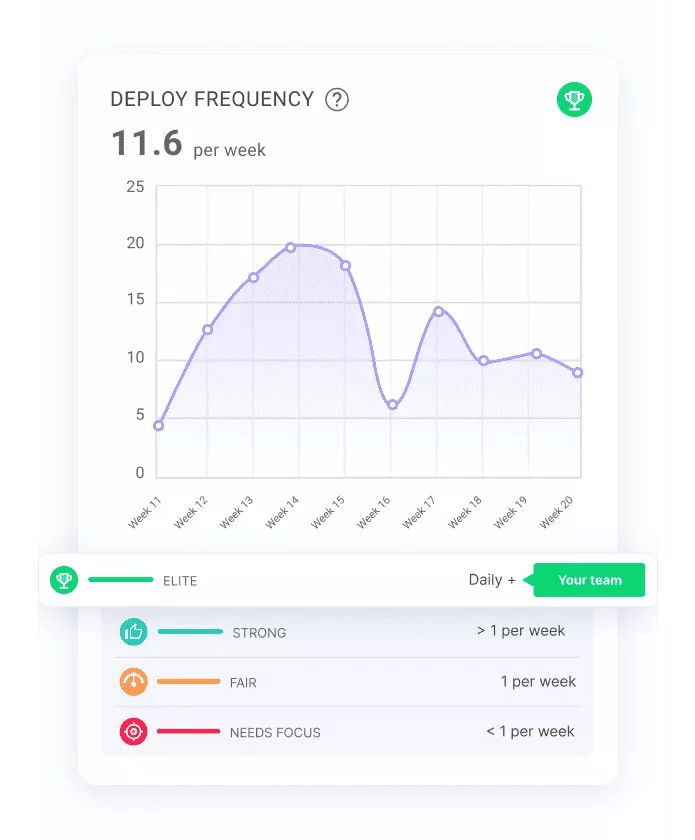
So, if your team is making deployments once in a month or once in six months, you’re in the low-performers section and must make the necessary improvements to push that number up.
Importance of Deployment Frequency
As we’ve seen, deployment frequency is a DORA metric, and engineering teams that perform well across these metrics will see record-high levels of success.
Deployment frequency is usually the first metric teams measure. It’s also the easiest, as you’re only counting the number of times you make code changes and keeping track of that total over time. This metric helps measure your teams’ productivity and agility—that is, how quickly you can release new features or fix issues.
How to Improve Deployment Frequency
Engineering teams want to deploy as often as possible. This is the goal—quick, high-quality code. The faster you deploy, the more value you can deliver to the users.
Here are some best practices that can improve your deployment frequency:
- Build automated CI/CD systems into your delivery pipeline to handle things like testing, deployment, and monitoring.
- Reduce the deployment size. Make small changes at a time—this reduces the risk of deploying bugs. This way, the developers understand the cause of any failure and can quickly roll back those changes. Also, the developers who write the code are in the best position to understand any subsequent failure and keep them together through to the deployment phase.
- Have all the processes in place, tools ready, and permissions needed in the development environment.
- Set goals such as how often you want to deploy in a week. Have an attainable target and work toward it. Consider your team’s capacity to deliver as well.
Corresponding Metrics
We’ve seen that deployment frequency is how many times code changes are deployed to production. Now, simply counting the number of deployments, while good, will still lack some useful elements. There are several metrics that contribute to the improvement of the deployment frequency.
Cycle Time
Cycle time is how long it takes code to move from development to deployment. It starts from the first commit and ends at creating a pull request. This is also a DORA metric. It’s often measured with mean lead time for changes or change lead time. The change lead time spans the period from development to when the code is ready for deployment.
Deployment frequency is how often you make changes, and cycle time is how long it takes to deliver those changes to production. Cycle time is also a productivity or speed metric. It measures the agility of a team. Elite and high-performing teams have their cycle times fall between one day and one week. Low cycle times mean a higher deployment frequency.
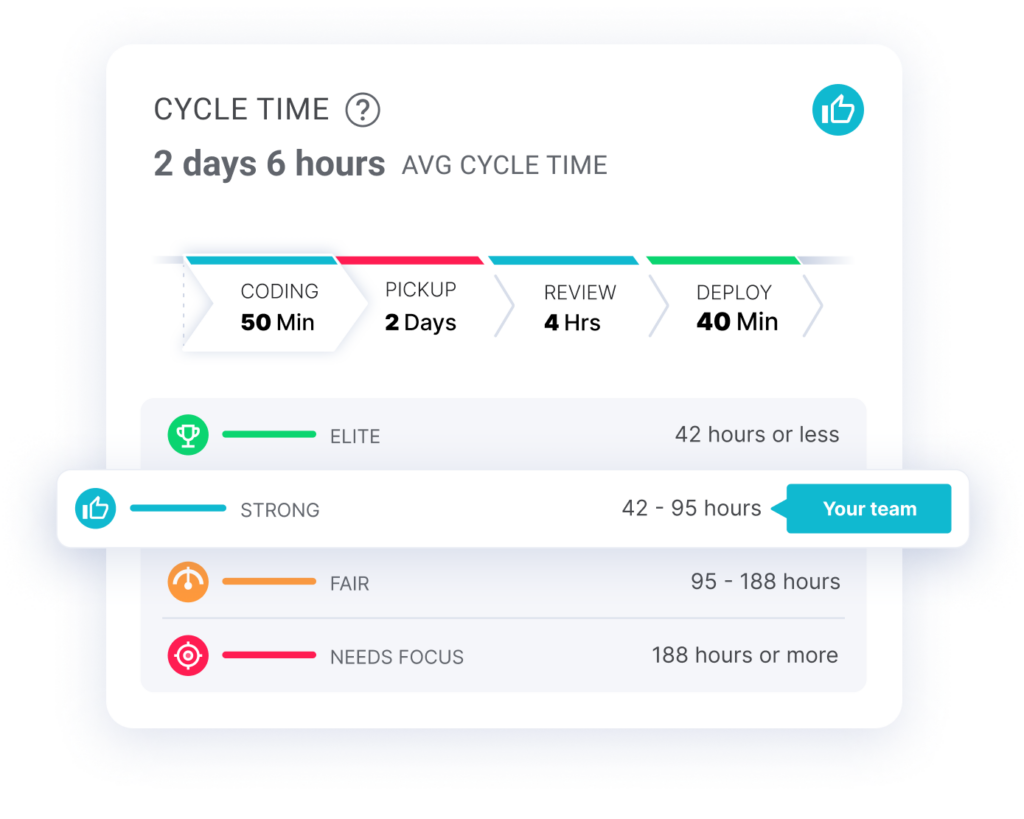
Cycle time contains four phases that serve as submetrics: coding time, or the period where the changes are developed and a pull request is made; pickup time, or how long it takes to acknowledge the pull request; review time, or the place the code reviews are done and the code is made ready to merge into the main branch; and the last phase is deployment time, or when the code is released.
Does the pull request sit for a week before the review starts? Or does the review process take too long? LinearB will help you identify where you’re wasting time across these four phases of cycle time. Finding and eliminating the cause of these delays will increase your deployment frequency.
Code Coverage
Code coverage is the percentage of code that’s covered by tests. It’s how many lines of code your CI/CD system covers during testing. Testing a high percentage of your code increases the likelihood of finding bugs and broken code. You want to deliver frequently, and you also don’t want to frequently deliver bugs.
There are four types of code coverage, and we’ll see them one after the other.
- Line coverage—this is a measure of the percentage of the total number of lines of code that the test executes.
- Statement coverage—this measures how many statements from the code the test covers.
- Function coverage—this covers how many functions in your code are tested.
- Branch coverage—this shows if all branches in a codebase are covered in the test.
Code coverage increases a team’s confidence to deploy frequently, without delay, and helps them catch bugs early in the development process so releases don’t have to be postponed as much.
Start Tracking Deployment Frequency in Minutes
Software engineers need to clearly assess their performance and see what areas in their software delivery process need improvement.
If you can measure it, you can track it over time, and this will show how well your team is progressing toward their goals.
The first metric engineering teams are likely to measure is the deployment frequency. The ability to make frequent deployments is key to delivering a steady flow of value to the users. But, in the quest for continuous delivery, code quality cannot be overlooked, so maintain good practices.
LinearB can help deliver all these metrics and more. We make use of a custom metrics dashboards to get visibility into your teams’ efficiency and compare their performance with known industry standards like the DORA metrics. You can easily integrate LinearB into your existing management tools. Get started with our free account for teams <8 today, or schedule a demo if you want to measure deployment frequency across multiple teams.
