Software metrics are important for software teams as they give insight into various aspects of the software development cycle. These metrics give tech leads and product managers the necessary information needed to make business decisions.
Code Climate’s Velocity is a great product with many features to help improve software teams. However, for small teams and start-ups, the pricing is on the high side. There are also features that small teams may not need, and in this case, the platform becomes underserved.
This article will cover some Code Climate alternatives and how they can help your software team to scale.
Table of Contents
LinearB
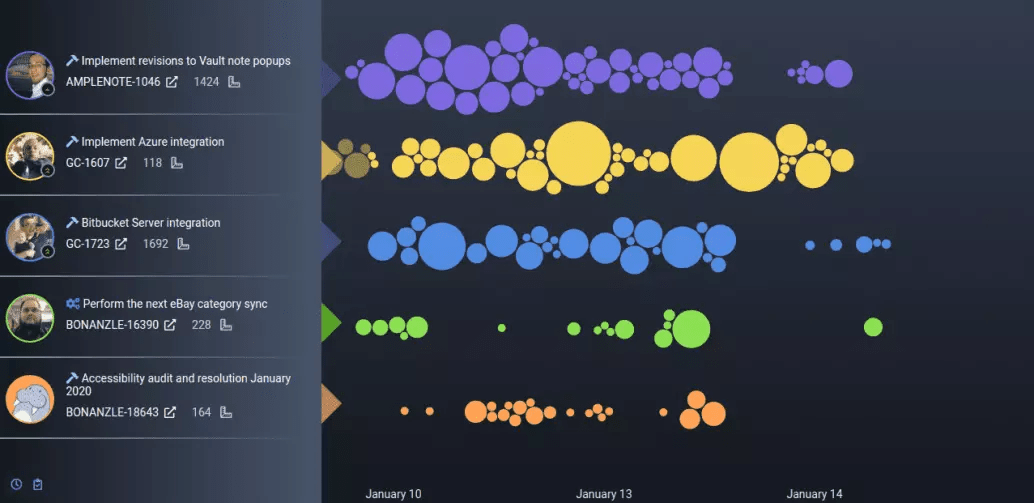
LinearB is a software as a service (SaaS) platform that provides real-time insights into software projects and team metrics. There are no manual updates or developer interruptions because it generates insights from your Git commits. It correlates data from Git, projects, releases, and incidents to highlight your bottlenecks. Below are some of the key metrics it tracks.
Cycle Time
Cycle time is the amount of time it takes to get from the first commit to production release. This is an important metric because a short cycle time means a faster time to market. So this helps the team leads to identify issues that may be causing delays that affect cycle time.
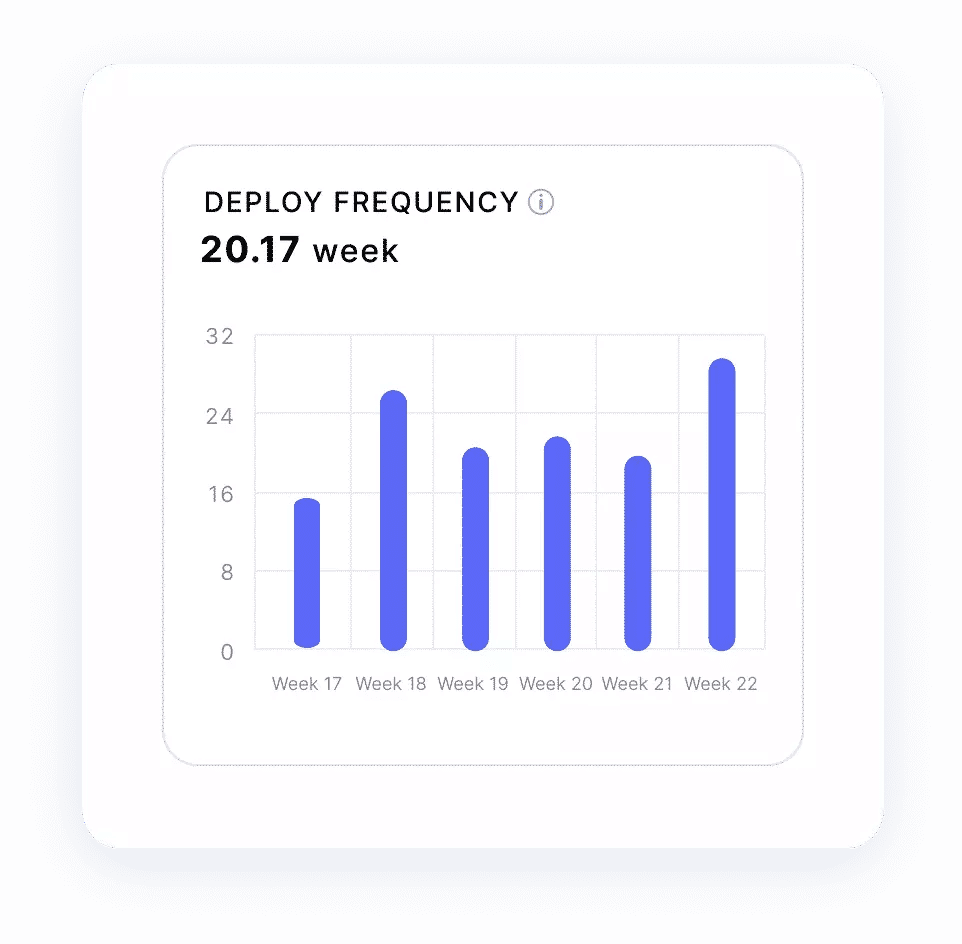
Deployment Frequency
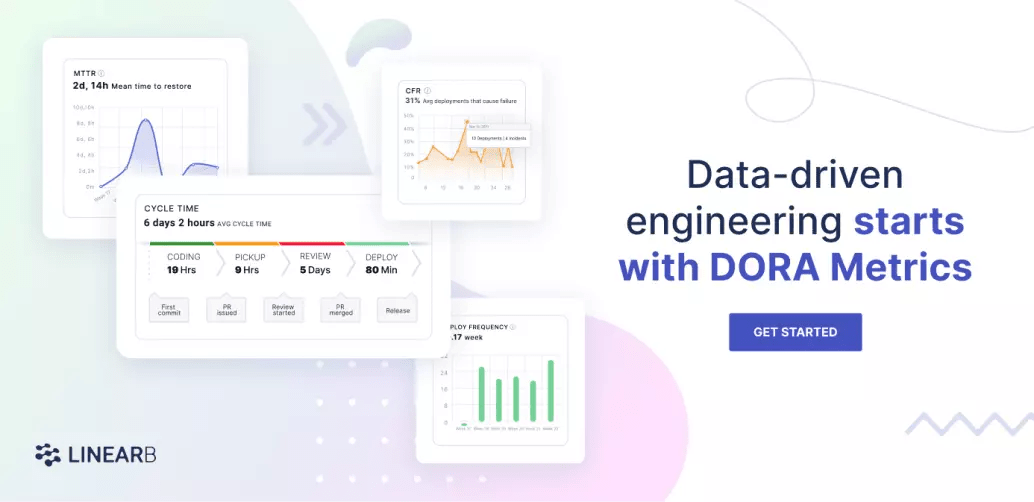
This indicator shows how many times the development team deploys every day. For example, a high number of deployments boosts team confidence as it indicates the team is pushing features/fixes fast. Learn how to better use DORA Metrics.
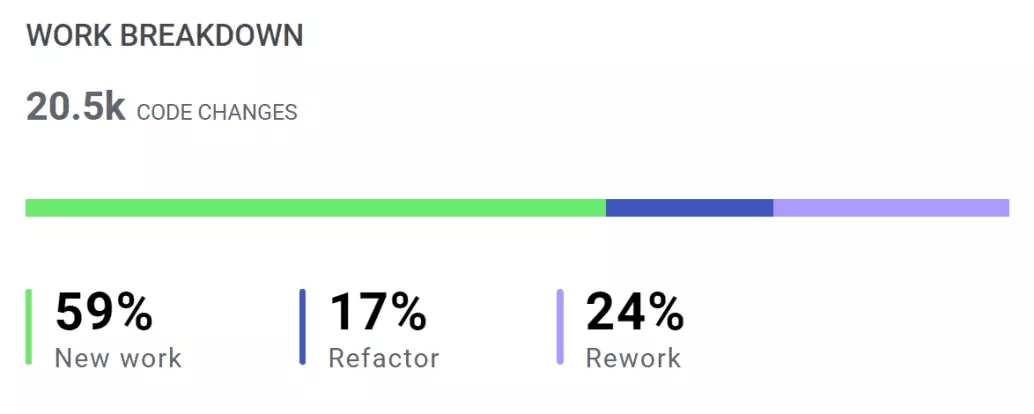
Rework Ratio
This shows the amount of code that has been merged that gets rewritten within a period of 21 days. A high rework percentage would point to quality issues during pull request (PR) reviews. The relevant parties can be identified, and a solution provided quickly.
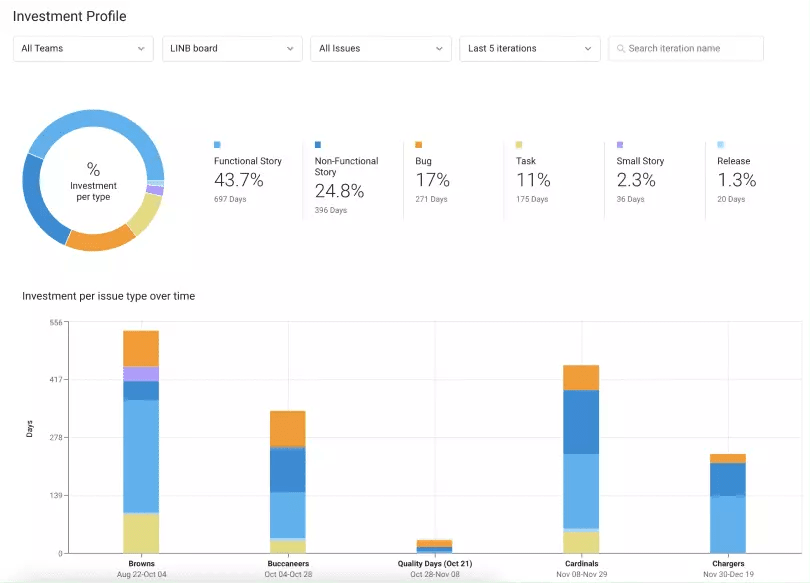
Investment Profile
The Investment profile metric indicates the amount of time the team spends on various kinds of tasks (e.g., bugs, features, etc.). This will show if there’s a good balance between user-facing features and nonfunctional requirements and debugging code.
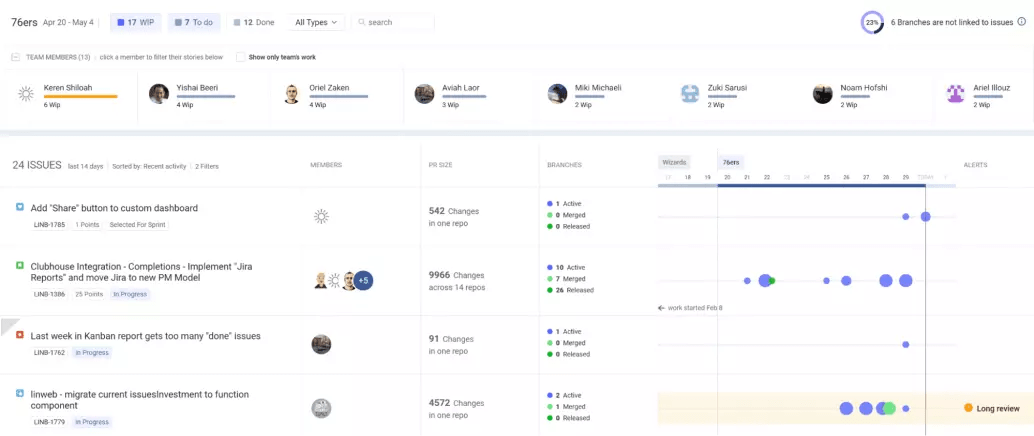
Pulse Check
LinearB also compiles a report that allows you to check the pulse of your team and iteration every day. The data includes WIP, shadow work, blockers like long reviews, etc.
Pricing
In terms of pricing, LinearB offers a free plan, which covers a team of up to eight developers. This gives enough room to test its core features with your team. To get started, register to create an account.
You can also upgrade to a paid plan at any time to get more features from the platform, such as customized team goals and project delivery tracker. Book a demo today!
GitClear
According to GeekWire, GitClear “reviews and summarizes your code, teasing out the fraction of work that has a meaningful impact on the codebase.” It’s another platform that shows trends in software teams based on the data gleaned from the Git commit history. In addition, it offers some key software team metrics.
Status Without Standups
The commit activity browser shows the Jira ticket each developer is working on and the amount of progress made. So this eliminates the need to pull in a developer merely to get status updates.
Google Maps for Repos
The directory structure shows the contribution each team member has made to various folders. This can be used to identify a developer who is being overworked or another who is not pulling their weight.
Identify Developer Areas of Expertise
The report shows the strength of each developer in the context of the projects. This is useful, for example, when a team lead wants to assign an Android ticket to a team member.
Inspect Pull Request Activity and Trends
Pull request activity shows the activity on pull requests from when they’re created to when they’re either merged or closed. It also shows how much time is spent reviewing PRs, which may show opportunities to improve the process.
Pricing
GitClear offers a 15-day free trial, which can be used to evaluate the features. Afterward, a paid plan is required to keep using the service.
SonarQube
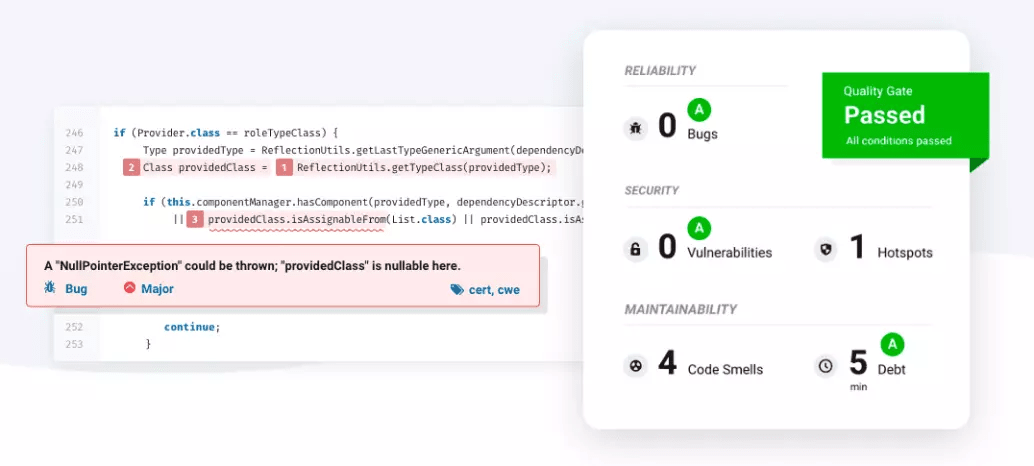
In contrast to the previous two platforms, SonarQube is a tool that offers code quality and security using static code analysis rules. It detects tricky bugs, spots code vulnerabilities, and helps prevent technical debt. It offers support for 27 programming languages and integrates smoothly with popular CI/CD tools. Some of its features include the following.
Security Analysis
It detects potential security issues using static application security testing (SAST). It ensures that security issues are spotted and resolved before getting to production. This saves time and money later in the development cycle.
Code Quality Assurance
SonarQube automatically runs static code analysis to track down bugs and ensure code quality. All that’s needed is your code repository, and it handles the rest.
Multilanguage Support
As mentioned above, SonarQube offers support for 27 programming languages with static analysis for code quality and security. It covers most of the languages you already use, so integrating is seamless and requires little configuration.
Open Source
SonarQube is an open-source project with 5,600 stars on GitHub. It’s actively developed with contributions from over 120 developers. As a result, there’s enough support from the community to help if issues arise.
Coveralls
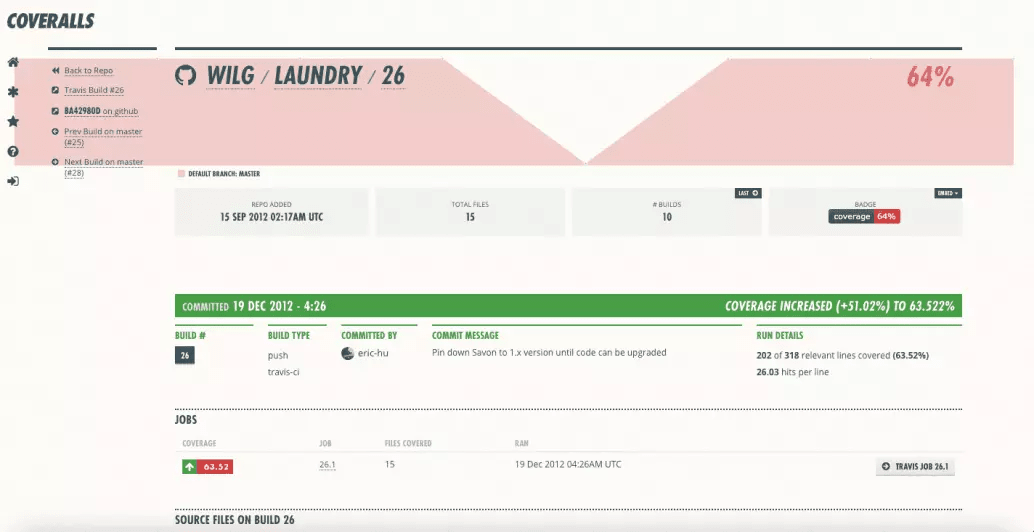
Coveralls helps software teams to deliver code confidently by checking how much of the codebase is tested by the test suites. Consequently, the resulting percentage determines the likelihood of an undetected bug making it to production. It also works with GitHub, GitLab, Bitbucket, and CI/CD platforms like Travis CI.
Some of its features can be seen below.
Free for Public Repositories
Coveralls is free to use for open-source projects. However, it offers paid plans for businesses and companies that want to use it in their private repositories.
Repository Statistics
At a glance, the dashboard can show you the coverage statistics of your repositories. Specifically, it shows how code coverage has changed over time. It also shows how team member contributions affect code coverage.
Notifications
Coveralls sends crucial information about code coverage through Slack, Gitter, email, and even webhooks.
Coverage Update
This shows how individual commits to the codebase have affected the coverage over time. This can be used to spot areas where more test suites are needed.
Integration With Code Hosting Providers and CI Services
Coveralls works well with git repository managers like GitHub and GitLab. Similarly, it integrates smoothly with CI services like Travis CI to ensure code coverage is automatically checked on each commit.
Code Climate Alternatives: Which Should You Choose?
The Code Climate alternatives covered in this article each have their own way of improving the software growth process.
SonarQube has been around for 18+ years (released between 2006 and 2007) and is the oldest platform on the list. But its focus is solely based on code quality and security, so this leaves little room for insights into team metrics.
Coveralls uses code coverage as the defining metric for ensuring code quality and integrity. In fact, it doesn’t offer much value in terms of software metrics for teams.
LinearB and GitClear are more modern platforms that offer the features of the previous two platforms. Equally, they also come packed with features suited to supercharge software teams by providing actionable insights.
While you’re likely to find advantages in each of the alternatives on this list, LinearB offers the most benefits to support you in scaling your software team.
LinearB helps you get your metrics dashboard set up quickly, allowing you to get started in as little as five minutes. Just connect your Git and project management providers, and it produces great insights for your team, putting Git activity in the context of project goals. As a result, team interactions become even more valuable.
Additionally, as mentioned, it has a free plan for a team of up to eight developers to get you started. And you can choose to upgrade later if your team expands or you need more features. In summary, it provides all the insights you need to make the most out of your team’s resources.
But even more, LinearB’s developer bot WorkerB automates annoying tasks and reminders that help your dev team improve organically, without the need for dozens of meetings to establish sustainable best practices.